Mask Bacterial Filtration Efficiency Tester Market Forecast and Outlook (2025-2035)

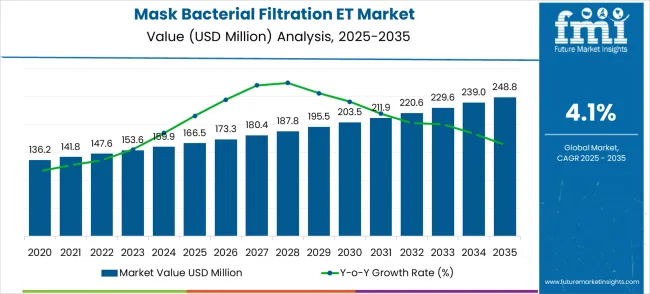
The mask bacterial filtration efficiency tester market is valued at USD 166.5 million in 2025 and is expected to reach USD 248.8 million by 2035, growing at a CAGR of 4.1%. From 2021 to 2025, the market increases steadily, progressing from USD 136.2 million to USD 166.5 million, with annual increments through USD 141.8 million, 147.6 million, 153.6 million, and 159.9 million. This phase is driven by the growing emphasis on health and safety standards, , which has heightened the demand for reliable testing equipment for mask filtration efficiency.
Quick Stats for Mask Bacterial Filtration Efficiency Tester Market

  • Mask Bacterial Filtration Efficiency Tester Market Value (2025): USD 166.5 million
  • Mask Bacterial Filtration Efficiency Tester Market Forecast Value (2035): USD 248.8 million
  • Mask Bacterial Filtration Efficiency Tester Market Forecast CAGR: 4.1%
  • Leading Filtration Efficiency in Mask Bacterial Filtration Efficiency Tester Market: Filtration Efficiency: BFE 80%~95%
  • Key Growth Regions in Mask Bacterial Filtration Efficiency Tester Market: Asia Pacific, North America, and Europe
  • Key Players in Mask Bacterial Filtration Efficiency Tester Market: GESTER INTERNATIONAL CO., LTD., Junray, TESTEX, Guangzhou Biaoji Packaging Equipment Co., Ltd, HAIDA INTERNATIONAL, SANWOOD

Mask Bacterial Filtration Et Market Market Value Analysis

Between 2026 and 2030, the market continues its growth, expanding from USD 166.5 million to USD 195.5 million. The intermediate years see steady increases through USD 173.3 million, 180.4 million, 187.8 million, and 195.5 million, fueled by continued investments in healthcare infrastructure, improved standards for personal protective equipment (PPE), and expanding global regulations for mask efficiency testing. From 2031 to 2035, the market reaches USD 248.8 million, with incremental increases through USD 211.9 million, 220.6 million, 229.6 million, and 239.0 million. This final phase sees stable growth with a more predictable trajectory, despite occasional volatility due to shifts in global demand and regulatory standards.

Mask Bacterial Filtration Efficiency Tester Market Key Takeaways

Metric Value
Estimated Value in (2025E) USD 166.5 million
Forecast Value in (2035F) USD 248.8 million
Forecast CAGR (2025 to 2035) 4.1%

The healthcare and medical industry is the largest driver, contributing 45-50%, as BFE testers are essential for ensuring masks meet regulatory standards and provide adequate protection for healthcare workers and patients in hospitals and clinics. PPE manufacturers contribute 25-30%, as they rely on BFE testing to verify the protective efficiency of their products and ensure compliance with global safety standards. The research and development sector accounts for 10-12%, with academic and industrial research labs using BFE testers to develop innovative mask materials and improve filtration technologies. Regulatory bodies and testing laboratories add 8-10%, as they ensure that masks and PPE products meet international safety regulations through rigorous BFE testing. The consumer goods and retail segment, while smaller at 5-8%, also contributes, as retailers and online platforms selling PPE require BFE testing to guarantee the quality and safety of their products for consumers.

Why is the Mask Bacterial Filtration Efficiency Tester Market Growing?

Market expansion is being supported by the increasing global demand for high-quality protective equipment and the corresponding need for reliable testing solutions that can verify filtration performance, ensure product safety, and support regulatory compliance across various mask manufacturing and quality assurance applications. Modern manufacturers and quality control specialists are increasingly focused on implementing testing solutions that can validate product performance, minimize quality risks, and provide comprehensive verification data in protective equipment production processes. Mask bacterial filtration efficiency testers' proven ability to deliver accurate measurements, ensure regulatory compliance, and support quality assurance make them essential equipment for contemporary mask manufacturing and quality control operations.

The growing emphasis on product safety and regulatory compliance is driving demand for mask bacterial filtration efficiency testers that can support standardized testing protocols, ensure performance verification, and enable comprehensive quality documentation. Manufacturers' preference for testing equipment that combines accuracy with operational efficiency and regulatory compliance capabilities is creating opportunities for innovative testing system implementations. The rising influence of quality assurance standards and consumer safety requirements is also contributing to increased adoption of mask bacterial filtration efficiency testers that can provide reliable performance verification without compromising manufacturing efficiency or product quality.

Segmental Analysis

The market is segmented by filtration efficiency, application, and region. By filtration efficiency, the market is divided into filtration efficiency: BFE 80%~95%, filtration efficiency: BFE ≥95%, filtration efficiency: BFE ≥99%, and filtration efficiency: BFE ≥99.9%. Based on the application, the market is categorized into medical protection and civilian protection. Regionally, the market is divided into Asia Pacific, North America, Europe, Latin America, and the Middle East & Africa.

By Filtration Efficiency, the BFE 80%~95% Segment Leads the Market with 25% Share

The BFE 80%~95% segment is projected to maintain its leading position in the mask bacterial filtration efficiency tester market in 2025, with a 25% market share. Quality control specialists and manufacturers increasingly rely on BFE 80%~95% testing equipment for its ability to cover the standard mask requirements, established testing protocols, and versatile application across various mask types and manufacturing processes. This filtration efficiency range provides a proven methodology that aligns with regulatory standards, directly addressing the industry’s need for reliable performance verification and compliance testing. The segment forms the foundation of modern mask quality control, with strong demand across multiple mask categories. As manufacturers prioritize consistent performance verification and regulatory compliance, the BFE 80%~95% testing equipment remains central to comprehensive mask testing strategies.
  • Provides comprehensive coverage of standard mask requirements for bacterial filtration.
  • Aligns with regulatory standards, ensuring reliable performance verification.
  • Essential for consistent quality control in diverse mask manufacturing processes.

By Application, the Medical Protection Segment Dominates Market Demand with 60% Share

Mask Bacterial Filtration Et Market Analysis By Application

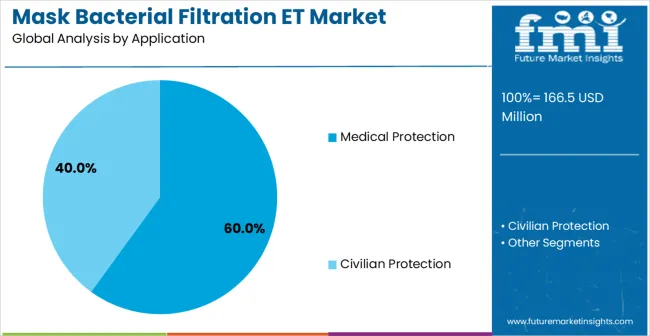
The medical protection application segment is projected to represent the largest share of mask bacterial filtration efficiency tester demand in 2025, with 60% of the market. Medical device manufacturers prefer bacterial filtration efficiency testing for medical masks due to stringent quality requirements, safety standards, and the need to ensure patient protection. The segment plays a critical role in supporting healthcare industry quality control and regulatory compliance, offering both safety and certification advantages. Continuous innovations in medical testing standards and specialized protocols enable precise performance verification, ensuring enhanced accuracy and alignment with regulatory guidelines. As the demand for high-quality medical protection products grows and safety standards become more stringent, the medical protection application will continue to dominate the market while driving advanced testing and quality assurance strategies.

  • Ensures compliance with stringent safety standards and regulatory certification.
  • Critical for medical device manufacturers to meet high-quality protection requirements.
  • Dominates the market by supporting medical protection standards and quality assurance.

What are the Drivers, Restraints, and Key Trends of the Mask Bacterial Filtration Efficiency Tester Market?

The mask bacterial filtration efficiency tester market is advancing steadily due to increasing demand for quality assurance in protective equipment manufacturing and growing adoption of standardized testing protocols that provide enhanced product safety and regulatory compliance across diverse mask manufacturing applications. The market faces challenges, including high equipment costs and maintenance requirements, technical complexity in testing procedures, and the need for specialized expertise in testing operations and data interpretation. Innovation in automated testing systems and digital integration continues to influence product development and market expansion patterns.

Expansion of Automated Testing Technologies

The growing adoption of automated testing systems and digital measurement technologies is enabling manufacturers to achieve superior testing efficiency, enhanced data accuracy, and comprehensive quality documentation capabilities for improved manufacturing processes. Automated testing systems provide improved operational efficiency while allowing more consistent testing protocols and reliable results across various mask types and testing requirements. Manufacturers are increasingly recognizing the competitive advantages of automated testing capabilities for quality differentiation and operational optimization.

Integration of Digital Data Management and Connectivity Systems

Modern mask bacterial filtration efficiency tester manufacturers are incorporating digital data management technologies and connectivity solutions to enhance testing documentation, enable real-time quality monitoring, and ensure comprehensive traceability for regulatory compliance and quality assurance. These technologies improve operational efficiency while enabling new applications, including remote monitoring and predictive maintenance capabilities. Advanced digital integration also allows manufacturers to support comprehensive quality management and testing optimization beyond traditional manual testing operations.
Analysis of the Mask Bacterial Filtration Efficiency Tester Market by Key Countries

Mask Bacterial Filtration Et Market Cagr Analysis By Country

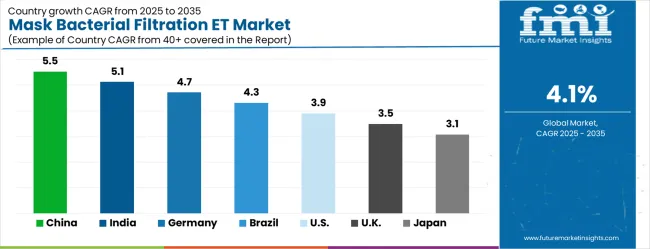
Country CAGR (2025-2035)
China 5.5%
India 5.1%
Germany 4.7%
Brazil 4.3%
USA 3.9%
UK 3.5%
Japan 3.1%

The mask bacterial filtration efficiency tester market is experiencing steady growth globally, with China leading at a 5.5% CAGR through 2035, driven by the expanding protective equipment manufacturing industry, growing quality control requirements, and significant investment in testing equipment and manufacturing quality assurance infrastructure. India follows at 5.1%, supported by rapid industrial development, increasing manufacturing capabilities, and growing adoption of quality testing equipment in protective equipment production. Germany shows growth at 4.7%, emphasizing precision engineering and advanced quality control technologies. Brazil records 4.3%, focusing on manufacturing infrastructure development and quality improvement initiatives. The USA demonstrates 3.9% growth, supported by established testing standards and emphasis on regulatory compliance. The UK exhibits 3.5% growth, emphasizing quality assurance and manufacturing excellence initiatives. Japan shows 3.1% growth, supported by precision manufacturing and advanced testing technologies.

The report covers an in-depth analysis of 40+ countries with top-performing countries highlighted below.

Sales Analysis in China

The mask bacterial filtration efficiency tester market in China is projected to grow at a CAGR of 5.5% from 2025 to 2035. As one of the largest manufacturers of masks and personal protective equipment (PPE), China has witnessed increasing demand for efficient testing equipment to ensure product quality. The growing awareness of air quality, pollution control, and the continuous impact of health crises have led to an increased focus on the performance of face masks. With a vast manufacturing sector, particularly in the medical and healthcare industries, there is a heightened need for testing systems to measure bacterial filtration efficiency (BFE). As China continues to strengthen its regulations regarding healthcare products and their safety standards, the demand for advanced testing equipment is set to rise. China’s rapid adoption of technological innovations will support the growth of the market, including the automation of the testing processes to enhance speed and accuracy.

  • Strong demand driven by China’s PPE manufacturing sector
  • Increased focus on health and safety regulations fueling demand
  • Technological advancements supporting more efficient and automated testing systems

How will the Market Perform in India?

The mask bacterial filtration efficiency tester market in India is expected to grow at a CAGR of 5.1% from 2025 to 2035. As the demand for face masks surged due to the COVID-19 pandemic, the need for testing equipment to assess their effectiveness also grew. India, with its large population and expanding healthcare sector, faces increasing pressure to meet international quality standards for medical products, including masks. The adoption of stringent regulatory frameworks will boost the demand for reliable BFE testing equipment. India’s growing focus on air quality and pollution control is propelling the demand for high-quality masks, which, in turn, drives the testing market. India’s expanding industrial capabilities, particularly in manufacturing and healthcare, will further create demand for advanced and cost-effective bacterial filtration testing solutions.

  • Growth in healthcare and manufacturing sectors pushing demand for testing solutions
  • Regulatory pressure to meet international mask standards increasing market need
  • Growing concerns about air quality fueling demand for efficient filtration testing

Opportunity Analysis in Germany

The mask bacterial filtration efficiency tester market in Germany is projected to grow at a CAGR of 4.7% from 2025 to 2035. Known for its strong medical device manufacturing industry, Germany has a highly regulated healthcare market that demands rigorous testing for PPE products, including face masks. As the country increasingly focuses on ensuring public health safety, the need for efficient BFE testing solutions is expected to rise. The expansion of Germany’s healthcare and industrial sectors, coupled with a shift toward more effective health solutions, will drive this growth. The rise of the medical tourism industry and Germany’s position as a medical hub in Europe will further support the demand for advanced filtration testing solutions. The continued adoption of smart technologies in manufacturing, along with automation in testing processes, will enhance the precision and efficiency of BFE testers, promoting their market growth.

  • Growing healthcare and medical device manufacturing sectors fueling market growth
  • Increased regulatory requirements boosting demand for accurate filtration testing
  • Adoption of smart and automated technologies improving testing efficiency

Mask Bacterial Filtration Efficiency Tester Market Expansion in Brazil

The mask bacterial filtration efficiency tester market in Brazil is expected to grow at a CAGR of 4.3% from 2025 to 2035. As Brazil’s healthcare infrastructure continues to improve and evolve, the demand for reliable testing equipment for PPE, including masks, is rising. Brazil’s large population and growing concerns about air quality and healthcare safety contribute to the market’s potential. The country’s expanding manufacturing capabilities and increased focus on medical and healthcare product quality will support the demand for accurate and efficient BFE testing systems. Brazil’s position as a leading healthcare market in Latin America means that it will continue to rely on advanced technologies to ensure mask performance and meet both local and international safety standards. As the country strengthens its healthcare regulations, the need for dependable testing systems will become more pronounced.

  • Expansion of Brazil’s healthcare infrastructure increasing demand for testing equipment
  • Growing concerns about air quality and healthcare safety fueling market demand
  • Increased focus on product quality in manufacturing driving BFE testing adoption

Mask Bacterial Filtration Efficiency Tester Market Adoption in the USA

The mask bacterial filtration efficiency tester market in the USA is expected to grow at a CAGR of 3.9% from 2025 to 2035. As one of the world’s largest markets for medical equipment, the USA has seen an increased focus on personal protective equipment, particularly after the pandemic. The need for BFE testing has escalated with a growing demand for high-quality masks that offer protection against airborne bacteria and viruses. Stringent FDA regulations and guidelines in the USA, along with a growing emphasis on public health safety, continue to drive the demand for BFE testing equipment. The increasing adoption of advanced technologies, including automation and smart systems in testing, is also expected to improve the accuracy and efficiency of the testing process. With the USA’s strong healthcare sector and robust manufacturing infrastructure, the demand for these testing solutions will likely continue to rise.

  • Stringent regulatory environment driving need for testing solutions
  • Focus on high-quality masks for public health safety boosting market demand
  • Adoption of advanced technologies improving testing speed and accuracy

Mask Bacterial Filtration Efficiency Tester Market Trends in the UK

The mask bacterial filtration efficiency tester market in the UK is expected to grow at a CAGR of 3.5% from 2025 to 2035. As the UK continues to focus on strengthening its healthcare infrastructure, there is an increasing need for accurate testing equipment for PPE products like masks. The government’s emphasis on ensuring high safety standards for healthcare products contributes to the rising demand for BFE testing solutions. With the growing adoption of advanced manufacturing technologies, including automation in testing processes, the market for BFE testers in the UK is expected to experience steady growth. The UK’s position as a hub for medical research and healthcare innovations further supports the demand for cutting-edge testing systems. The need for high-quality masks, particularly in healthcare and industrial settings, will also drive the demand for efficient BFE testing equipment.

  • Increased healthcare regulations promoting demand for reliable testing solutions
  • Growth in manufacturing and automation supporting testing equipment market
  • Emphasis on high-quality PPE products boosting demand for filtration testing

Mask Bacterial Filtration Efficiency Tester Market Outlook in Japan

Mask bacterial filtration efficiency tester market in Japan is expected to grow at a CAGR of 3.1% from 2025 to 2035. As Japan continues to prioritize health and safety, particularly in healthcare settings, the demand for advanced filtration testing equipment will rise. Japan’s high standards in product quality and safety will drive the need for reliable and accurate BFE testing systems. With a strong medical and manufacturing industry, Japan’s focus on enhancing the quality and performance of PPE products like masks is expected to contribute to steady market growth. The increasing adoption of smart technologies in manufacturing, combined with Japan’s emphasis on precision and innovation, will ensure the continued demand for advanced testing equipment in the country’s healthcare and industrial sectors.
  • High product quality standards driving demand for reliable testing systems
  • Focus on health and safety in Japan fueling market growth
  • Adoption of smart technologies and innovation supporting BFE testing solutions

Europe Market Split by Countries

Mask Bacterial Filtration Et Market Europe Country Market Share Analysis, 2025 & 2035

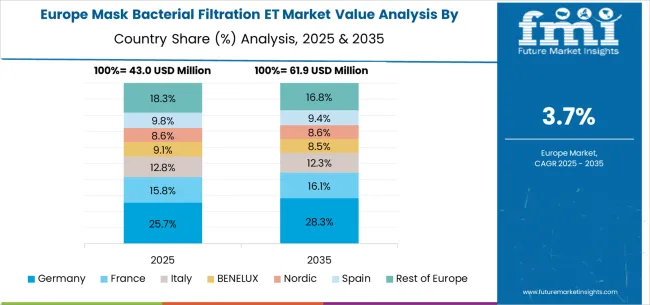
The mask bacterial filtration efficiency tester market in Europe is projected to grow from USD 61.3 million in 2025 to USD 89.2 million by 2035, registering a CAGR of 3.8% over the forecast period. Germany is expected to maintain its leadership position with a 26.0% market share in 2025, moderating slightly to 25.8% by 2035, supported by its strong manufacturing sector, advanced testing equipment industry, and comprehensive quality assurance infrastructure serving major European markets.

The United Kingdom follows with 20.0% in 2025, projected to reach 19.8% by 2035, driven by established quality assurance standards, a comprehensive regulatory framework, and advanced manufacturing excellence programs. France holds 18.5% in 2025, rising to 18.7% by 2035, supported by manufacturing infrastructure development and growing adoption of quality testing technologies. Italy commands 14.0% in 2025, projected to reach 14.1% by 2035, while Spain accounts for 9.5% in 2025, expected to reach 9.6% by 2035. The Netherlands maintains a 4.5% share in 2025, growing to 4.6% by 2035. The Rest of Europe region, including Nordic countries, Eastern Europe, and other markets, is anticipated to maintain its position, holding its collective share at 7.5% by 2035, attributed to increasing manufacturing modernization and growing quality testing adoption across emerging industrial markets implementing advanced testing standards.

Competitive Landscape of the Mask Bacterial Filtration Efficiency Tester Market

The mask bacterial filtration efficiency tester market is characterized by competition among established testing equipment manufacturers, specialized measurement system providers, and integrated quality assurance solution suppliers. Companies are investing in advanced testing technology research, automation development, precision engineering, and comprehensive product portfolios to deliver accurate, reliable, and efficient mask bacterial filtration efficiency testing solutions. Innovation in automated testing systems, digital integration, and precision measurement technologies is central to strengthening market position and competitive advantage.

GESTER INTERNATIONAL CO., LTD. Leads the market with comprehensive testing equipment solutions, offering advanced bacterial filtration efficiency testers with a focus on accuracy and reliability in diverse testing applications. Junray provides specialized testing equipment with an emphasis on precision measurement and quality assurance capabilities. TESTEX delivers innovative testing solutions with a focus on textile and protective equipment testing applications. Guangzhou Biaoji Packaging Equipment Co., Ltd. specializes in packaging and testing equipment with emphasis on manufacturing quality control. HAIDA INTERNATIONAL focuses on material testing equipment and quality assurance solutions. SANWOOD offers comprehensive testing equipment with a focus on precision measurement and industrial applications.

Mask Bacterial Filtration Efficiency Tester Market - Stakeholder Contribution Framework

Mask bacterial filtration efficiency testers represent a specialized quality control segment within protective equipment manufacturing, projected to grow from USD 166.5 million in 2025 to USD 248.8 million by 2035 at a 4.1% CAGR. These precision testing instruments measure BFE performance across filtration ranges from 80-95% to ≥99.9%, ensuring medical and civilian protection masks meet safety standards and regulatory requirements. Market expansion is driven by increased quality assurance demands in mask manufacturing, adoption of automated testing protocols, stringent regulatory compliance requirements, and growing emphasis on product safety verification across healthcare and industrial protection applications.

How Regulatory Authorities Could Strengthen Quality Standards and Compliance?

  • Harmonized Testing Standards: Develop unified international standards for mask bacterial filtration efficiency testing protocols, measurement procedures, and acceptance criteria that enable consistent quality verification across different manufacturing regions and regulatory jurisdictions.
  • Mandatory Testing Requirements: Establish comprehensive regulations requiring BFE testing for all mask categories, including specific testing frequencies, documentation requirements, and third-party certification protocols to ensure consistent product safety and performance verification.
  • Laboratory Accreditation Programs: Create certification systems for testing laboratories conducting mask BFE assessments, including equipment calibration requirements, technician training standards, and quality management protocols that ensure reliable and reproducible testing results.
  • Market Surveillance Systems: Implement systematic post-market monitoring programs using standardized BFE testing protocols to verify ongoing product compliance, identify quality issues, and take corrective actions when masks fail to meet established performance standards.
  • Digital Compliance Platforms: Develop electronic systems for test data submission, compliance tracking, and regulatory reporting that streamline the certification process while maintaining rigorous quality control and traceability requirements.

How Industry Standards Organizations Could Advance Testing Methodologies?

  • Technical Testing Protocols: Establish comprehensive guidelines for BFE testing procedures, including equipment specifications, calibration requirements, environmental conditions, and statistical analysis methods that ensure accurate and reproducible test results across different laboratories.
  • Equipment Certification Standards: Develop qualification criteria for BFE testing equipment, including accuracy specifications, measurement range requirements, and performance verification protocols that ensure testing instruments meet industry quality standards.
  • Interlaboratory Testing Programs: Coordinate proficiency testing initiatives across testing laboratories to validate measurement consistency, identify procedural variations, and establish best practices for BFE testing operations and data interpretation.
  • Training and Competency Standards: Create certification programs for testing technicians covering equipment operation, measurement procedures, data analysis, and quality control protocols specific to mask bacterial filtration efficiency testing.
  • Emerging Technology Integration: Guide development of advanced testing methodologies, including automated systems, digital data capture, and real-time monitoring technologies that improve testing efficiency while maintaining accuracy and reliability.

How Testing Equipment Manufacturers Could Drive Innovation and Accessibility?

  • Advanced Automation Technologies: Develop fully automated BFE testing systems with integrated sample handling, measurement protocols, and data analysis capabilities that reduce human error, improve throughput, and ensure consistent testing procedures.
  • Multi-Range Testing Capabilities: Create versatile testing platforms capable of measuring across all BFE ranges (80-95%, ≥95%, ≥99%, ≥99.9%) with high accuracy and precision, enabling laboratories to serve diverse mask manufacturing requirements with a single equipment investment.
  • Digital Integration Systems: Implement IoT connectivity, cloud-based data management, and real-time monitoring capabilities that enable remote equipment oversight, predictive maintenance, and seamless integration with quality management systems.
  • Cost-Effective Solutions: Design modular, scalable testing systems that make BFE testing accessible to smaller manufacturers and testing laboratories while maintaining measurement accuracy and regulatory compliance capabilities.
  • User-Friendly Interfaces: Develop intuitive operating systems, automated calibration procedures, and comprehensive training programs that reduce technical complexity and enable efficient operation by technicians with varying experience levels.

How Mask Manufacturers Could Optimize Quality Control and Compliance?

  • Integrated Quality Systems: Implement comprehensive quality management programs incorporating BFE testing at multiple production stages, including raw material verification, in-process monitoring, and final product validation to ensure consistent performance.
  • Statistical Process Control: Adopt data-driven quality control methodologies using BFE test results to monitor production consistency, identify process variations, and implement corrective actions that maintain product quality and regulatory compliance.
  • Supplier Quality Management: Establish BFE testing requirements for raw material suppliers, including filter media certification, batch testing protocols, and performance specifications that ensure incoming materials meet quality standards.
  • Continuous Improvement Programs: Use BFE testing data to identify optimization opportunities in manufacturing processes, material selection, and product design that enhance filtration performance while maintaining cost-effectiveness.
  • Regulatory Compliance Management: Develop comprehensive documentation systems linking BFE test results to batch records, regulatory submissions, and quality certifications that ensure traceability and support regulatory inspections.

How Healthcare Systems and Procurement Organizations Could Ensure Product Quality?

  • Evidence-Based Procurement: Establish procurement criteria requiring verified BFE testing results, third-party certifications, and ongoing quality monitoring for all mask purchases to ensure healthcare worker and patient safety.
  • Supplier Audit Programs: Implement comprehensive quality audits of mask suppliers, including review of BFE testing procedures, quality systems, and manufacturing capabilities, to validate product quality and supply chain reliability.
  • Post-Market Surveillance: Develop systematic programs for testing procured masks using independent BFE testing to verify ongoing quality, identify performance issues, and maintain supplier accountability.
  • Quality Database Systems: Create centralized databases tracking BFE testing results, supplier performance, and product quality trends that inform procurement decisions and support continuous quality improvement.
  • Emergency Preparedness: Maintain strategic reserves of certified BFE testing equipment and qualified testing capabilities to ensure rapid quality verification during health emergencies or supply chain disruptions.

How Investors and Financial Enablers Could Support Market Development?

  • Testing Infrastructure Investment: Finance establishment of accredited testing laboratories, equipment procurement, and facility development that expand global BFE testing capacity and improve access to quality verification services.
  • Technology Innovation Funding: Support development of next-generation BFE testing technologies, including automated systems, artificial intelligence integration, and advanced measurement techniques that improve testing efficiency and accuracy.
  • Market Access Financing: Provide capital for testing equipment manufacturers to expand into emerging markets, establish local service networks, and develop cost-effective solutions that improve global access to quality testing capabilities.
  • Quality Assurance Platform Development: Finance digital platforms that integrate BFE testing data, regulatory compliance tracking, and supply chain quality management to create comprehensive quality assurance ecosystems.
  • Research and Development Support: Fund collaborative research initiatives focused on improving testing methodologies, developing new measurement techniques, and advancing understanding of filtration performance relationships that drive industry innovation.

Key Players in the Mask Bacterial Filtration Efficiency Tester Market

  • GESTER INTERNATIONAL CO., LTD.
  • Junray
  • TESTEX
  • Guangzhou Biaoji Packaging Equipment Co., Ltd.
  • HAIDA INTERNATIONAL
  • SANWOOD
  • UTSTESTER
  • LISUN GROUP
  • Sataton
  • Great Win Testing Machine CO. Ltd.
  • Labtech

Scope of the Report

Items Values
Quantitative Units (2025) USD 166.5 Million
Filtration efficiency Filtration Efficiency: BFE 80%~95%, Filtration Efficiency: BFE ≥95%, Filtration Efficiency: BFE ≥99%, Filtration Efficiency: BFE ≥99.9%
Application Medical Protection, Civilian Protection
Regions Covered Asia Pacific, North America, Europe, Latin America, Middle East & Africa
Countries Covered China, India, Germany, Brazil, the United States, the United Kingdom, Japan, and 40+ countries
Key Companies Profiled GESTER INTERNATIONAL CO., LTD., Junray, TESTEX, Guangzhou Biaoji Packaging Equipment Co., Ltd, HAIDA INTERNATIONAL, and SANWOOD
Additional Attributes Dollar sales by filtration efficiency and application category, regional demand trends, competitive landscape, technological advancements in testing systems, automation development, precision measurement innovation, and quality assurance optimization

Mask Bacterial Filtration Efficiency Tester Market by Segments

Filtration Efficiency:

  • Filtration Efficiency: BFE 80%~95%
  • Filtration Efficiency: BFE ≥95%
  • Filtration Efficiency: BFE ≥99%
  • Filtration Efficiency: BFE ≥99.9%

Application:

  • Medical Protection
  • Civilian Protection

Region:

Asia Pacific

  • China
  • India
  • Japan
  • South Korea
  • ASEAN
  • Australia & New Zealand
  • Rest of Asia Pacific

North America

  • United States
  • Canada
  • Mexico

Europe

  • Germany
  • United Kingdom
  • France
  • Italy
  • Spain
  • Nordic
  • BENELUX
  • Rest of Europe

Latin America

  • Brazil
  • Chile
  • Argentina
  • Rest of Latin America

Middle East & Africa

  • Kingdom of Saudi Arabia
  • Other GCC Countries
  • Turkey
  • South Africa
  • Other African Union
  • Rest of Middle East & Africa

Table of Content

  1. Executive Summary
    • Global Market Outlook
    • Demand to side Trends
    • Supply to side Trends
    • Technology Roadmap Analysis
    • Analysis and Recommendations
  2. Market Overview
    • Market Coverage / Taxonomy
    • Market Definition / Scope / Limitations
  3. Market Background
    • Market Dynamics
      • Drivers
      • Restraints
      • Opportunity
      • Trends
    • Scenario Forecast
      • Demand in Optimistic Scenario
      • Demand in Likely Scenario
      • Demand in Conservative Scenario
    • Opportunity Map Analysis
    • Product Life Cycle Analysis
    • Supply Chain Analysis
    • Investment Feasibility Matrix
    • Value Chain Analysis
    • PESTLE and Porter’s Analysis
    • Regulatory Landscape
    • Regional Parent Market Outlook
    • Production and Consumption Statistics
    • Import and Export Statistics
  4. Global Market Analysis 2020 to 2024 and Forecast, 2025 to 2035
    • Historical Market Size Value (USD Million) Analysis, 2020 to 2024
    • Current and Future Market Size Value (USD Million) Projections, 2025 to 2035
      • Y to o to Y Growth Trend Analysis
      • Absolute $ Opportunity Analysis
  5. Global Market Pricing Analysis 2020 to 2024 and Forecast 2025 to 2035
  6. Global Market Analysis 2020 to 2024 and Forecast 2025 to 2035, By Classification
    • Introduction / Key Findings
    • Historical Market Size Value (USD Million) Analysis By Classification , 2020 to 2024
    • Current and Future Market Size Value (USD Million) Analysis and Forecast By Classification , 2025 to 2035
      • Filtration Efficiency: BFE 80%~95%
      • Filtration Efficiency: BFE ≥95%
      • Filtration Efficiency: BFE ≥99%
      • Filtration Efficiency: BFE ≥99.9%
    • Y to o to Y Growth Trend Analysis By Classification , 2020 to 2024
    • Absolute $ Opportunity Analysis By Classification , 2025 to 2035
  7. Global Market Analysis 2020 to 2024 and Forecast 2025 to 2035, By Application
    • Introduction / Key Findings
    • Historical Market Size Value (USD Million) Analysis By Application, 2020 to 2024
    • Current and Future Market Size Value (USD Million) Analysis and Forecast By Application, 2025 to 2035
      • Medical Protection
      • Civilian Protection
    • Y to o to Y Growth Trend Analysis By Application, 2020 to 2024
    • Absolute $ Opportunity Analysis By Application, 2025 to 2035
  8. Global Market Analysis 2020 to 2024 and Forecast 2025 to 2035, By Region
    • Introduction
    • Historical Market Size Value (USD Million) Analysis By Region, 2020 to 2024
    • Current Market Size Value (USD Million) Analysis and Forecast By Region, 2025 to 2035
      • North America
      • Latin America
      • Western Europe
      • Eastern Europe
      • East Asia
      • South Asia and Pacific
      • Middle East & Africa
    • Market Attractiveness Analysis By Region
  9. North America Market Analysis 2020 to 2024 and Forecast 2025 to 2035, By Country
    • Historical Market Size Value (USD Million) Trend Analysis By Market Taxonomy, 2020 to 2024
    • Market Size Value (USD Million) Forecast By Market Taxonomy, 2025 to 2035
      • By Country
        • USA
        • Canada
        • Mexico
      • By Classification
      • By Application
    • Market Attractiveness Analysis
      • By Country
      • By Classification
      • By Application
    • Key Takeaways
  10. Latin America Market Analysis 2020 to 2024 and Forecast 2025 to 2035, By Country
    • Historical Market Size Value (USD Million) Trend Analysis By Market Taxonomy, 2020 to 2024
    • Market Size Value (USD Million) Forecast By Market Taxonomy, 2025 to 2035
      • By Country
        • Brazil
        • Chile
        • Rest of Latin America
      • By Classification
      • By Application
    • Market Attractiveness Analysis
      • By Country
      • By Classification
      • By Application
    • Key Takeaways
  11. Western Europe Market Analysis 2020 to 2024 and Forecast 2025 to 2035, By Country
    • Historical Market Size Value (USD Million) Trend Analysis By Market Taxonomy, 2020 to 2024
    • Market Size Value (USD Million) Forecast By Market Taxonomy, 2025 to 2035
      • By Country
        • Germany
        • UK
        • Italy
        • Spain
        • France
        • Nordic
        • BENELUX
        • Rest of Western Europe
      • By Classification
      • By Application
    • Market Attractiveness Analysis
      • By Country
      • By Classification
      • By Application
    • Key Takeaways
  12. Eastern Europe Market Analysis 2020 to 2024 and Forecast 2025 to 2035, By Country
    • Historical Market Size Value (USD Million) Trend Analysis By Market Taxonomy, 2020 to 2024
    • Market Size Value (USD Million) Forecast By Market Taxonomy, 2025 to 2035
      • By Country
        • Russia
        • Poland
        • Hungary
        • Balkan & Baltic
        • Rest of Eastern Europe
      • By Classification
      • By Application
    • Market Attractiveness Analysis
      • By Country
      • By Classification
      • By Application
    • Key Takeaways
  13. East Asia Market Analysis 2020 to 2024 and Forecast 2025 to 2035, By Country
    • Historical Market Size Value (USD Million) Trend Analysis By Market Taxonomy, 2020 to 2024
    • Market Size Value (USD Million) Forecast By Market Taxonomy, 2025 to 2035
      • By Country
        • China
        • Japan
        • South Korea
      • By Classification
      • By Application
    • Market Attractiveness Analysis
      • By Country
      • By Classification
      • By Application
    • Key Takeaways
  14. South Asia and Pacific Market Analysis 2020 to 2024 and Forecast 2025 to 2035, By Country
    • Historical Market Size Value (USD Million) Trend Analysis By Market Taxonomy, 2020 to 2024
    • Market Size Value (USD Million) Forecast By Market Taxonomy, 2025 to 2035
      • By Country
        • India
        • ASEAN
        • Australia & New Zealand
        • Rest of South Asia and Pacific
      • By Classification
      • By Application
    • Market Attractiveness Analysis
      • By Country
      • By Classification
      • By Application
    • Key Takeaways
  15. Middle East & Africa Market Analysis 2020 to 2024 and Forecast 2025 to 2035, By Country
    • Historical Market Size Value (USD Million) Trend Analysis By Market Taxonomy, 2020 to 2024
    • Market Size Value (USD Million) Forecast By Market Taxonomy, 2025 to 2035
      • By Country
        • Kingdom of Saudi Arabia
        • Other GCC Countries
        • Turkiye
        • South Africa
        • Other African Union
        • Rest of Middle East & Africa
      • By Classification
      • By Application
    • Market Attractiveness Analysis
      • By Country
      • By Classification
      • By Application
    • Key Takeaways
  16. Key Countries Market Analysis
    • USA
      • Pricing Analysis
      • Market Share Analysis, 2024
        • By Classification
        • By Application
    • Canada
      • Pricing Analysis
      • Market Share Analysis, 2024
        • By Classification
        • By Application
    • Mexico
      • Pricing Analysis
      • Market Share Analysis, 2024
        • By Classification
        • By Application
    • Brazil
      • Pricing Analysis
      • Market Share Analysis, 2024
        • By Classification
        • By Application
    • Chile
      • Pricing Analysis
      • Market Share Analysis, 2024
        • By Classification
        • By Application
    • Germany
      • Pricing Analysis
      • Market Share Analysis, 2024
        • By Classification
        • By Application
    • UK
      • Pricing Analysis
      • Market Share Analysis, 2024
        • By Classification
        • By Application
    • Italy
      • Pricing Analysis
      • Market Share Analysis, 2024
        • By Classification
        • By Application
    • Spain
      • Pricing Analysis
      • Market Share Analysis, 2024
        • By Classification
        • By Application
    • France
      • Pricing Analysis
      • Market Share Analysis, 2024
        • By Classification
        • By Application
    • India
      • Pricing Analysis
      • Market Share Analysis, 2024
        • By Classification
        • By Application
    • ASEAN
      • Pricing Analysis
      • Market Share Analysis, 2024
        • By Classification
        • By Application
    • Australia & New Zealand
      • Pricing Analysis
      • Market Share Analysis, 2024
        • By Classification
        • By Application
    • China
      • Pricing Analysis
      • Market Share Analysis, 2024
        • By Classification
        • By Application
    • Japan
      • Pricing Analysis
      • Market Share Analysis, 2024
        • By Classification
        • By Application
    • South Korea
      • Pricing Analysis
      • Market Share Analysis, 2024
        • By Classification
        • By Application
    • Russia
      • Pricing Analysis
      • Market Share Analysis, 2024
        • By Classification
        • By Application
    • Poland
      • Pricing Analysis
      • Market Share Analysis, 2024
        • By Classification
        • By Application
    • Hungary
      • Pricing Analysis
      • Market Share Analysis, 2024
        • By Classification
        • By Application
    • Kingdom of Saudi Arabia
      • Pricing Analysis
      • Market Share Analysis, 2024
        • By Classification
        • By Application
    • Turkiye
      • Pricing Analysis
      • Market Share Analysis, 2024
        • By Classification
        • By Application
    • South Africa
      • Pricing Analysis
      • Market Share Analysis, 2024
        • By Classification
        • By Application
  17. Market Structure Analysis
    • Competition Dashboard
    • Competition Benchmarking
    • Market Share Analysis of Top Players
      • By Regional
      • By Classification
      • By Application
  18. Competition Analysis
    • Competition Deep Dive
      • GESTER INTERNATIONAL CO.,LTD.
        • Overview
        • Product Portfolio
        • Profitability by Market Segments (Product/Age /Sales Channel/Region)
        • Sales Footprint
        • Strategy Overview
          • Marketing Strategy
          • Product Strategy
          • Channel Strategy
      • Junray
      • TESTEX
      • Guangzhou Biaoji Packaging Equipment Co.,Ltd.
      • HAIDA INTERNATIONAL
      • SANWOOD
      • UTSTESTER
      • LISUN GROUP
      • Sataton
      • Great Win Testing Machine CO. Ltd.
      • Labtech
  19. Assumptions & Acronyms Used
  20. Research Methodology

List of Tables

  • Table 1: Global Market Value (USD Million) Forecast by Region, 2020 to 2035
  • Table 2: Global Market Value (USD Million) Forecast by Classification , 2020 to 2035
  • Table 3: Global Market Value (USD Million) Forecast by Application, 2020 to 2035
  • Table 4: North America Market Value (USD Million) Forecast by Country, 2020 to 2035
  • Table 5: North America Market Value (USD Million) Forecast by Classification , 2020 to 2035
  • Table 6: North America Market Value (USD Million) Forecast by Application, 2020 to 2035
  • Table 7: Latin America Market Value (USD Million) Forecast by Country, 2020 to 2035
  • Table 8: Latin America Market Value (USD Million) Forecast by Classification , 2020 to 2035
  • Table 9: Latin America Market Value (USD Million) Forecast by Application, 2020 to 2035
  • Table 10: Western Europe Market Value (USD Million) Forecast by Country, 2020 to 2035
  • Table 11: Western Europe Market Value (USD Million) Forecast by Classification , 2020 to 2035
  • Table 12: Western Europe Market Value (USD Million) Forecast by Application, 2020 to 2035
  • Table 13: Eastern Europe Market Value (USD Million) Forecast by Country, 2020 to 2035
  • Table 14: Eastern Europe Market Value (USD Million) Forecast by Classification , 2020 to 2035
  • Table 15: Eastern Europe Market Value (USD Million) Forecast by Application, 2020 to 2035
  • Table 16: East Asia Market Value (USD Million) Forecast by Country, 2020 to 2035
  • Table 17: East Asia Market Value (USD Million) Forecast by Classification , 2020 to 2035
  • Table 18: East Asia Market Value (USD Million) Forecast by Application, 2020 to 2035
  • Table 19: South Asia and Pacific Market Value (USD Million) Forecast by Country, 2020 to 2035
  • Table 20: South Asia and Pacific Market Value (USD Million) Forecast by Classification , 2020 to 2035
  • Table 21: South Asia and Pacific Market Value (USD Million) Forecast by Application, 2020 to 2035
  • Table 22: Middle East & Africa Market Value (USD Million) Forecast by Country, 2020 to 2035
  • Table 23: Middle East & Africa Market Value (USD Million) Forecast by Classification , 2020 to 2035
  • Table 24: Middle East & Africa Market Value (USD Million) Forecast by Application, 2020 to 2035

List of Figures

  • Figure 1: Global Market Pricing Analysis
  • Figure 2: Global Market Value (USD Million) Forecast 2020-2035
  • Figure 3: Global Market Value Share and BPS Analysis by Classification , 2025 and 2035
  • Figure 4: Global Market Y to o to Y Growth Comparison by Classification , 2025-2035
  • Figure 5: Global Market Attractiveness Analysis by Classification
  • Figure 6: Global Market Value Share and BPS Analysis by Application, 2025 and 2035
  • Figure 7: Global Market Y to o to Y Growth Comparison by Application, 2025-2035
  • Figure 8: Global Market Attractiveness Analysis by Application
  • Figure 9: Global Market Value (USD Million) Share and BPS Analysis by Region, 2025 and 2035
  • Figure 10: Global Market Y to o to Y Growth Comparison by Region, 2025-2035
  • Figure 11: Global Market Attractiveness Analysis by Region
  • Figure 12: North America Market Incremental Dollar Opportunity, 2025-2035
  • Figure 13: Latin America Market Incremental Dollar Opportunity, 2025-2035
  • Figure 14: Western Europe Market Incremental Dollar Opportunity, 2025-2035
  • Figure 15: Eastern Europe Market Incremental Dollar Opportunity, 2025-2035
  • Figure 16: East Asia Market Incremental Dollar Opportunity, 2025-2035
  • Figure 17: South Asia and Pacific Market Incremental Dollar Opportunity, 2025-2035
  • Figure 18: Middle East & Africa Market Incremental Dollar Opportunity, 2025-2035
  • Figure 19: North America Market Value Share and BPS Analysis by Country, 2025 and 2035
  • Figure 20: North America Market Value Share and BPS Analysis by Classification , 2025 and 2035
  • Figure 21: North America Market Y to o to Y Growth Comparison by Classification , 2025-2035
  • Figure 22: North America Market Attractiveness Analysis by Classification
  • Figure 23: North America Market Value Share and BPS Analysis by Application, 2025 and 2035
  • Figure 24: North America Market Y to o to Y Growth Comparison by Application, 2025-2035
  • Figure 25: North America Market Attractiveness Analysis by Application
  • Figure 26: Latin America Market Value Share and BPS Analysis by Country, 2025 and 2035
  • Figure 27: Latin America Market Value Share and BPS Analysis by Classification , 2025 and 2035
  • Figure 28: Latin America Market Y to o to Y Growth Comparison by Classification , 2025-2035
  • Figure 29: Latin America Market Attractiveness Analysis by Classification
  • Figure 30: Latin America Market Value Share and BPS Analysis by Application, 2025 and 2035
  • Figure 31: Latin America Market Y to o to Y Growth Comparison by Application, 2025-2035
  • Figure 32: Latin America Market Attractiveness Analysis by Application
  • Figure 33: Western Europe Market Value Share and BPS Analysis by Country, 2025 and 2035
  • Figure 34: Western Europe Market Value Share and BPS Analysis by Classification , 2025 and 2035
  • Figure 35: Western Europe Market Y to o to Y Growth Comparison by Classification , 2025-2035
  • Figure 36: Western Europe Market Attractiveness Analysis by Classification
  • Figure 37: Western Europe Market Value Share and BPS Analysis by Application, 2025 and 2035
  • Figure 38: Western Europe Market Y to o to Y Growth Comparison by Application, 2025-2035
  • Figure 39: Western Europe Market Attractiveness Analysis by Application
  • Figure 40: Eastern Europe Market Value Share and BPS Analysis by Country, 2025 and 2035
  • Figure 41: Eastern Europe Market Value Share and BPS Analysis by Classification , 2025 and 2035
  • Figure 42: Eastern Europe Market Y to o to Y Growth Comparison by Classification , 2025-2035
  • Figure 43: Eastern Europe Market Attractiveness Analysis by Classification
  • Figure 44: Eastern Europe Market Value Share and BPS Analysis by Application, 2025 and 2035
  • Figure 45: Eastern Europe Market Y to o to Y Growth Comparison by Application, 2025-2035
  • Figure 46: Eastern Europe Market Attractiveness Analysis by Application
  • Figure 47: East Asia Market Value Share and BPS Analysis by Country, 2025 and 2035
  • Figure 48: East Asia Market Value Share and BPS Analysis by Classification , 2025 and 2035
  • Figure 49: East Asia Market Y to o to Y Growth Comparison by Classification , 2025-2035
  • Figure 50: East Asia Market Attractiveness Analysis by Classification
  • Figure 51: East Asia Market Value Share and BPS Analysis by Application, 2025 and 2035
  • Figure 52: East Asia Market Y to o to Y Growth Comparison by Application, 2025-2035
  • Figure 53: East Asia Market Attractiveness Analysis by Application
  • Figure 54: South Asia and Pacific Market Value Share and BPS Analysis by Country, 2025 and 2035
  • Figure 55: South Asia and Pacific Market Value Share and BPS Analysis by Classification , 2025 and 2035
  • Figure 56: South Asia and Pacific Market Y to o to Y Growth Comparison by Classification , 2025-2035
  • Figure 57: South Asia and Pacific Market Attractiveness Analysis by Classification
  • Figure 58: South Asia and Pacific Market Value Share and BPS Analysis by Application, 2025 and 2035
  • Figure 59: South Asia and Pacific Market Y to o to Y Growth Comparison by Application, 2025-2035
  • Figure 60: South Asia and Pacific Market Attractiveness Analysis by Application
  • Figure 61: Middle East & Africa Market Value Share and BPS Analysis by Country, 2025 and 2035
  • Figure 62: Middle East & Africa Market Value Share and BPS Analysis by Classification , 2025 and 2035
  • Figure 63: Middle East & Africa Market Y to o to Y Growth Comparison by Classification , 2025-2035
  • Figure 64: Middle East & Africa Market Attractiveness Analysis by Classification
  • Figure 65: Middle East & Africa Market Value Share and BPS Analysis by Application, 2025 and 2035
  • Figure 66: Middle East & Africa Market Y to o to Y Growth Comparison by Application, 2025-2035
  • Figure 67: Middle East & Africa Market Attractiveness Analysis by Application
  • Figure 68: Global Market - Tier Structure Analysis
  • Figure 69: Global Market - Company Share Analysis

Frequently Asked Questions

How big is the mask bacterial filtration efficiency tester market in 2025?

The global mask bacterial filtration efficiency tester market is estimated to be valued at USD 166.5 million in 2025.

What will be the size of mask bacterial filtration efficiency tester market in 2035?

The market size for the mask bacterial filtration efficiency tester market is projected to reach USD 248.8 million by 2035.

How much will be the mask bacterial filtration efficiency tester market growth between 2025 and 2035?

The mask bacterial filtration efficiency tester market is expected to grow at a 4.1% CAGR between 2025 and 2035.

What are the key product types in the mask bacterial filtration efficiency tester market?

The key product types in mask bacterial filtration efficiency tester market are filtration efficiency: bfe 80%~95%, filtration efficiency: bfe ≥95%, filtration efficiency: bfe ≥99% and filtration efficiency: bfe ≥99.9%.

Which application segment to contribute significant share in the mask bacterial filtration efficiency tester market in 2025?

In terms of application, medical protection segment to command 60.0% share in the mask bacterial filtration efficiency tester market in 2025.

Explore Similar Insights

Future Market Insights

Mask Bacterial Filtration Efficiency Tester Market

Chat With

MaRIA

Hi There, I am MaRIA, Your Market Research Intelligence Assistant. How may I help you?