Microsphere Encapsulation Cosmetics Market Size and Share Forecast Outlook 2025 to 2035

The Microsphere Encapsulation Cosmetics Market is expected to record a valuation of USD 1,752.3 million in 2025 and USD 4,324.0 million in 2035, with an increase of USD 2,571.7 million, which equals a growth of 147% over the decade. The overall expansion represents a CAGR of 9.5% and a 2.5X increase in market size.
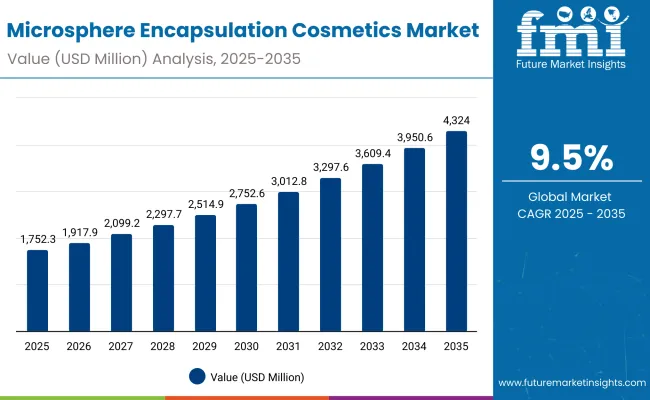
Quick Stats for Microsphere Encapsulation Cosmetics Market

  • Microsphere Encapsulation Cosmetics Market Value (2025): USD 1,752.3 million
  • Microsphere Encapsulation Cosmetics Market Forecast Value (2035): USD 4,324.0 million
  • Microsphere Encapsulation Cosmetics Market Forecast CAGR: 9.5%
  • Leading Segment in Microsphere Encapsulation Cosmetics Market in 2025: Retinol (27.4%)
  • Key Growth Regions in the Microsphere Encapsulation Cosmetics Market: East Asia, South Asia & Pacific, North America
  • Top Key Players in Microsphere Encapsulation Cosmetics Market: Evonik, BASF, Croda, Ashland, Lubrizol, Seppic, Gattefossé, Kobo Products, INOLEX, Sensient Cosmetic Technologies

Microsphere Encapsulation Cosmetics Market

Microsphere Encapsulation Cosmetics Market Key Takeaways

Metric Value
Market Estimated Value in (2025E) USD 1,752.3 million
Market Forecast Value in (2035F) USD 4,324.0 million
Forecast CAGR (2025 to 2035) 9.5%

During the first five-year period from 2025 to 2030, the market increases from USD 1,752.3 million to USD 2,752.6 million, adding USD 1,000.3 million, which accounts for 39% of the total decade growth. This phase records steady adoption in skincare, color cosmetics, and suncare, driven by the need for ingredient stability and controlled release. Retinol dominates this period as it caters to over 57% of ingredient encapsulation value in key regions such as the USA

The second half from 2030 to 2035 contributes USD 1,571.4 million, equal to 61% of total growth, as the market jumps from USD 2,752.6 million to USD 4,324.0 million. This acceleration is powered by widespread deployment of encapsulated vitamin C, peptides, and UV filters in masstige and premium skincare. Silica and lipid-based microspheres together capture a larger share above 49% by the end of the decade. Skincare remains the backbone application, accounting for over 55% of total value in 2025 and maintaining its lead through 2035.

From 2020 to 2024, the Microsphere Encapsulation Cosmetics Market grew steadily, driven by skincare-centric adoption. During this period, the competitive landscape was dominated by multinational ingredient suppliers controlling nearly 70% of revenue, with leaders such as Evonik, BASF, and Croda focusing on encapsulation technologies for active ingredients like retinol and vitamin C. Competitive differentiation relied on stability, delivery efficiency, and premium positioning, while fragrance encapsulation remained an auxiliary offering rather than a primary revenue stream. Service-based models had minimal traction, contributing less than 10% of the total market value.

Demand for microsphere encapsulation in cosmetics will expand to USD 1,752.3 million in 2025, and the revenue mix will shift as peptides, vitamin C, and UV filters grow to over 40% share. Traditional ingredient leaders face rising competition from niche players specializing in natural lipid-based carriers and color cosmetic encapsulation. Major suppliers are pivoting to hybrid models, integrating biotechnology and clean formulation technologies to retain relevance. Emerging entrants specializing in regional supply partnerships, K-beauty collaborations, and sustainable shell materials are gaining share. The competitive advantage is moving away from ingredient supply alone to ecosystem strength, brand partnerships, and multi-segment applications.

Why the Microsphere Encapsulation Cosmetics Market is growing?

Advances in encapsulation technologies have improved ingredient stability, bioavailability, and controlled release, allowing for more efficient delivery across diverse cosmetic applications. Retinol encapsulation has gained popularity due to its ability to reduce irritation and preserve potency. The rise of vitamin C encapsulation has contributed to enhanced skin-brightening claims, while peptides and UV filters are increasingly integrated into multifunctional products. Skincare remains the leading driver, supported by demand for anti-aging, sun protection, and dermocosmetic formulations.

Expansion of encapsulation into color cosmetics, fragrance, and hybrid beauty has fueled market growth. Innovations in lipid-based and silica microspheres, combined with polymer advancements, are expected to open new application areas. Segment growth is expected to be led by retinol encapsulation, polymer microspheres, and skincare products due to their adaptability and consumer demand.

Segmental Analysis

The market is segmented by ingredient encapsulated, shell material, application, product format, end consumer tier, and geography. Ingredients include retinol, vitamin C, UV filters, fragrances, and peptides, highlighting the active components driving adoption. Shell materials include polymer microspheres, silica microspheres, and lipid-based carriers to cater to different formulation requirements. Based on application, segmentation includes skincare, color cosmetics, suncare, and haircare. In terms of product format, categories encompass serums & creams, foundations & primers, and powders. End consumer tiers include mass, masstige, and premium. Regionally, the scope spans North America, Latin America, Europe, East Asia, South Asia & Pacific, and the Middle East & Africa.
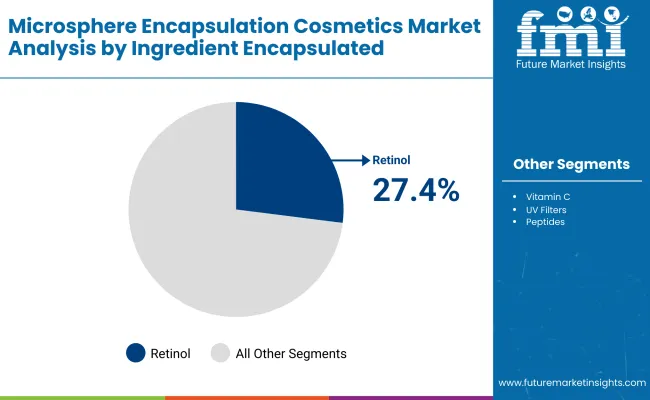
Insights into the Ingredient Segment with Retinol Leading in Market Share

Microsphere Encapsulation Cosmetics Market By Ingrediant

Ingredient Segment Market Value Share, 2025
Retinol 27.4%
Others 72.6%

The retinol segment is projected to contribute 27.4% of the Microsphere Encapsulation Cosmetics Market revenue in 2025, maintaining its lead as the dominant ingredient category. Encapsulation addresses the instability of retinol, which normally degrades quickly when exposed to light or oxygen. By using polymer and lipid microspheres, cosmetic brands can extend shelf life, improve skin tolerance, and ensure controlled release, making retinol more effective in anti-aging and dermocosmetic applications. While retinol remains the anchor, other ingredients such as vitamin C and peptides are experiencing rapid momentum, supported by consumer preference for brightening, collagen-boosting, and firming claims in skincare routines.
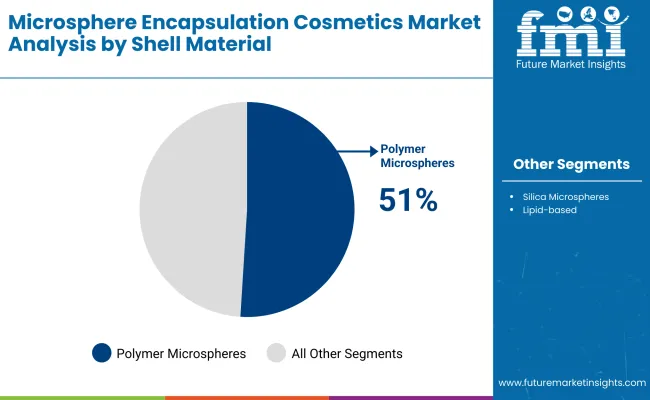
Insights into the Shell Material Segment with Polymer Microspheres Dominating the Demand

Microsphere Encapsulation Cosmetics Market By Shell

Shell Material Segment Market Value Share, 2025
Polymer microspheres 51.0%
Others 49.0%

The polymer microspheres segment is forecasted to hold 51.0% of the market share in 2025, reflecting its adaptability across skincare, color cosmetics, and suncare. Polymers allow for precise control of release mechanisms, enabling gradual diffusion of actives such as retinol and vitamin C over several hours. This technology aligns well with the performance and efficacy expectations of both mass-market and premium consumers. However, silica microspheres are becoming increasingly popular in powder-based products due to their oil-absorbing and texture-enhancing properties, while lipid-based microspheres are aligning with clean beauty trends and natural-origin claims. Together, they represent a diversifying market where innovation in carrier materials will become a differentiating factor for brands.
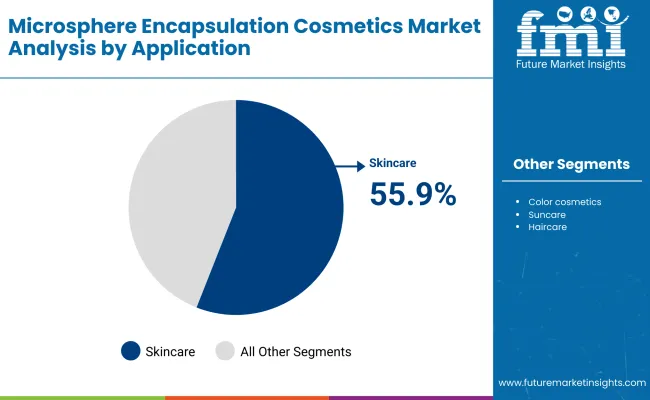
Insights into the Application Segment with Skincare Leading in Market Share

Microsphere Encapsulation Cosmetics Market By Application

Application Segment Market Value Share, 2025
Skincare 55.9%
Others 44.1%

The skincare segment is projected to account for 55.9% of the Microsphere Encapsulation Cosmetics Market revenue in 2025, establishing it as the dominant application. The dominance of skincare is fueled by the strong global consumer focus on anti-aging, hydration, brightening, and sun protection solutions. Encapsulation enhances both perceived and actual efficacy of skincare products by ensuring actives penetrate deeper layers of the skin without irritation.

The rise of hybrid products, such as tinted moisturizers with encapsulated UV filters or serums with encapsulated peptides, is also blurring boundaries between skincare and makeup. Meanwhile, color cosmetics are increasingly adopting encapsulation to improve long-wear properties, while suncare and haircare are emerging categories leveraging the technology to create multifunctional and more stable formulations.

What are the Drivers, Restraints, and Key Trends of the Microsphere Encapsulation Cosmetics Market?

Drivers

Rising Demand for Stable and Effective Active Ingredients

One of the strongest drivers for the Microsphere Encapsulation Cosmetics Market is the consumer shift toward high-performance skincare and cosmetics featuring actives such as retinol, vitamin C, and peptides. These ingredients are notoriously unstable when exposed to air, light, or moisture, often losing potency before reaching the skin. Encapsulation technology solves this issue by stabilizing sensitive actives, allowing controlled release, enhanced penetration, and reduced irritation. This not only boosts consumer confidence in product efficacy but also enables brands to market premium, science-backed solutions across both skincare and color cosmetics.

Growth of Premium and Masstige Beauty Segments

Encapsulation aligns perfectly with the rising demand for masstige and premium beauty products, where consumers are willing to pay more for innovation, proven benefits, and sustainability. Encapsulated actives are increasingly used in luxury anti-aging creams, serums, and multifunctional products like hybrid foundations with skincare benefits. As East Asia and South Asia & Pacific expand rapidly in these tiers, global suppliers and brands are scaling encapsulated solutions to cater to consumers who associate encapsulation with advanced, dermatologically tested, and superior-quality formulations.

Restraints

High Cost of Encapsulation Technology

Encapsulation adds complexity and cost to cosmetic product development, from R&D investment to specialized production equipment and carrier materials. For brands targeting mass-market consumers, higher formulation costs can limit adoption or lead to premium pricing that may alienate cost-sensitive buyers. This challenge is particularly evident in price-sensitive regions such as Latin America and parts of Asia, where consumers are still highly value-driven.

Regulatory and Labeling Challenges

Cosmetic regulations in markets such as the EU, USA, and China impose strict requirements on ingredient safety, claims, and labeling. Encapsulated actives often need additional testing to validate safety, release profiles, and long-term stability, which can delay time-to-market. Furthermore, “encapsulation” is not always well understood by consumers, requiring brands to balance regulatory compliance with clear communication of benefits without making exaggerated medical-like claims.

Key Trends

Expansion of Hybrid Beauty Products

Hybrid products combining skincare benefits with makeup functions are a major trend shaping the market. Examples include foundations infused with encapsulated peptides, sunscreens containing encapsulated vitamin C, and powders with encapsulated fragrances. Consumers increasingly seek multifunctional products that provide both cosmetic coverage and long-term skincare benefits, and encapsulation is central to this positioning.

Shift Toward Natural and Clean Encapsulation Carriers

While polymer microspheres currently dominate, there is a strong trend toward lipid-based and silica microspheres, as clean beauty and natural-origin claims grow in importance. Lipid carriers resonate with sustainability-conscious consumers, while silica microspheres are increasingly used in powders and oil-control products. This trend reflects how encapsulation is not only a performance tool but also an enabler of clean label and eco-friendly positioning.

Markets such as China and India are growing at 17.1% and 19.2% CAGR, respectively, outpacing global averages. Rising middle-class income, rapid masstige/premium adoption, and the popularity of K-beauty and J-beauty formulations are fueling encapsulation adoption. Local brands are also partnering with global ingredient suppliers to differentiate products with encapsulated actives, accelerating regional penetration.
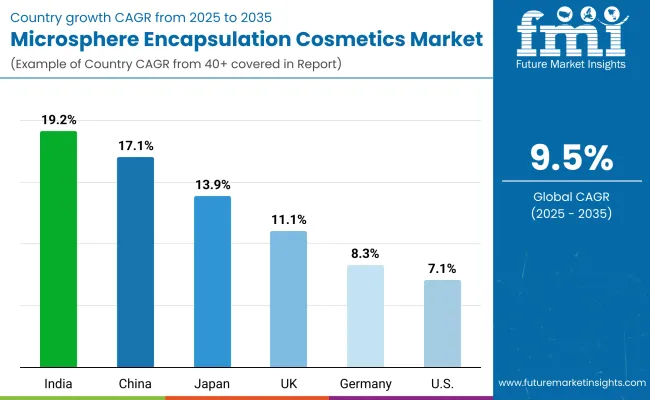
Analysis of Microsphere Encapsulation Cosmetics Market By Key Countries

Microsphere Encapsulation Cosmetics Market By Country

Countries Estimated CAGR (2025 to 2035)
China 17.1%
USA 7.1%
India 19.2%
UK 11.1%
Germany 8.3%
Japan 13.9%

The Microsphere Encapsulation Cosmetics Market shows strong geographical contrasts in growth rates between 2025 and 2035. India (19.2% CAGR) and China (17.1% CAGR) are the fastest-expanding markets, reflecting their rapidly growing middle-class consumer base, rising disposable incomes, and the increasing popularity of masstige and premium beauty products. Demand in these regions is driven by skincare awareness, the influence of K-beauty and J-beauty trends, and the appeal of multifunctional cosmetics with encapsulated actives such as retinol, vitamin C, and peptides. Japan also stands out with a double-digit CAGR of 13.9%, as its mature market continues to innovate through technology-led formulations, particularly in anti-aging and hybrid cosmetic solutions.

In contrast, developed Western markets such as the USA (7.1% CAGR), Germany (8.3% CAGR), and the UK (11.1% CAGR) are expected to grow at steadier rates. These markets are highly saturated, but innovation in premium skincare and clean beauty encapsulation formats will sustain demand. The USA continues to be a hub for retinol encapsulation, while European consumers are showing stronger adoption of silica and lipid-based carriers aligned with natural and sustainable beauty preferences. Overall, while growth in Western regions will be incremental, the rapid acceleration in Asia will be the primary driver behind the global market’s near 2.5X expansion over the forecast period.
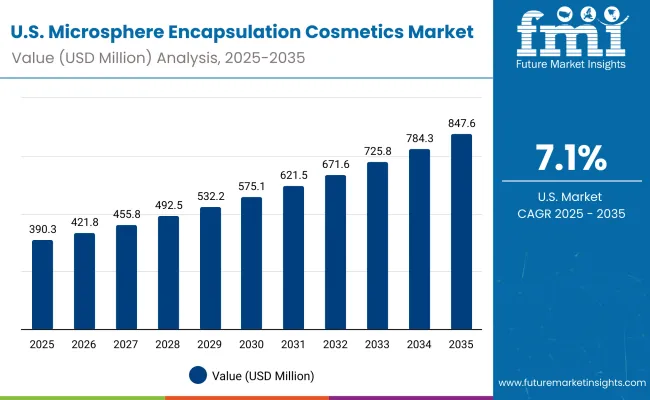
Sales Outlook for Microsphere Encapsulation Cosmetics in the United States

Microsphere Encapsulation Cosmetics Market Usa

Year USA Microsphere Encapsulation Cosmetics Market (USD Million)
2025 390.3
2026 421.8
2027 455.8
2028 492.6
2029 532.3
2030 575.2
2031 621.6
2032 671.7
2033 725.8
2034 784.4
2035 847.6

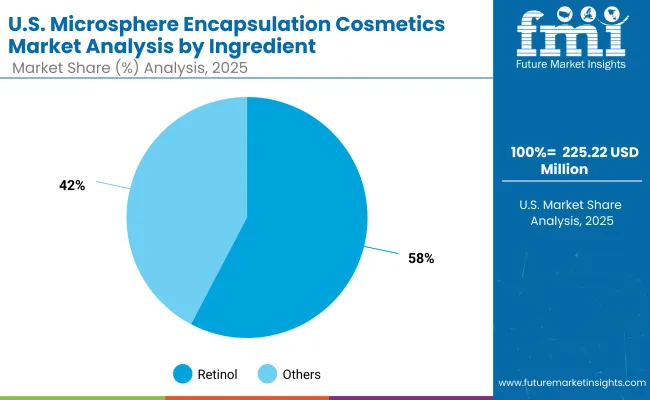
The Microsphere Encapsulation Cosmetics Market in the United States is projected to grow at a CAGR of 7.1%, led by sustained consumer demand for anti-aging and dermatology-inspired skincare. Encapsulated retinol remains the most dominant ingredient, accounting for nearly 58% of the USA market in 2025, reflecting its critical role in serums, night creams, and dermocosmetic solutions. Growth is also supported by the premiumization of masstige brands and strong positioning of encapsulated vitamin C in brightening formulations. Innovation is accelerating through partnerships between ingredient suppliers and clinical skincare brands, with an emphasis on efficacy validation and consumer trust.

  • Retinol encapsulation is the backbone of USA growth in premium skincare.
  • Clinical skincare and dermocosmetic brands are leading adoption of encapsulated actives.
  • Premium and masstige tiers are expanding faster than mass-market products.

Growth and Expansion Outlook for Microsphere Encapsulation Cosmetics in the United Kingdom

The Microsphere Encapsulation Cosmetics Market in the United Kingdom is expected to grow at a CAGR of 11.1%, supported by consumer demand for hybrid formulations and advanced skincare. UK brands are rapidly incorporating encapsulated vitamin C, peptides, and UV filters into multifunctional products such as brightening serums and tinted moisturizers. Retailers and indie beauty labels are increasingly marketing encapsulation as a differentiator, highlighting stability, clean beauty alignment, and long-lasting efficacy. Regulatory compliance with EU and UK cosmetic safety laws continues to be a cornerstone, pushing suppliers to invest in testing and transparent labeling.

  • Encapsulated vitamin C and peptides are gaining traction in multifunctional formulations.
  • Hybrid beauty (skincare + makeup) products are driving consumer adoption.
  • Indie brands and retailers are using encapsulation as a key marketing differentiator.

Growth and Expansion Outlook for Microsphere Encapsulation Cosmetics in India

India is witnessing rapid growth in the Microsphere Encapsulation Cosmetics Market, which is forecast to expand at a CAGR of 19.2% through 2035, the fastest among all leading countries. Rising incomes, urbanization, and the spread of beauty consumption into tier-2 and tier-3 cities are fueling demand. Consumers are highly receptive to masstige and premium skincare products that promise visible benefits, such as anti-aging, brightening, and sun protection. Encapsulation is gaining visibility in dermatologist-recommended formulations, while domestic and international brands are localizing encapsulated actives into price-sensitive SKUs to capture mass appeal.
  • Masstige and premium beauty segments are driving adoption in urban and semi-urban markets.
  • Dermatologist-endorsed skincare with encapsulated actives is building trust among consumers.
  • Domestic players are localizing encapsulated formulations into affordable SKUs.

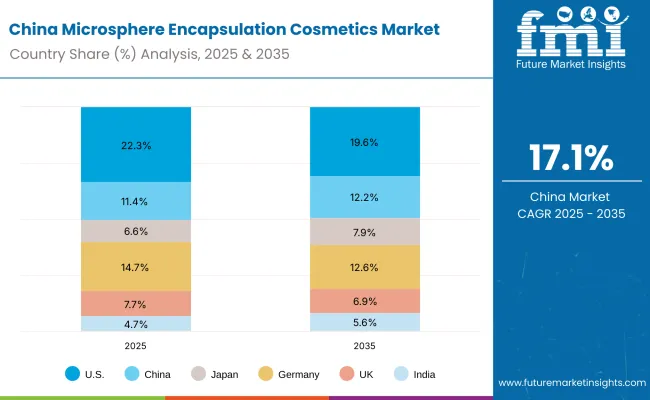
Sales Outlook for Microsphere Encapsulation Cosmetics in China

Microsphere Encapsulation Cosmetics Market China

Countries 2025 Share (%)
USA 22.3%
China 11.4%
Japan 6.6%
Germany 14.7%
UK 7.7%
India 4.7%
Countries 2035 Share (%)
USA 19.6%
China 12.2%
Japan 7.9%
Germany 12.6%
UK 6.9%
India 5.6%

The Microsphere Encapsulation Cosmetics Market in China is expected to grow at a CAGR of 17.1%, making it one of the fastest-growing markets globally. Growth is propelled by strong consumer preference for brightening, whitening, and UV protection products, with encapsulated vitamin C and UV filters seeing sharp adoption. While polymer microspheres account for 43.5% of the Chinese market in 2025, silica and lipid-based microspheres are expanding rapidly, reflecting the clean beauty trend and demand for natural-origin carriers. Domestic brands are partnering with international ingredient suppliers to accelerate product differentiation, while affordable premium offerings are gaining traction across e-commerce platforms.
  • Encapsulated vitamin C and UV filters dominate growth in brightening and suncare.
  • Clean beauty trends are fueling silica and lipid-based microsphere adoption.
  • Domestic brands leverage encapsulation to compete with global players via e-commerce.

Opportunity Analysis of United States - Microsphere Encapsulation Cosmetics Market

Microsphere Encapsulation Cosmetics Market Usa 2

Ingredient Segment Market Value Share, 2025
Retinol 57.7%
Others 42.3%

The Microsphere Encapsulation Cosmetics Market in the United States is valued at USD 304.02 million in 2025, with retinol leading at 57.7% of ingredient-encapsulated value. Dominance of retinol reflects the USA market’s emphasis on clinical, anti-aging efficacy where encapsulation improves stability, reduces irritation, and enables sustained release in serums and night creams. Premium and masstige brands are amplifying encapsulated vitamin C and peptides in brightening and firming routines, while dermatologist-endorsed labels and specialty retailers push science-backed claims. Polymer microspheres remain the default carrier for broad compatibility, and brands are pairing encapsulation with consumer-perceivable benefits (longer wear, reduced sensitivity, improved potency) to justify price ladders.

This positioning makes encapsulated actives a core lever for premiumization and routine “upgrade” behavior, with strong upsell in serums & creams and growing use in hybrid color products (foundations/primers with skincare claims). Regulatory rigor and claim-substantiation norms steer investment into testing and data, reinforcing barriers to entry. As retail shifts toward education-led selling and DTC clinics, suppliers that bundle technical support + ready-to-formulate microcaps win faster adoption cycles.
  • Market size for the United States in 2025 is USD 304.02 million
  • Global market share is approximately 22.3%
  • Retinol leads at 57.7% due to anti-aging and dermocosmetic demand

Opportunity Analysis of China - Microsphere Encapsulation Cosmetics Market

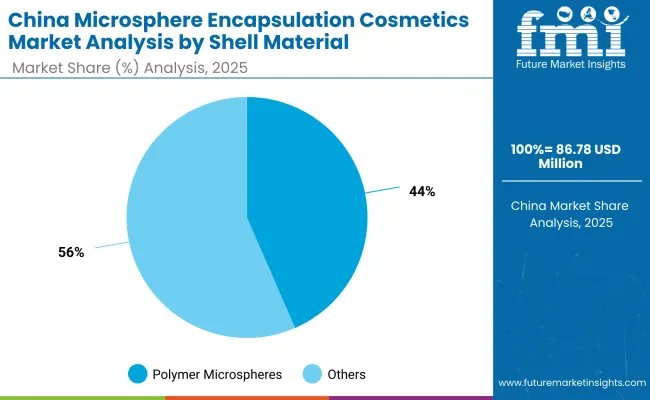
Microsphere Encapsulation Cosmetics Market China 2

Shell Material Segment Market Value Share, 2025
Polymer microspheres 43.5%
Others 56.5%

The Microsphere Encapsulation Cosmetics Market in China is valued at USD 199.96 million in 2025, with silica & lipid-based carriers collectively leading at 56.5%. This split mirrors China’s clean-beauty tilt and preference for brightening and UV-defense routines, where encapsulated vitamin C and UV filters are center stage. Silica microspheres add oil-control and texture refinement in powders and hybrid color formats, while lipid carriers bolster natural-origin narratives and skin-affinity claims. Domestic brands leverage rapid product cycles and e-commerce storytelling to mainstream encapsulation, often co-developing with global suppliers to secure differentiating claims and stability profiles.

As cross-border trends (K-beauty/J-beauty) shape aesthetics, encapsulation becomes a platform for multi-benefit launches: long-wear complexion products with skincare payoff, sunscreens with reduced irritation, and peptide-infused brightening serums. Expect faster adoption of masstige SKUs with premium cues, supported by livestream retail and ingredient-education content that clearly explains the “why” behind encapsulation.
  • Market size for China in 2025 is USD 199.96 million
  • Global market share is approximately 11.4%
  • Silica & lipid-based carriers lead at 56.5% on clean-beauty and brightening/suncare focus

Competitive Landscape of Microsphere Encapsulation Cosmetics Market

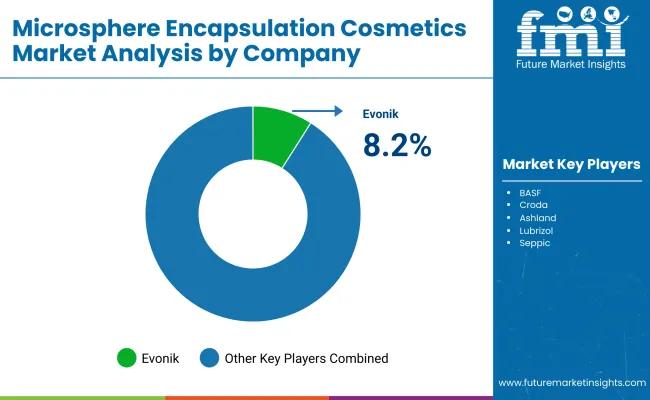
Microsphere Encapsulation Cosmetics Market By Company

The market is moderately fragmented, with multinational ingredient leaders, agile mid-sized innovators, and niche specialists competing across skincare, color cosmetics, suncare, and haircare. Evonik leads globally on encapsulation platforms and delivery systems, while BASF, Croda, Ashland, Lubrizol, Seppic, Gattefossé, Kobo Products, INOLEX, and Sensient Cosmetic Technologies scale portfolios spanning polymer, silica, and lipid microcarriers. Differentiation has shifted from “capsule available” to end-to-end enablement: stability data, in-use performance, sensorial tuning, claim language support, and regional compliance toolkits.

Mid-sized and specialty players win with ready-to-formulate concentrates, tailored particle sizes, and hybrid carriers optimized for specific actives (retinol, vitamin C, peptides). Color-cosmetic specialists push silica-rich textures for blurring/soft-focus effects; skincare-first suppliers advance low-irritation retinol and photostable UV systems. Across the board, competitive strategies emphasize:

  • Carrier innovation (biobased lipids, biodegradable polymers) aligned with clean-beauty claims
  • Formulation services + claim substantiation (in-vitro release, in-vivo efficacy, irritation reduction)
  • Speed to market via modular microcaps plus plug-and-play bases for serums, creams, and hybrid makeup
  • Regional partnerships (e.g., USA clinical brands; China/K-beauty co-creation) to localize textures, compliance, and storytelling

Key Developments in Microsphere Encapsulation Cosmetics Market

  • On January 23, 2025, BASF’s Personal Care division launched VitaGuard® A, an innovative retinol encapsulation technology using solid lipid particles. This method significantly enhances retinol’s stability, mitigates irritation, and improves skin bioavailability.
  • On April 8-10, 2025, at in-cosmetics Global in Amsterdam, Evonik unveiled a suite of sustainable, high-performance biosolutions tailored to emerging beauty demands. Highlighted launches included TEGOSOFT® BC MB, a vegan, enzymatically produced natural emollient; RHEANCE® D50, a biosurfactant for certified natural cosmetics; Vecollage® Fortify GP, a dual-mode vegan collagen polypeptide; and dermosoft® GPT MB, a microbiome-respectful antimicrobial wetting agentall demonstrating Evonik’s strategic shift toward eco-efficient, claim-backed encapsulation technologies

Scope of the Report

Item Value
Quantitative Units USD 1,752.3 million
Ingredient Encapsulated Retinol, Vitamin C, UV Filters, Fragrances, Peptides
Shell Material Polymer microspheres, Silica microspheres, Lipid-based
Application Skincare, Color cosmetics, Suncare, Haircare
Product Format Serums & creams, Foundations & primers, Powders
Regions Covered North America, Europe, Asia-Pacific, Latin America, Middle East & Africa
Country Covered United States, Canada, Germany, France, United Kingdom, China, Japan, India, Brazil, South Africa
Key Companies Profiled Evonik, BASF, Croda, Ashland, Lubrizol, Seppic, Gattefossé, Kobo Products, INOLEX, Sensient Cosmetic Technologies
Additional Attributes Dollar sales by ingredient and application, adoption trends in skincare and hybrid beauty, rising demand for encapsulated retinol and vitamin C, sector-specific growth in premium and masstige skincare, emerging role of lipid-based and silica carriers, software-supported formulation data and claim substantiation, regional trends influenced by clean beauty and sustainability, and innovations in polymer microspheres, peptide delivery, and photostable UV filter encapsulation.

Key Segments

By Ingredient Encapsulated:

  • Retinol
  • Vitamin C
  • UV filters
  • Fragrances
  • Peptides

By Shell Material:

  • Polymer microspheres
  • Silica microspheres
  • Lipid-based

By Application:

  • Skincare
  • Color cosmetics
  • Haircare
  • Suncare

By Product Format:

  • Serums & creams
  • Foundations & primers
  • Powders

By End Consumer Tier:

  • Mass
  • Masstige
  • Premium

By Region:

  • North America
  • Latin America
  • Europe
  • East Asia
  • South Asia & Pacific
  • Middle East and Africa

Table of Content

  1. Executive Summary
    • Global Market Outlook
    • Demand-side Trends
    • Supply-side Trends
    • Technology Roadmap Analysis
    • Analysis and Recommendations
  2. Market Overview
    • Market Coverage / Taxonomy
    • Market Definition / Scope / Limitations
  3. Market Background
    • Market Dynamics
      • Drivers
      • Restraints
      • Opportunity
      • Trends
    • Scenario Forecast
      • Demand in Optimistic Scenario
      • Demand in Likely Scenario
      • Demand in Conservative Scenario
    • Opportunity Map Analysis
    • Product Life Cycle Analysis
    • Supply Chain Analysis
      • Supply Side Participants and their Roles
        • Producers
        • Mid-Level Participants (Traders/ Agents/ Brokers)
        • Wholesalers and Distributors
      • Value Added and Value Created at Node in the Supply Chain
      • List of Raw Material Suppliers
      • List of Existing and Potential Buyer’s
    • Investment Feasibility Matrix
    • Value Chain Analysis
      • Profit Margin Analysis
      • Wholesalers and Distributors
      • Retailers
    • PESTLE and Porter’s Analysis
    • Regulatory Landscape
      • By Key Regions
      • By Key Countries
    • Regional Parent Market Outlook
    • Production and Consumption Statistics
    • Import and Export Statistics
  4. Global Market Analysis 2020 to 2024 and Forecast, 2025 to 2035
    • Historical Market Size Value (USD Million) & Volume (Units) Analysis, 2020 to 2024
    • Current and Future Market Size Value (USD Million) & Volume (Units) Projections, 2025 to 2035
      • Y-o-Y Growth Trend Analysis
      • Absolute $ Opportunity Analysis
  5. Global Market Analysis 2020 to 2024 and Forecast 2025 to 2035, By Ingredient Encapsulated
    • Introduction / Key Findings
    • Historical Market Size Value (USD Million) & Volume (Units) Analysis By Ingredient Encapsulated, 2020 to 2024
    • Current and Future Market Size Value (USD Million) & Volume (Units) Analysis and Forecast By Ingredient Encapsulated, 2025 to 2035
      • Retinol
      • Vitamin C
      • UV filters
      • Fragrances
      • Peptides
    • Y-o-Y Growth Trend Analysis By Ingredient Encapsulated, 2020 to 2024
    • Absolute $ Opportunity Analysis By Ingredient Encapsulated, 2025 to 2035
  6. Global Market Analysis 2020 to 2024 and Forecast 2025 to 2035, By Shell Material
    • Introduction / Key Findings
    • Historical Market Size Value (USD Million) & Volume (Units) Analysis By Shell Material, 2020 to 2024
    • Current and Future Market Size Value (USD Million) & Volume (Units) Analysis and Forecast By Shell Material, 2025 to 2035
      • Polymer microspheres
      • Silica microspheres
      • Lipid-based
    • Y-o-Y Growth Trend Analysis By Shell Material, 2020 to 2024
    • Absolute $ Opportunity Analysis By Shell Material, 2025 to 2035
  7. Global Market Analysis 2020 to 2024 and Forecast 2025 to 2035, By Application
    • Introduction / Key Findings
    • Historical Market Size Value (USD Million) & Volume (Units) Analysis By Application, 2020 to 2024
    • Current and Future Market Size Value (USD Million) & Volume (Units) Analysis and Forecast By Application, 2025 to 2035
      • Skincare
      • Color cosmetics
      • Haircare
      • Suncare
    • Y-o-Y Growth Trend Analysis By Application, 2020 to 2024
    • Absolute $ Opportunity Analysis By Application, 2025 to 2035
  8. Global Market Analysis 2020 to 2024 and Forecast 2025 to 2035, By Product Format
    • Introduction / Key Findings
    • Historical Market Size Value (USD Million) & Volume (Units) Analysis By Product Format, 2020 to 2024
    • Current and Future Market Size Value (USD Million) & Volume (Units) Analysis and Forecast By Product Format, 2025 to 2035
      • Serums & creams
      • Foundations & primers
      • Powders
    • Y-o-Y Growth Trend Analysis By Product Format, 2020 to 2024
    • Absolute $ Opportunity Analysis By Product Format, 2025 to 2035
  9. Global Market Analysis 2020 to 2024 and Forecast 2025 to 2035, By End Consumer Tier
    • Introduction / Key Findings
    • Historical Market Size Value (USD Million) & Volume (Units) Analysis By End Consumer Tier, 2020 to 2024
    • Current and Future Market Size Value (USD Million) & Volume (Units) Analysis and Forecast By End Consumer Tier, 2025 to 2035
      • Mass
      • Masstige
      • Premium
    • Y-o-Y Growth Trend Analysis By End Consumer Tier, 2020 to 2024
    • Absolute $ Opportunity Analysis By End Consumer Tier, 2025 to 2035
  10. Global Market Analysis 2020 to 2024 and Forecast 2025 to 2035, By Region
    • Introduction
    • Historical Market Size Value (USD Million) & Volume (Units) Analysis By Region, 2020 to 2024
    • Current Market Size Value (USD Million) & Volume (Units) Analysis and Forecast By Region, 2025 to 2035
      • North America
      • Latin America
      • Europe
      • East Asia
      • South Asia & Pacific
      • Middle East and Africa
    • Market Attractiveness Analysis By Region
  11. North America Market Analysis 2020 to 2024 and Forecast 2025 to 2035, By Country
    • Historical Market Size Value (USD Million) & Volume (Units) Trend Analysis By Market Taxonomy, 2020 to 2024
    • Market Size Value (USD Million) & Volume (Units) Forecast By Market Taxonomy, 2025 to 2035
      • By Country
        • USA
        • Canada
      • By Ingredient Encapsulated
      • By Shell Material
      • By Application
      • By Product Format
      • By End Consumer Tier
    • Market Attractiveness Analysis
      • By Country
      • By Ingredient Encapsulated
      • By Shell Material
      • By Application
      • By Product Format
      • By End Consumer Tier
    • Key Takeaways
  12. Latin America Market Analysis 2020 to 2024 and Forecast 2025 to 2035, By Country
    • Historical Market Size Value (USD Million) & Volume (Units) Trend Analysis By Market Taxonomy, 2020 to 2024
    • Market Size Value (USD Million) & Volume (Units) Forecast By Market Taxonomy, 2025 to 2035
      • By Country
        • Brazil
        • Mexico
        • Colombia
        • Rest of Latin America
      • By Ingredient Encapsulated
      • By Shell Material
      • By Application
      • By Product Format
      • By End Consumer Tier
    • Market Attractiveness Analysis
      • By Country
      • By Ingredient Encapsulated
      • By Shell Material
      • By Application
      • By Product Format
      • By End Consumer Tier
    • Key Takeaways
  13. Europe Market Analysis 2020 to 2024 and Forecast 2025 to 2035, By Country
    • Historical Market Size Value (USD Million) & Volume (Units) Trend Analysis By Market Taxonomy, 2020 to 2024
    • Market Size Value (USD Million) & Volume (Units) Forecast By Market Taxonomy, 2025 to 2035
      • By Country
        • Germany
        • UK
        • France
        • Italy
        • Spain
        • Belgium
        • Netherlands
        • Nordic
        • Switzerland
        • Russia
        • Poland
        • Rest of Europe
      • By Ingredient Encapsulated
      • By Shell Material
      • By Application
      • By Product Format
      • By End Consumer Tier
    • Market Attractiveness Analysis
      • By Country
      • By Ingredient Encapsulated
      • By Shell Material
      • By Application
      • By Product Format
      • By End Consumer Tier
    • Key Takeaways
  14. East Asia Market Analysis 2020 to 2024 and Forecast 2025 to 2035, By Country
    • Historical Market Size Value (USD Million) & Volume (Units) Trend Analysis By Market Taxonomy, 2020 to 2024
    • Market Size Value (USD Million) & Volume (Units) Forecast By Market Taxonomy, 2025 to 2035
      • By Country
        • China
        • Japan
        • South Korea
      • By Ingredient Encapsulated
      • By Shell Material
      • By Application
      • By Product Format
      • By End Consumer Tier
    • Market Attractiveness Analysis
      • By Country
      • By Ingredient Encapsulated
      • By Shell Material
      • By Application
      • By Product Format
      • By End Consumer Tier
    • Key Takeaways
  15. South Asia & Pacific Market Analysis 2020 to 2024 and Forecast 2025 to 2035, By Country
    • Historical Market Size Value (USD Million) & Volume (Units) Trend Analysis By Market Taxonomy, 2020 to 2024
    • Market Size Value (USD Million) & Volume (Units) Forecast By Market Taxonomy, 2025 to 2035
      • By Country
        • India
        • Thailand
        • Malaysia
        • Indonesia
        • Singapore
        • Vietnam
        • Australia
        • New Zealand
        • Rest of South Asia
      • By Ingredient Encapsulated
      • By Shell Material
      • By Application
      • By Product Format
      • By End Consumer Tier
    • Market Attractiveness Analysis
      • By Country
      • By Ingredient Encapsulated
      • By Shell Material
      • By Application
      • By Product Format
      • By End Consumer Tier
    • Key Takeaways
  16. Middle East and Africa Market Analysis 2020 to 2024 and Forecast 2025 to 2035, By Country
    • Historical Market Size Value (USD Million) & Volume (Units) Trend Analysis By Market Taxonomy, 2020 to 2024
    • Market Size Value (USD Million) & Volume (Units) Forecast By Market Taxonomy, 2025 to 2035
      • By Country
        • Turkey
        • UAE
        • Saudi Arabia
        • Israel
        • Other GCC Countries
        • North Africa
        • South Africa
      • By Ingredient Encapsulated
      • By Shell Material
      • By Application
      • By Product Format
      • By End Consumer Tier
    • Market Attractiveness Analysis
      • By Country
      • By Ingredient Encapsulated
      • By Shell Material
      • By Application
      • By Product Format
      • By End Consumer Tier
    • Key Takeaways
  17. Key Countries Market Analysis
    • USA
      • Pricing Analysis
      • Market Share Analysis, 2024
        • By Ingredient Encapsulated
        • By Shell Material
        • By Application
        • By Product Format
        • By End Consumer Tier
    • Canada
      • Pricing Analysis
      • Market Share Analysis, 2024
        • By Ingredient Encapsulated
        • By Shell Material
        • By Application
        • By Product Format
        • By End Consumer Tier
    • Brazil
      • Pricing Analysis
      • Market Share Analysis, 2024
        • By Ingredient Encapsulated
        • By Shell Material
        • By Application
        • By Product Format
        • By End Consumer Tier
    • Mexico
      • Pricing Analysis
      • Market Share Analysis, 2024
        • By Ingredient Encapsulated
        • By Shell Material
        • By Application
        • By Product Format
        • By End Consumer Tier
    • Colombia
      • Pricing Analysis
      • Market Share Analysis, 2024
        • By Ingredient Encapsulated
        • By Shell Material
        • By Application
        • By Product Format
        • By End Consumer Tier
    • Germany
      • Pricing Analysis
      • Market Share Analysis, 2024
        • By Ingredient Encapsulated
        • By Shell Material
        • By Application
        • By Product Format
        • By End Consumer Tier
    • UK
      • Pricing Analysis
      • Market Share Analysis, 2024
        • By Ingredient Encapsulated
        • By Shell Material
        • By Application
        • By Product Format
        • By End Consumer Tier
    • France
      • Pricing Analysis
      • Market Share Analysis, 2024
        • By Ingredient Encapsulated
        • By Shell Material
        • By Application
        • By Product Format
        • By End Consumer Tier
    • Italy
      • Pricing Analysis
      • Market Share Analysis, 2024
        • By Ingredient Encapsulated
        • By Shell Material
        • By Application
        • By Product Format
        • By End Consumer Tier
    • Spain
      • Pricing Analysis
      • Market Share Analysis, 2024
        • By Ingredient Encapsulated
        • By Shell Material
        • By Application
        • By Product Format
        • By End Consumer Tier
    • Belgium
      • Pricing Analysis
      • Market Share Analysis, 2024
        • By Ingredient Encapsulated
        • By Shell Material
        • By Application
        • By Product Format
        • By End Consumer Tier
    • Netherlands
      • Pricing Analysis
      • Market Share Analysis, 2024
        • By Ingredient Encapsulated
        • By Shell Material
        • By Application
        • By Product Format
        • By End Consumer Tier
    • Nordic
      • Pricing Analysis
      • Market Share Analysis, 2024
        • By Ingredient Encapsulated
        • By Shell Material
        • By Application
        • By Product Format
        • By End Consumer Tier
    • Switzerland
      • Pricing Analysis
      • Market Share Analysis, 2024
        • By Ingredient Encapsulated
        • By Shell Material
        • By Application
        • By Product Format
        • By End Consumer Tier
    • Russia
      • Pricing Analysis
      • Market Share Analysis, 2024
        • By Ingredient Encapsulated
        • By Shell Material
        • By Application
        • By Product Format
        • By End Consumer Tier
    • Poland
      • Pricing Analysis
      • Market Share Analysis, 2024
        • By Ingredient Encapsulated
        • By Shell Material
        • By Application
        • By Product Format
        • By End Consumer Tier
    • China
      • Pricing Analysis
      • Market Share Analysis, 2024
        • By Ingredient Encapsulated
        • By Shell Material
        • By Application
        • By Product Format
        • By End Consumer Tier
    • Japan
      • Pricing Analysis
      • Market Share Analysis, 2024
        • By Ingredient Encapsulated
        • By Shell Material
        • By Application
        • By Product Format
        • By End Consumer Tier
    • South Korea
      • Pricing Analysis
      • Market Share Analysis, 2024
        • By Ingredient Encapsulated
        • By Shell Material
        • By Application
        • By Product Format
        • By End Consumer Tier
    • India
      • Pricing Analysis
      • Market Share Analysis, 2024
        • By Ingredient Encapsulated
        • By Shell Material
        • By Application
        • By Product Format
        • By End Consumer Tier
    • Thailand
      • Pricing Analysis
      • Market Share Analysis, 2024
        • By Ingredient Encapsulated
        • By Shell Material
        • By Application
        • By Product Format
        • By End Consumer Tier
    • Indonesia
      • Pricing Analysis
      • Market Share Analysis, 2024
        • By Ingredient Encapsulated
        • By Shell Material
        • By Application
        • By Product Format
        • By End Consumer Tier
    • Australia
      • Pricing Analysis
      • Market Share Analysis, 2024
        • By Ingredient Encapsulated
        • By Shell Material
        • By Application
        • By Product Format
        • By End Consumer Tier
    • New Zealand
      • Pricing Analysis
      • Market Share Analysis, 2024
        • By Ingredient Encapsulated
        • By Shell Material
        • By Application
        • By Product Format
        • By End Consumer Tier
    • Turkey
      • Pricing Analysis
      • Market Share Analysis, 2024
        • By Ingredient Encapsulated
        • By Shell Material
        • By Application
        • By Product Format
        • By End Consumer Tier
    • UAE
      • Pricing Analysis
      • Market Share Analysis, 2024
        • By Ingredient Encapsulated
        • By Shell Material
        • By Application
        • By Product Format
        • By End Consumer Tier
    • Saudi Arabia
      • Pricing Analysis
      • Market Share Analysis, 2024
        • By Ingredient Encapsulated
        • By Shell Material
        • By Application
        • By Product Format
        • By End Consumer Tier
    • Israel
      • Pricing Analysis
      • Market Share Analysis, 2024
        • By Ingredient Encapsulated
        • By Shell Material
        • By Application
        • By Product Format
        • By End Consumer Tier
    • North Africa
      • Pricing Analysis
      • Market Share Analysis, 2024
        • By Ingredient Encapsulated
        • By Shell Material
        • By Application
        • By Product Format
        • By End Consumer Tier
    • South Africa
      • Pricing Analysis
      • Market Share Analysis, 2024
        • By Ingredient Encapsulated
        • By Shell Material
        • By Application
        • By Product Format
        • By End Consumer Tier
  18. Market Structure Analysis
    • Competition Dashboard
    • Competition Benchmarking
    • Market Share Analysis of Top Players
      • By Regional
      • By Ingredient Encapsulated
      • By Shell Material
      • By Application
      • By Product Format
      • By End Consumer Tier
  19. Competition Analysis
    • Competition Deep Dive
      • Evonik
        • Overview
        • Product Portfolio
        • Profitability by Market Segments (Product/Age /Sales Channel/Region)
        • Sales Footprint
        • Strategy Overview
          • Marketing Strategy
          • Product Strategy
          • Channel Strategy
      • BASF
        • Overview
        • Product Portfolio
        • Profitability by Market Segments (Product/Age /Sales Channel/Region)
        • Sales Footprint
        • Strategy Overview
          • Marketing Strategy
          • Product Strategy
          • Channel Strategy
      • Croda
        • Overview
        • Product Portfolio
        • Profitability by Market Segments (Product/Age /Sales Channel/Region)
        • Sales Footprint
        • Strategy Overview
          • Marketing Strategy
          • Product Strategy
          • Channel Strategy
      • Ashland
        • Overview
        • Product Portfolio
        • Profitability by Market Segments (Product/Age /Sales Channel/Region)
        • Sales Footprint
        • Strategy Overview
          • Marketing Strategy
          • Product Strategy
          • Channel Strategy
      • Lubrizol
        • Overview
        • Product Portfolio
        • Profitability by Market Segments (Product/Age /Sales Channel/Region)
        • Sales Footprint
        • Strategy Overview
          • Marketing Strategy
          • Product Strategy
          • Channel Strategy
      • Seppic
        • Overview
        • Product Portfolio
        • Profitability by Market Segments (Product/Age /Sales Channel/Region)
        • Sales Footprint
        • Strategy Overview
          • Marketing Strategy
          • Product Strategy
          • Channel Strategy
      • Gattefossé
        • Overview
        • Product Portfolio
        • Profitability by Market Segments (Product/Age /Sales Channel/Region)
        • Sales Footprint
        • Strategy Overview
          • Marketing Strategy
          • Product Strategy
          • Channel Strategy
      • Kobo Products
        • Overview
        • Product Portfolio
        • Profitability by Market Segments (Product/Age /Sales Channel/Region)
        • Sales Footprint
        • Strategy Overview
          • Marketing Strategy
          • Product Strategy
          • Channel Strategy
      • INOLEX
        • Overview
        • Product Portfolio
        • Profitability by Market Segments (Product/Age /Sales Channel/Region)
        • Sales Footprint
        • Strategy Overview
          • Marketing Strategy
          • Product Strategy
          • Channel Strategy
      • Sensient Cosmetic Technologies
        • Overview
        • Product Portfolio
        • Profitability by Market Segments (Product/Age /Sales Channel/Region)
        • Sales Footprint
        • Strategy Overview
          • Marketing Strategy
          • Product Strategy
          • Channel Strategy
  20. Assumptions & Acronyms Used
  21. Research Methodology

List of Tables

  • Table 1: Global Market Value (USD Million) Forecast by Region, 2020-2035
  • Table 2: Global Market Volume (Units) Forecast by Region, 2020-2035
  • Table 3: Global Market Value (USD Million) Forecast by Ingredient Encapsulated, 2020-2035
  • Table 4: Global Market Volume (Units) Forecast by Ingredient Encapsulated, 2020-2035
  • Table 5: Global Market Value (USD Million) Forecast by Shell Material, 2020-2035
  • Table 6: Global Market Volume (Units) Forecast by Shell Material, 2020-2035
  • Table 7: Global Market Value (USD Million) Forecast by Application, 2020-2035
  • Table 8: Global Market Volume (Units) Forecast by Application, 2020-2035
  • Table 9: Global Market Value (USD Million) Forecast by Product Format, 2020-2035
  • Table 10: Global Market Volume (Units) Forecast by Product Format, 2020-2035
  • Table 11: Global Market Value (USD Million) Forecast by End Consumer Tier, 2020-2035
  • Table 12: Global Market Volume (Units) Forecast by End Consumer Tier, 2020-2035
  • Table 13: North America Market Value (USD Million) Forecast by Country, 2020-2035
  • Table 14: North America Market Volume (Units) Forecast by Country, 2020-2035
  • Table 15: North America Market Value (USD Million) Forecast by Ingredient Encapsulated, 2020-2035
  • Table 16: North America Market Volume (Units) Forecast by Ingredient Encapsulated, 2020-2035
  • Table 17: North America Market Value (USD Million) Forecast by Shell Material, 2020-2035
  • Table 18: North America Market Volume (Units) Forecast by Shell Material, 2020-2035
  • Table 19: North America Market Value (USD Million) Forecast by Application, 2020-2035
  • Table 20: North America Market Volume (Units) Forecast by Application, 2020-2035
  • Table 21: North America Market Value (USD Million) Forecast by Product Format, 2020-2035
  • Table 22: North America Market Volume (Units) Forecast by Product Format, 2020-2035
  • Table 23: North America Market Value (USD Million) Forecast by End Consumer Tier, 2020-2035
  • Table 24: North America Market Volume (Units) Forecast by End Consumer Tier, 2020-2035
  • Table 25: Latin America Market Value (USD Million) Forecast by Country, 2020-2035
  • Table 26: Latin America Market Volume (Units) Forecast by Country, 2020-2035
  • Table 27: Latin America Market Value (USD Million) Forecast by Ingredient Encapsulated, 2020-2035
  • Table 28: Latin America Market Volume (Units) Forecast by Ingredient Encapsulated, 2020-2035
  • Table 29: Latin America Market Value (USD Million) Forecast by Shell Material, 2020-2035
  • Table 30: Latin America Market Volume (Units) Forecast by Shell Material, 2020-2035
  • Table 31: Latin America Market Value (USD Million) Forecast by Application, 2020-2035
  • Table 32: Latin America Market Volume (Units) Forecast by Application, 2020-2035
  • Table 33: Latin America Market Value (USD Million) Forecast by Product Format, 2020-2035
  • Table 34: Latin America Market Volume (Units) Forecast by Product Format, 2020-2035
  • Table 35: Latin America Market Value (USD Million) Forecast by End Consumer Tier, 2020-2035
  • Table 36: Latin America Market Volume (Units) Forecast by End Consumer Tier, 2020-2035
  • Table 37: Europe Market Value (USD Million) Forecast by Country, 2020-2035
  • Table 38: Europe Market Volume (Units) Forecast by Country, 2020-2035
  • Table 39: Europe Market Value (USD Million) Forecast by Ingredient Encapsulated, 2020-2035
  • Table 40: Europe Market Volume (Units) Forecast by Ingredient Encapsulated, 2020-2035
  • Table 41: Europe Market Value (USD Million) Forecast by Shell Material, 2020-2035
  • Table 42: Europe Market Volume (Units) Forecast by Shell Material, 2020-2035
  • Table 43: Europe Market Value (USD Million) Forecast by Application, 2020-2035
  • Table 44: Europe Market Volume (Units) Forecast by Application, 2020-2035
  • Table 45: Europe Market Value (USD Million) Forecast by Product Format, 2020-2035
  • Table 46: Europe Market Volume (Units) Forecast by Product Format, 2020-2035
  • Table 47: Europe Market Value (USD Million) Forecast by End Consumer Tier, 2020-2035
  • Table 48: Europe Market Volume (Units) Forecast by End Consumer Tier, 2020-2035
  • Table 49: East Asia Market Value (USD Million) Forecast by Country, 2020-2035
  • Table 50: East Asia Market Volume (Units) Forecast by Country, 2020-2035
  • Table 51: East Asia Market Value (USD Million) Forecast by Ingredient Encapsulated, 2020-2035
  • Table 52: East Asia Market Volume (Units) Forecast by Ingredient Encapsulated, 2020-2035
  • Table 53: East Asia Market Value (USD Million) Forecast by Shell Material, 2020-2035
  • Table 54: East Asia Market Volume (Units) Forecast by Shell Material, 2020-2035
  • Table 55: East Asia Market Value (USD Million) Forecast by Application, 2020-2035
  • Table 56: East Asia Market Volume (Units) Forecast by Application, 2020-2035
  • Table 57: East Asia Market Value (USD Million) Forecast by Product Format, 2020-2035
  • Table 58: East Asia Market Volume (Units) Forecast by Product Format, 2020-2035
  • Table 59: East Asia Market Value (USD Million) Forecast by End Consumer Tier, 2020-2035
  • Table 60: East Asia Market Volume (Units) Forecast by End Consumer Tier, 2020-2035
  • Table 61: South Asia & Pacific Market Value (USD Million) Forecast by Country, 2020-2035
  • Table 62: South Asia & Pacific Market Volume (Units) Forecast by Country, 2020-2035
  • Table 63: South Asia & Pacific Market Value (USD Million) Forecast by Ingredient Encapsulated, 2020-2035
  • Table 64: South Asia & Pacific Market Volume (Units) Forecast by Ingredient Encapsulated, 2020-2035
  • Table 65: South Asia & Pacific Market Value (USD Million) Forecast by Shell Material, 2020-2035
  • Table 66: South Asia & Pacific Market Volume (Units) Forecast by Shell Material, 2020-2035
  • Table 67: South Asia & Pacific Market Value (USD Million) Forecast by Application, 2020-2035
  • Table 68: South Asia & Pacific Market Volume (Units) Forecast by Application, 2020-2035
  • Table 69: South Asia & Pacific Market Value (USD Million) Forecast by Product Format, 2020-2035
  • Table 70: South Asia & Pacific Market Volume (Units) Forecast by Product Format, 2020-2035
  • Table 71: South Asia & Pacific Market Value (USD Million) Forecast by End Consumer Tier, 2020-2035
  • Table 72: South Asia & Pacific Market Volume (Units) Forecast by End Consumer Tier, 2020-2035
  • Table 73: Middle East and Africa Market Value (USD Million) Forecast by Country, 2020-2035
  • Table 74: Middle East and Africa Market Volume (Units) Forecast by Country, 2020-2035
  • Table 75: Middle East and Africa Market Value (USD Million) Forecast by Ingredient Encapsulated, 2020-2035
  • Table 76: Middle East and Africa Market Volume (Units) Forecast by Ingredient Encapsulated, 2020-2035
  • Table 77: Middle East and Africa Market Value (USD Million) Forecast by Shell Material, 2020-2035
  • Table 78: Middle East and Africa Market Volume (Units) Forecast by Shell Material, 2020-2035
  • Table 79: Middle East and Africa Market Value (USD Million) Forecast by Application, 2020-2035
  • Table 80: Middle East and Africa Market Volume (Units) Forecast by Application, 2020-2035
  • Table 81: Middle East and Africa Market Value (USD Million) Forecast by Product Format, 2020-2035
  • Table 82: Middle East and Africa Market Volume (Units) Forecast by Product Format, 2020-2035
  • Table 83: Middle East and Africa Market Value (USD Million) Forecast by End Consumer Tier, 2020-2035
  • Table 84: Middle East and Africa Market Volume (Units) Forecast by End Consumer Tier, 2020-2035

List of Figures

  • Figure 1: Global Market Value (USD Million) by Ingredient Encapsulated, 2025-2035
  • Figure 2: Global Market Value (USD Million) by Shell Material, 2025-2035
  • Figure 3: Global Market Value (USD Million) by Application, 2025-2035
  • Figure 4: Global Market Value (USD Million) by Product Format, 2025-2035
  • Figure 5: Global Market Value (USD Million) by End Consumer Tier, 2025-2035
  • Figure 6: Global Market Value (USD Million) by Region, 2025-2035
  • Figure 7: Global Market Value (USD Million) Analysis by Region, 2020-2035
  • Figure 8: Global Market Volume (Units) Analysis by Region, 2020-2035
  • Figure 9: Global Market Value Share (%) and BPS Analysis by Region, 2025-2035
  • Figure 10: Global Market Y-o-Y Growth (%) Projections by Region, 2025-2035
  • Figure 11: Global Market Value (USD Million) Analysis by Ingredient Encapsulated, 2020-2035
  • Figure 12: Global Market Volume (Units) Analysis by Ingredient Encapsulated, 2020-2035
  • Figure 13: Global Market Value Share (%) and BPS Analysis by Ingredient Encapsulated, 2025-2035
  • Figure 14: Global Market Y-o-Y Growth (%) Projections by Ingredient Encapsulated, 2025-2035
  • Figure 15: Global Market Value (USD Million) Analysis by Shell Material, 2020-2035
  • Figure 16: Global Market Volume (Units) Analysis by Shell Material, 2020-2035
  • Figure 17: Global Market Value Share (%) and BPS Analysis by Shell Material, 2025-2035
  • Figure 18: Global Market Y-o-Y Growth (%) Projections by Shell Material, 2025-2035
  • Figure 19: Global Market Value (USD Million) Analysis by Application, 2020-2035
  • Figure 20: Global Market Volume (Units) Analysis by Application, 2020-2035
  • Figure 21: Global Market Value Share (%) and BPS Analysis by Application, 2025-2035
  • Figure 22: Global Market Y-o-Y Growth (%) Projections by Application, 2025-2035
  • Figure 23: Global Market Value (USD Million) Analysis by Product Format, 2020-2035
  • Figure 24: Global Market Volume (Units) Analysis by Product Format, 2020-2035
  • Figure 25: Global Market Value Share (%) and BPS Analysis by Product Format, 2025-2035
  • Figure 26: Global Market Y-o-Y Growth (%) Projections by Product Format, 2025-2035
  • Figure 27: Global Market Value (USD Million) Analysis by End Consumer Tier, 2020-2035
  • Figure 28: Global Market Volume (Units) Analysis by End Consumer Tier, 2020-2035
  • Figure 29: Global Market Value Share (%) and BPS Analysis by End Consumer Tier, 2025-2035
  • Figure 30: Global Market Y-o-Y Growth (%) Projections by End Consumer Tier, 2025-2035
  • Figure 31: Global Market Attractiveness by Ingredient Encapsulated, 2025-2035
  • Figure 32: Global Market Attractiveness by Shell Material, 2025-2035
  • Figure 33: Global Market Attractiveness by Application, 2025-2035
  • Figure 34: Global Market Attractiveness by Product Format, 2025-2035
  • Figure 35: Global Market Attractiveness by End Consumer Tier, 2025-2035
  • Figure 36: Global Market Attractiveness by Region, 2025-2035
  • Figure 37: North America Market Value (USD Million) by Ingredient Encapsulated, 2025-2035
  • Figure 38: North America Market Value (USD Million) by Shell Material, 2025-2035
  • Figure 39: North America Market Value (USD Million) by Application, 2025-2035
  • Figure 40: North America Market Value (USD Million) by Product Format, 2025-2035
  • Figure 41: North America Market Value (USD Million) by End Consumer Tier, 2025-2035
  • Figure 42: North America Market Value (USD Million) by Country, 2025-2035
  • Figure 43: North America Market Value (USD Million) Analysis by Country, 2020-2035
  • Figure 44: North America Market Volume (Units) Analysis by Country, 2020-2035
  • Figure 45: North America Market Value Share (%) and BPS Analysis by Country, 2025-2035
  • Figure 46: North America Market Y-o-Y Growth (%) Projections by Country, 2025-2035
  • Figure 47: North America Market Value (USD Million) Analysis by Ingredient Encapsulated, 2020-2035
  • Figure 48: North America Market Volume (Units) Analysis by Ingredient Encapsulated, 2020-2035
  • Figure 49: North America Market Value Share (%) and BPS Analysis by Ingredient Encapsulated, 2025-2035
  • Figure 50: North America Market Y-o-Y Growth (%) Projections by Ingredient Encapsulated, 2025-2035
  • Figure 51: North America Market Value (USD Million) Analysis by Shell Material, 2020-2035
  • Figure 52: North America Market Volume (Units) Analysis by Shell Material, 2020-2035
  • Figure 53: North America Market Value Share (%) and BPS Analysis by Shell Material, 2025-2035
  • Figure 54: North America Market Y-o-Y Growth (%) Projections by Shell Material, 2025-2035
  • Figure 55: North America Market Value (USD Million) Analysis by Application, 2020-2035
  • Figure 56: North America Market Volume (Units) Analysis by Application, 2020-2035
  • Figure 57: North America Market Value Share (%) and BPS Analysis by Application, 2025-2035
  • Figure 58: North America Market Y-o-Y Growth (%) Projections by Application, 2025-2035
  • Figure 59: North America Market Value (USD Million) Analysis by Product Format, 2020-2035
  • Figure 60: North America Market Volume (Units) Analysis by Product Format, 2020-2035
  • Figure 61: North America Market Value Share (%) and BPS Analysis by Product Format, 2025-2035
  • Figure 62: North America Market Y-o-Y Growth (%) Projections by Product Format, 2025-2035
  • Figure 63: North America Market Value (USD Million) Analysis by End Consumer Tier, 2020-2035
  • Figure 64: North America Market Volume (Units) Analysis by End Consumer Tier, 2020-2035
  • Figure 65: North America Market Value Share (%) and BPS Analysis by End Consumer Tier, 2025-2035
  • Figure 66: North America Market Y-o-Y Growth (%) Projections by End Consumer Tier, 2025-2035
  • Figure 67: North America Market Attractiveness by Ingredient Encapsulated, 2025-2035
  • Figure 68: North America Market Attractiveness by Shell Material, 2025-2035
  • Figure 69: North America Market Attractiveness by Application, 2025-2035
  • Figure 70: North America Market Attractiveness by Product Format, 2025-2035
  • Figure 71: North America Market Attractiveness by End Consumer Tier, 2025-2035
  • Figure 72: North America Market Attractiveness by Country, 2025-2035
  • Figure 73: Latin America Market Value (USD Million) by Ingredient Encapsulated, 2025-2035
  • Figure 74: Latin America Market Value (USD Million) by Shell Material, 2025-2035
  • Figure 75: Latin America Market Value (USD Million) by Application, 2025-2035
  • Figure 76: Latin America Market Value (USD Million) by Product Format, 2025-2035
  • Figure 77: Latin America Market Value (USD Million) by End Consumer Tier, 2025-2035
  • Figure 78: Latin America Market Value (USD Million) by Country, 2025-2035
  • Figure 79: Latin America Market Value (USD Million) Analysis by Country, 2020-2035
  • Figure 80: Latin America Market Volume (Units) Analysis by Country, 2020-2035
  • Figure 81: Latin America Market Value Share (%) and BPS Analysis by Country, 2025-2035
  • Figure 82: Latin America Market Y-o-Y Growth (%) Projections by Country, 2025-2035
  • Figure 83: Latin America Market Value (USD Million) Analysis by Ingredient Encapsulated, 2020-2035
  • Figure 84: Latin America Market Volume (Units) Analysis by Ingredient Encapsulated, 2020-2035
  • Figure 85: Latin America Market Value Share (%) and BPS Analysis by Ingredient Encapsulated, 2025-2035
  • Figure 86: Latin America Market Y-o-Y Growth (%) Projections by Ingredient Encapsulated, 2025-2035
  • Figure 87: Latin America Market Value (USD Million) Analysis by Shell Material, 2020-2035
  • Figure 88: Latin America Market Volume (Units) Analysis by Shell Material, 2020-2035
  • Figure 89: Latin America Market Value Share (%) and BPS Analysis by Shell Material, 2025-2035
  • Figure 90: Latin America Market Y-o-Y Growth (%) Projections by Shell Material, 2025-2035
  • Figure 91: Latin America Market Value (USD Million) Analysis by Application, 2020-2035
  • Figure 92: Latin America Market Volume (Units) Analysis by Application, 2020-2035
  • Figure 93: Latin America Market Value Share (%) and BPS Analysis by Application, 2025-2035
  • Figure 94: Latin America Market Y-o-Y Growth (%) Projections by Application, 2025-2035
  • Figure 95: Latin America Market Value (USD Million) Analysis by Product Format, 2020-2035
  • Figure 96: Latin America Market Volume (Units) Analysis by Product Format, 2020-2035
  • Figure 97: Latin America Market Value Share (%) and BPS Analysis by Product Format, 2025-2035
  • Figure 98: Latin America Market Y-o-Y Growth (%) Projections by Product Format, 2025-2035
  • Figure 99: Latin America Market Value (USD Million) Analysis by End Consumer Tier, 2020-2035
  • Figure 100: Latin America Market Volume (Units) Analysis by End Consumer Tier, 2020-2035
  • Figure 101: Latin America Market Value Share (%) and BPS Analysis by End Consumer Tier, 2025-2035
  • Figure 102: Latin America Market Y-o-Y Growth (%) Projections by End Consumer Tier, 2025-2035
  • Figure 103: Latin America Market Attractiveness by Ingredient Encapsulated, 2025-2035
  • Figure 104: Latin America Market Attractiveness by Shell Material, 2025-2035
  • Figure 105: Latin America Market Attractiveness by Application, 2025-2035
  • Figure 106: Latin America Market Attractiveness by Product Format, 2025-2035
  • Figure 107: Latin America Market Attractiveness by End Consumer Tier, 2025-2035
  • Figure 108: Latin America Market Attractiveness by Country, 2025-2035
  • Figure 109: Europe Market Value (USD Million) by Ingredient Encapsulated, 2025-2035
  • Figure 110: Europe Market Value (USD Million) by Shell Material, 2025-2035
  • Figure 111: Europe Market Value (USD Million) by Application, 2025-2035
  • Figure 112: Europe Market Value (USD Million) by Product Format, 2025-2035
  • Figure 113: Europe Market Value (USD Million) by End Consumer Tier, 2025-2035
  • Figure 114: Europe Market Value (USD Million) by Country, 2025-2035
  • Figure 115: Europe Market Value (USD Million) Analysis by Country, 2020-2035
  • Figure 116: Europe Market Volume (Units) Analysis by Country, 2020-2035
  • Figure 117: Europe Market Value Share (%) and BPS Analysis by Country, 2025-2035
  • Figure 118: Europe Market Y-o-Y Growth (%) Projections by Country, 2025-2035
  • Figure 119: Europe Market Value (USD Million) Analysis by Ingredient Encapsulated, 2020-2035
  • Figure 120: Europe Market Volume (Units) Analysis by Ingredient Encapsulated, 2020-2035
  • Figure 121: Europe Market Value Share (%) and BPS Analysis by Ingredient Encapsulated, 2025-2035
  • Figure 122: Europe Market Y-o-Y Growth (%) Projections by Ingredient Encapsulated, 2025-2035
  • Figure 123: Europe Market Value (USD Million) Analysis by Shell Material, 2020-2035
  • Figure 124: Europe Market Volume (Units) Analysis by Shell Material, 2020-2035
  • Figure 125: Europe Market Value Share (%) and BPS Analysis by Shell Material, 2025-2035
  • Figure 126: Europe Market Y-o-Y Growth (%) Projections by Shell Material, 2025-2035
  • Figure 127: Europe Market Value (USD Million) Analysis by Application, 2020-2035
  • Figure 128: Europe Market Volume (Units) Analysis by Application, 2020-2035
  • Figure 129: Europe Market Value Share (%) and BPS Analysis by Application, 2025-2035
  • Figure 130: Europe Market Y-o-Y Growth (%) Projections by Application, 2025-2035
  • Figure 131: Europe Market Value (USD Million) Analysis by Product Format, 2020-2035
  • Figure 132: Europe Market Volume (Units) Analysis by Product Format, 2020-2035
  • Figure 133: Europe Market Value Share (%) and BPS Analysis by Product Format, 2025-2035
  • Figure 134: Europe Market Y-o-Y Growth (%) Projections by Product Format, 2025-2035
  • Figure 135: Europe Market Value (USD Million) Analysis by End Consumer Tier, 2020-2035
  • Figure 136: Europe Market Volume (Units) Analysis by End Consumer Tier, 2020-2035
  • Figure 137: Europe Market Value Share (%) and BPS Analysis by End Consumer Tier, 2025-2035
  • Figure 138: Europe Market Y-o-Y Growth (%) Projections by End Consumer Tier, 2025-2035
  • Figure 139: Europe Market Attractiveness by Ingredient Encapsulated, 2025-2035
  • Figure 140: Europe Market Attractiveness by Shell Material, 2025-2035
  • Figure 141: Europe Market Attractiveness by Application, 2025-2035
  • Figure 142: Europe Market Attractiveness by Product Format, 2025-2035
  • Figure 143: Europe Market Attractiveness by End Consumer Tier, 2025-2035
  • Figure 144: Europe Market Attractiveness by Country, 2025-2035
  • Figure 145: East Asia Market Value (USD Million) by Ingredient Encapsulated, 2025-2035
  • Figure 146: East Asia Market Value (USD Million) by Shell Material, 2025-2035
  • Figure 147: East Asia Market Value (USD Million) by Application, 2025-2035
  • Figure 148: East Asia Market Value (USD Million) by Product Format, 2025-2035
  • Figure 149: East Asia Market Value (USD Million) by End Consumer Tier, 2025-2035
  • Figure 150: East Asia Market Value (USD Million) by Country, 2025-2035
  • Figure 151: East Asia Market Value (USD Million) Analysis by Country, 2020-2035
  • Figure 152: East Asia Market Volume (Units) Analysis by Country, 2020-2035
  • Figure 153: East Asia Market Value Share (%) and BPS Analysis by Country, 2025-2035
  • Figure 154: East Asia Market Y-o-Y Growth (%) Projections by Country, 2025-2035
  • Figure 155: East Asia Market Value (USD Million) Analysis by Ingredient Encapsulated, 2020-2035
  • Figure 156: East Asia Market Volume (Units) Analysis by Ingredient Encapsulated, 2020-2035
  • Figure 157: East Asia Market Value Share (%) and BPS Analysis by Ingredient Encapsulated, 2025-2035
  • Figure 158: East Asia Market Y-o-Y Growth (%) Projections by Ingredient Encapsulated, 2025-2035
  • Figure 159: East Asia Market Value (USD Million) Analysis by Shell Material, 2020-2035
  • Figure 160: East Asia Market Volume (Units) Analysis by Shell Material, 2020-2035
  • Figure 161: East Asia Market Value Share (%) and BPS Analysis by Shell Material, 2025-2035
  • Figure 162: East Asia Market Y-o-Y Growth (%) Projections by Shell Material, 2025-2035
  • Figure 163: East Asia Market Value (USD Million) Analysis by Application, 2020-2035
  • Figure 164: East Asia Market Volume (Units) Analysis by Application, 2020-2035
  • Figure 165: East Asia Market Value Share (%) and BPS Analysis by Application, 2025-2035
  • Figure 166: East Asia Market Y-o-Y Growth (%) Projections by Application, 2025-2035
  • Figure 167: East Asia Market Value (USD Million) Analysis by Product Format, 2020-2035
  • Figure 168: East Asia Market Volume (Units) Analysis by Product Format, 2020-2035
  • Figure 169: East Asia Market Value Share (%) and BPS Analysis by Product Format, 2025-2035
  • Figure 170: East Asia Market Y-o-Y Growth (%) Projections by Product Format, 2025-2035
  • Figure 171: East Asia Market Value (USD Million) Analysis by End Consumer Tier, 2020-2035
  • Figure 172: East Asia Market Volume (Units) Analysis by End Consumer Tier, 2020-2035
  • Figure 173: East Asia Market Value Share (%) and BPS Analysis by End Consumer Tier, 2025-2035
  • Figure 174: East Asia Market Y-o-Y Growth (%) Projections by End Consumer Tier, 2025-2035
  • Figure 175: East Asia Market Attractiveness by Ingredient Encapsulated, 2025-2035
  • Figure 176: East Asia Market Attractiveness by Shell Material, 2025-2035
  • Figure 177: East Asia Market Attractiveness by Application, 2025-2035
  • Figure 178: East Asia Market Attractiveness by Product Format, 2025-2035
  • Figure 179: East Asia Market Attractiveness by End Consumer Tier, 2025-2035
  • Figure 180: East Asia Market Attractiveness by Country, 2025-2035
  • Figure 181: South Asia & Pacific Market Value (USD Million) by Ingredient Encapsulated, 2025-2035
  • Figure 182: South Asia & Pacific Market Value (USD Million) by Shell Material, 2025-2035
  • Figure 183: South Asia & Pacific Market Value (USD Million) by Application, 2025-2035
  • Figure 184: South Asia & Pacific Market Value (USD Million) by Product Format, 2025-2035
  • Figure 185: South Asia & Pacific Market Value (USD Million) by End Consumer Tier, 2025-2035
  • Figure 186: South Asia & Pacific Market Value (USD Million) by Country, 2025-2035
  • Figure 187: South Asia & Pacific Market Value (USD Million) Analysis by Country, 2020-2035
  • Figure 188: South Asia & Pacific Market Volume (Units) Analysis by Country, 2020-2035
  • Figure 189: South Asia & Pacific Market Value Share (%) and BPS Analysis by Country, 2025-2035
  • Figure 190: South Asia & Pacific Market Y-o-Y Growth (%) Projections by Country, 2025-2035
  • Figure 191: South Asia & Pacific Market Value (USD Million) Analysis by Ingredient Encapsulated, 2020-2035
  • Figure 192: South Asia & Pacific Market Volume (Units) Analysis by Ingredient Encapsulated, 2020-2035
  • Figure 193: South Asia & Pacific Market Value Share (%) and BPS Analysis by Ingredient Encapsulated, 2025-2035
  • Figure 194: South Asia & Pacific Market Y-o-Y Growth (%) Projections by Ingredient Encapsulated, 2025-2035
  • Figure 195: South Asia & Pacific Market Value (USD Million) Analysis by Shell Material, 2020-2035
  • Figure 196: South Asia & Pacific Market Volume (Units) Analysis by Shell Material, 2020-2035
  • Figure 197: South Asia & Pacific Market Value Share (%) and BPS Analysis by Shell Material, 2025-2035
  • Figure 198: South Asia & Pacific Market Y-o-Y Growth (%) Projections by Shell Material, 2025-2035
  • Figure 199: South Asia & Pacific Market Value (USD Million) Analysis by Application, 2020-2035
  • Figure 200: South Asia & Pacific Market Volume (Units) Analysis by Application, 2020-2035
  • Figure 201: South Asia & Pacific Market Value Share (%) and BPS Analysis by Application, 2025-2035
  • Figure 202: South Asia & Pacific Market Y-o-Y Growth (%) Projections by Application, 2025-2035
  • Figure 203: South Asia & Pacific Market Value (USD Million) Analysis by Product Format, 2020-2035
  • Figure 204: South Asia & Pacific Market Volume (Units) Analysis by Product Format, 2020-2035
  • Figure 205: South Asia & Pacific Market Value Share (%) and BPS Analysis by Product Format, 2025-2035
  • Figure 206: South Asia & Pacific Market Y-o-Y Growth (%) Projections by Product Format, 2025-2035
  • Figure 207: South Asia & Pacific Market Value (USD Million) Analysis by End Consumer Tier, 2020-2035
  • Figure 208: South Asia & Pacific Market Volume (Units) Analysis by End Consumer Tier, 2020-2035
  • Figure 209: South Asia & Pacific Market Value Share (%) and BPS Analysis by End Consumer Tier, 2025-2035
  • Figure 210: South Asia & Pacific Market Y-o-Y Growth (%) Projections by End Consumer Tier, 2025-2035
  • Figure 211: South Asia & Pacific Market Attractiveness by Ingredient Encapsulated, 2025-2035
  • Figure 212: South Asia & Pacific Market Attractiveness by Shell Material, 2025-2035
  • Figure 213: South Asia & Pacific Market Attractiveness by Application, 2025-2035
  • Figure 214: South Asia & Pacific Market Attractiveness by Product Format, 2025-2035
  • Figure 215: South Asia & Pacific Market Attractiveness by End Consumer Tier, 2025-2035
  • Figure 216: South Asia & Pacific Market Attractiveness by Country, 2025-2035
  • Figure 217: Middle East and Africa Market Value (USD Million) by Ingredient Encapsulated, 2025-2035
  • Figure 218: Middle East and Africa Market Value (USD Million) by Shell Material, 2025-2035
  • Figure 219: Middle East and Africa Market Value (USD Million) by Application, 2025-2035
  • Figure 220: Middle East and Africa Market Value (USD Million) by Product Format, 2025-2035
  • Figure 221: Middle East and Africa Market Value (USD Million) by End Consumer Tier, 2025-2035
  • Figure 222: Middle East and Africa Market Value (USD Million) by Country, 2025-2035
  • Figure 223: Middle East and Africa Market Value (USD Million) Analysis by Country, 2020-2035
  • Figure 224: Middle East and Africa Market Volume (Units) Analysis by Country, 2020-2035
  • Figure 225: Middle East and Africa Market Value Share (%) and BPS Analysis by Country, 2025-2035
  • Figure 226: Middle East and Africa Market Y-o-Y Growth (%) Projections by Country, 2025-2035
  • Figure 227: Middle East and Africa Market Value (USD Million) Analysis by Ingredient Encapsulated, 2020-2035
  • Figure 228: Middle East and Africa Market Volume (Units) Analysis by Ingredient Encapsulated, 2020-2035
  • Figure 229: Middle East and Africa Market Value Share (%) and BPS Analysis by Ingredient Encapsulated, 2025-2035
  • Figure 230: Middle East and Africa Market Y-o-Y Growth (%) Projections by Ingredient Encapsulated, 2025-2035
  • Figure 231: Middle East and Africa Market Value (USD Million) Analysis by Shell Material, 2020-2035
  • Figure 232: Middle East and Africa Market Volume (Units) Analysis by Shell Material, 2020-2035
  • Figure 233: Middle East and Africa Market Value Share (%) and BPS Analysis by Shell Material, 2025-2035
  • Figure 234: Middle East and Africa Market Y-o-Y Growth (%) Projections by Shell Material, 2025-2035
  • Figure 235: Middle East and Africa Market Value (USD Million) Analysis by Application, 2020-2035
  • Figure 236: Middle East and Africa Market Volume (Units) Analysis by Application, 2020-2035
  • Figure 237: Middle East and Africa Market Value Share (%) and BPS Analysis by Application, 2025-2035
  • Figure 238: Middle East and Africa Market Y-o-Y Growth (%) Projections by Application, 2025-2035
  • Figure 239: Middle East and Africa Market Value (USD Million) Analysis by Product Format, 2020-2035
  • Figure 240: Middle East and Africa Market Volume (Units) Analysis by Product Format, 2020-2035
  • Figure 241: Middle East and Africa Market Value Share (%) and BPS Analysis by Product Format, 2025-2035
  • Figure 242: Middle East and Africa Market Y-o-Y Growth (%) Projections by Product Format, 2025-2035
  • Figure 243: Middle East and Africa Market Value (USD Million) Analysis by End Consumer Tier, 2020-2035
  • Figure 244: Middle East and Africa Market Volume (Units) Analysis by End Consumer Tier, 2020-2035
  • Figure 245: Middle East and Africa Market Value Share (%) and BPS Analysis by End Consumer Tier, 2025-2035
  • Figure 246: Middle East and Africa Market Y-o-Y Growth (%) Projections by End Consumer Tier, 2025-2035
  • Figure 247: Middle East and Africa Market Attractiveness by Ingredient Encapsulated, 2025-2035
  • Figure 248: Middle East and Africa Market Attractiveness by Shell Material, 2025-2035
  • Figure 249: Middle East and Africa Market Attractiveness by Application, 2025-2035
  • Figure 250: Middle East and Africa Market Attractiveness by Product Format, 2025-2035
  • Figure 251: Middle East and Africa Market Attractiveness by End Consumer Tier, 2025-2035
  • Figure 252: Middle East and Africa Market Attractiveness by Country, 2025-2035

Frequently Asked Questions

How big is the Microsphere Encapsulation Cosmetics Market in 2025?

The Microsphere Encapsulation Cosmetics Market is estimated to be valued at USD 1,752.3 million in 2025.

What will be the size of the Microsphere Encapsulation Cosmetics Market in 2035?

The market size for the Microsphere Encapsulation Cosmetics Market is projected to reach USD 4,324.0 million by 2035.

How much will be the Microsphere Encapsulation Cosmetics Market growth between 2025 and 2035?

The Microsphere Encapsulation Cosmetics Market is expected to grow at a 9.5% CAGR between 2025 and 2035.

What are the key product types in the Microsphere Encapsulation Cosmetics Market?

The key product formats in the Microsphere Encapsulation Cosmetics Market are serums & creams, foundations & primers, and powders.

Which ingredient segment will contribute a significant share in the Microsphere Encapsulation Cosmetics Market in 2025?

In terms of ingredient encapsulated, retinol will command 27.4% share in the Microsphere Encapsulation Cosmetics Market in 2025.

Explore Similar Insights

Future Market Insights

Microsphere Encapsulation Cosmetics Market

Chat With

MaRIA

Hi There, I am MaRIA, Your Market Research Intelligence Assistant. How may I help you?