This site uses cookies, including third-party cookies, that help us to provide and improve our services.

Privacy Policy
- Global Locations -
Headquarters
Future Market Insights, Inc.
Christiana Corporate, 200 Continental Drive, Suite 401, Newark, Delaware - 19713, United States
T: +1-845-579-5705
MEA
Market Access DMCC

1602-6 Jumeirah Bay X2 Tower, Plot No: JLT-PH2-X2A,

Jumeirah Lakes Towers, Dubai,

United Arab Emirates

Americas
Future Market Insights
616 Corporate Way, Suite 2-9018,
Valley Cottage, NY 10989,
United States
T: +1-347-918-3531
Europe
Future Market Insights
3rd Floor, 207 Regent Street,
London W1B 3HH
United Kingdom
T: + 44 (0) 20 8123 9659
D: +44 (0) 20 3287 4268
APAC
Future Market Insights
Office No. 401-A, 4th Floor,
VANTAGE 9, S.No. 36/1/1,
Baner, Pune 411045 India

Mushroom Packaging Market

Market Insights on Mushroom Packaging covering sales outlook, demand forecast & up-to-date key trends

Mushroom Packaging Market by Application, End Use Industry & Region | Forecast 2022 to 2032.

Mushroom Packaging Market Outlook (2022 to 2032)

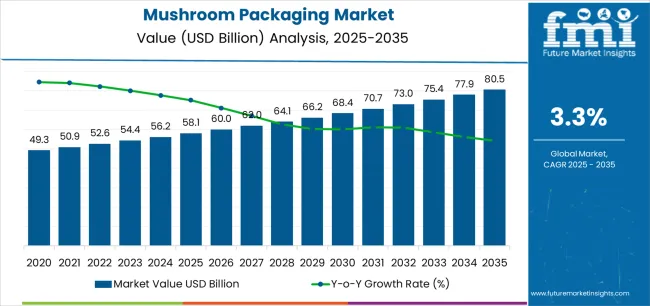
According to Future Market Insights research, during the projected period, the global mushroom packaging market is set to enjoy a valuation of US$ 57.9 Million in 2022, and further expand at a CAGR of 7.2% to reach US$ 115.7 Million by the year 2032. The sales of the boxes by product type are anticipated to bolster with the top 3 countries estimated to hold around 25 to 30% of the market by the end of 2022.

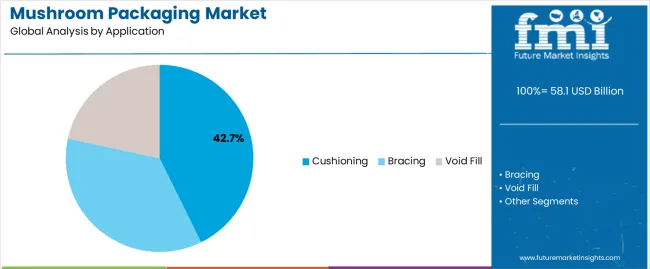
Based on the application, the cushioning segment is projected to remain the leading segment among the other application. The reason behind the same is convenience and superior product protection. The cushioning segment is estimated to create an incremental opportunity of US$ 27.4 Million from 2022 to 2032.

Market Size 2022

US$ 57.9 Million

Market Size 2032

US$ 115.7 Million

Value CAGR (2022 to 2032)

7.2%

Collective Value Share: Top 3 Countries (2022E)

25 to 30%

According to the FMI analysis, the mushroom packaging market revenue totaled US$ 55.5 Million in 2021. With the propelling demand from the various end-users, the global mushroom packaging market is projected to reach US$ 115.7 Million by 2032, accelerating at a CAGR of 7.2% during the forecast period.

The mushroom packaging market is estimated to experience a positive growth outlook during the forecast period. A new forecast by FMI anticipates that mushroom packaging sales will rise from 2022 to 2032 and is projected to create an absolute incremental growth opportunity of US$ 60.2 Million.

The significantly changing cosmetic and personal care industry amid the pandemic has increased the demand for mushroom packaging. The mushroom packaging market is anticipated to expand 2.1 times the current market value during the forecast period.

Don't pay for what you don't need

Customize your report by selecting specific countries or regions and save 30%!

Historic Market Outlook for Mushroom Packaging

The global mushroom packaging market witnessed a CAGR of 3.8% during the historic period with a market value of US$ 55.5 Million in 2021 from US$ 44.3 Million in 2015. The mushroom packaging is biodegradable packaging the process is the combination of agriculture feedstock and the natural binding strength of mycelium. Mushroom packaging ensures the safety of the product that is transferred throughout the globe. The mushroom packaging is not only growing in biodegradable packaging but also is compostable in soil within 45 days without any organism loss or soil pollution. In mushroom packaging, the thermal insulating performance is high. The mushroom packaging has different applications such as cushioning, bracing, and void fill. The rise in demand for mushroom is for cushioning as it is prepared by the roots of mushroom and has eco-friendly nature for decomposition. In some box packaging, the void is filled by mushroom packaging from the top to avoid the space left in a box or to prevent the sample. The continuously growing cosmetic and homecare industry is projected to drive the demand for mushroom packaging. Furthermore, due to the negative impact of plastic on the environment, many companies such as IKEA are moving towards green manufacturing. Europe-based multinational conglomerate home décor company is focusing on sustainable innovation by replacing plastic foam, with mushroom packaging. Overall, the global mushroom packaging market is anticipated to bolster at a faster pace during the forecast period.

Mushroom Packaging Market Download Report Brochure

How Increasing Demand for Compostable Packaging Products are Driving the Sales of Mushroom Packaging?

Compostable packaging is a kind of eco-friendly or sustainable packaging that can be decomposed at home or in the industry with the required environmental conditions. The packaging material is prepared from plant-based raw material that contains less toxic material. As composting at home is easy as it requires a compost bin with food scrap and compostable products. As compostable packaging materials are made of mushrooms as mycelium is added to the cellulosic material and placed in the mold or tray and then dried the dried part is thermal resistant, water resistant, and fully compostable in nature. Thus, the increasing demand for convenient & disposable packaging has augmented the sales of mushroom packaging.

Ismail Sutaria
Ismail Sutaria
Principal Consultant
LinkedIn
Talk to Analyst

Find your sweet spots for generating winning opportunities in this market.

Talk to Analyst

Category-wise Insights

Which Application is expected to Hold a Major Portion of the Global Mushroom Packaging Market?

Based on the application segment, the cushioning segment holds the major portion of the global mushroom packaging market. The cushioning segment is projected to hold around 47.0% of the market share by the forecast period. As mycelium has various properties and advantages that are required for effective packaging. Cushioning is also used for packaging electrical devices. As they require lightweight properties, and zero breakage, the external forces should not affect the electronic gadgets. Thus all these requirements are fulfilled through cushioning and therefore cushioning segment holds the major share in the global mushroom packaging market.

Which End Use Industry offers Lucrative Growth Opportunities in the Global Mushroom Packaging Market?

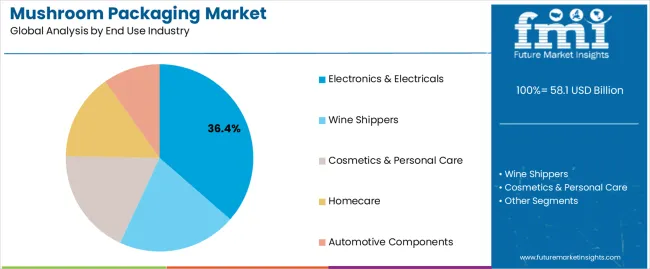
The cosmetics & personal care segment is the most lucrative segment in the end-use industry for the global mushroom packaging market and is projected to offer an incremental growth opportunity of US$ 18.0 Million during the forecast period. The beauty care center has undergone significant changes in the past few years. Post-covid, personal care, and cosmetics have seen a sudden rise. Due to an increase in online orders, of the products the usage of mushroom packaging has been increasing by producing different types of cushioning or vial fill to prevent the products. Thus, cosmetics & personal care offer lucrative growth opportunities in the global mushroom packaging market.

Country-wise insights

How the United Kingdom's Growing Industry Expected to Drive the Demand for the Mushroom Packaging?

United Kingdom's growing packaging industry is expected to drive the demand for mushroom packaging and is expected to grow the market at the rate of 7.0% in the forecast period. There has been significant growth in the biodegradable packaging industry in the United Kingdom. The reason for it is the growing environmental concern and toxicity of plastic packaging. United Kingdom-based mushroom packaging manufacturer, Magical Mushroom Company scores €3.4 million for plant-based sustainable packaging. According to the Packaging Waste Environmental Responsibilities GOV. In the United Kingdom, the government is focusing on biodegradable packaging. Various companies in the United Kingdom are launching sustainable-based packaging. Due to effective durability, less toxicity, and compostability the mushroom packaging industries are driving the market. Consumers are focusing on sustainable-based and natural packaging, which is projected to drive the mushroom packaging market and the reason behind this is to solve the plastic pollution problem through sustainable-based alternatives.

Why is the USA Considered the Most Attractive Market for the Mushroom Packaging?

The USA mushroom packaging market is anticipated to grow 1.8 times the current market value during the forecast period. Consumers in the USA are more concerned about natural packaging. There are various points that the consumers are focusing on such as low toxicity and biodegradability. Also, the major preference for environment-friendly packaging is creating an incremental opportunity for mushroom packaging. The innovative packaging for different products is generating market share.

The World Packaging Organization supports the global protocol for sustainable packaging. As the carbon footprint caused each year is less as compared to China. In the coming years owing to the increasing demand for cosmetic and personal care packaging in the countries like the USA, this will boost the sales of mushroom packaging.

Get the data you need at a Fraction of the cost

Personalize your report by choosing insights you need
and save 40%!

Competitive Landscape

The key players operating in the mushroom packaging market are trying to focus on increasing their sales and revenues by expanding their capabilities to meet the growing demand. The key players are trying to adopt a merger & acquisition strategy to expand their resources and are developing new products to meet customer needs. In addition, the players are focusing on upgrading their facilities to cater to the demand. Some of the recent key developments by the leading players are as follows -

  • In June 2022, Magical Mushroom Company uses mycelium to replace plastic waste. They found a direct replacement for plant-based packagings such as polystyrene and cardboard. Their efforts would help to reduce the problem of plastic pollution.
  • In May 2022, Ecovative Company turned mushroom mycelium into sustainable material for modern products and provides soil nutrition instead of more pollution.

Scope of the Report

Attribute

Details

Growth Rate

CAGR of 7.2% from 2022 to 2032

Base Year for Estimation

2021

Historical Data

2015 to 2020

Forecast Period

2022 to 2032

Quantitative Units

Revenue in USD Billion, Volume in Units, and CAGR from 2022 to 2032

Report Coverage

Revenue Forecast, Volume Forecast, Company Ranking, Competitive Landscape, Growth Factors, Trends, and Pricing Analysis

Segments Covered

  • Application
  • End Use Industry
  • Region

Regions Covered

  • North America
  • Latin America
  • Europe
  • East Asia
  • South Asia
  • Middle East and Africa
  • Oceania

Key Countries Covered

  • USA
  • Canada
  • Mexico
  • Brazil
  • Germany
  • United Kingdom
  • France
  • Italy
  • Spain
  • Russia
  • China
  • Japan
  • India
  • GCC countries
  • Australia


Key Companies Profiled

Customization & Pricing

Available upon Request

Mushroom Packaging Market by Category

By Application, Mushroom Packaging Market is Segmented as:

  • Cushioning
  • Bracing
  • Void Fill

By End Use Industry, Mushroom Packaging Market is Segmented as:

  • Electronics & Electricals
  • Wine Shippers
  • Cosmetics & Personal Care
  • Homecare
  • Automotive Components

By Region, Mushroom Packaging Market is Segmented as:

  • North America
  • Latin America
  • Europe
  • South Asia
  • East Asia
  • Middle East & Africa
  • Oceania

Frequently Asked Questions

In 2021, the value of the global mushroom packaging market was US$ 55.5 Million.

During the forecast period, the global mushroom packaging market is anticipated to expand at a CAGR of 7.0%.

The global mushroom packaging market is expected to reach US$ 113.4 Million by the end of 2032.

During the forecast period, cushioning is likely to be the fastest-growing application segment in the global mushroom packaging market.

The increasing demand for cosmetics and personal care products is increasing the demand for mushroom packaging.

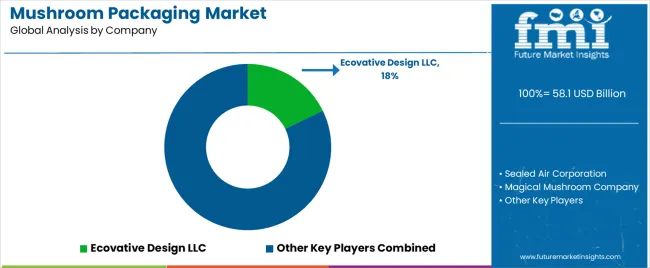
Ecovative Design LLC, Sealed Air Corporation, Magical Mushroom Company, Interpack, Mushroom® Packaging, and Dell Technologies are the top players supplementing the sales of mushroom packaging.

As per the FMI analysis, the German mushroom packaging market is projected to expand at a CAGR of 6.2% from 2022 to 2032.

Table of Content

1. Executive Summary | Mushroom Packaging Market

    1.1. Global Market Outlook

    1.2. Demand-side Trends

    1.3. Supply-side Trends

    1.4. Technology Roadmap Analysis

    1.5. Analysis and Recommendations

2. Market Overview

    2.1. Market Coverage / Taxonomy

    2.2. Market Definition / Scope / Limitations

3. Market Background

    3.1. Market Dynamics

        3.1.1. Drivers

        3.1.2. Restraints

        3.1.3. Opportunity

        3.1.4. Trends

    3.2. Impact of Covid-19

        3.2.1. Demand in Optimistic Scenario

        3.2.2. Demand in Likely Scenario

        3.2.3. Demand in Conservative Scenario

    3.3. Macro Factors and Forecast Factors

    3.4. Value Chain Analysis

        3.4.1. Profit Margin Analysis

        3.4.2. Raw Application Suppliers

        3.4.3. Manufacturers, Wholesalers, and Distributors

        3.4.4. End Users/ Customers

    3.5. Regional Parent Market Outlook

    3.6. Production and Consumption Statistics

    3.7. Global Average Pricing Analysis Benchmark

4. Global Market Analysis 2015 to 2021 and Forecast, 2022 to 2032

    4.1. Historical Market Size Value (US$ Million) & Volume (Units) Analysis, 2015 to 2021

    4.2. Current and Future Market Size Value (US$ Million) & Volume (Units) Projections, 2022 to 2032

        4.2.1. Y-o-Y Growth Trend Analysis

        4.2.2. Absolute $ Opportunity Analysis

5. Global Market Analysis 2015 to 2021 and Forecast 2022 to 2032, By Application

    5.1. Introduction / Key Findings

    5.2. Historical Market Size Value (US$ Million) & Volume (Units) Analysis By Application, 2015 to 2021

    5.3. Current and Future Market Size Value (US$ Million) & Volume (Units) Analysis and Forecast By Application, 2022 to 2032

        5.3.1. Cushioning

        5.3.2. Bracing

        5.3.3. Void Fill

    5.4. Y-o-Y Growth Trend Analysis By Application, 2015 to 2021

    5.5. Absolute $ Opportunity Analysis By Application, 2022 to 2032

6. Global Market Analysis 2015 to 2021 and Forecast 2022 to 2032, By End Use Industry

    6.1. Introduction / Key Findings

    6.2. Historical Market Size Value (US$ Million) & Volume (Units) Analysis By End Use Industry, 2015 to 2021

    6.3. Current and Future Market Size Value (US$ Million) & Volume (Units) Analysis and Forecast By End Use Industry, 2022 to 2032

        6.3.1. Electronics & Electricals

        6.3.2. Wine Shippers

        6.3.3. Cosmetics & Personal Care

        6.3.4. Homecare

        6.3.5. Automotive Components

    6.4. Y-o-Y Growth Trend Analysis By End Use Industry, 2015 to 2021

    6.5. Absolute $ Opportunity Analysis By End Use Industry, 2022 to 2032

7. Global Market Analysis 2015 to 2021 and Forecast 2022 to 2032, by Region

    7.1. Introduction / Key Findings

    7.2. Historical Market Size Value (US$ Million) & Volume (Units) Analysis By Region, 2015 to 2021

    7.3. Current and Future Market Size Value (US$ Million) & Volume (Units) Analysis and Forecast By Region, 2022 to 2032

        7.3.1. North America

        7.3.2. Latin America

        7.3.3. Europe

        7.3.4. East Asia

        7.3.5. South Asia

        7.3.6. Oceania

        7.3.7. Middle East and Africa

    7.4. Market Attractiveness Analysis, by Region

8. North America Market Analysis 2015 to 2021 and Forecast 2022 to 2032

    8.1. Historical Market Size Value (US$ Million) & Volume (Units) Trend Analysis By Market Taxonomy, 2015 to 2021

    8.2. Market Size Value (US$ Million) & Volume (Units) Forecast By Market Taxonomy, 2022 to 2032

        8.2.1. By Country

            8.2.1.1. USA

            8.2.1.2. Canada

        8.2.2. By Application

        8.2.3. By End Use Industry

    8.3. Market Attractiveness Analysis

        8.3.1. By Country

        8.3.2. By Application

        8.3.3. By End Use Industry

    8.4. Key Takeaways

9. Latin America Market Analysis 2015 to 2021 and Forecast 2022 to 2032

    9.1. Historical Market Size Value (US$ Million) & Volume (Units) Trend Analysis By Market Taxonomy, 2015 to 2021

    9.2. Market Size Value (US$ Million) & Volume (Units) Forecast By Market Taxonomy, 2022 to 2032

        9.2.1. By Country

            9.2.1.1. Brazil

            9.2.1.2. Mexico

            9.2.1.3. Argentina

            9.2.1.4. Chile

            9.2.1.5. Peru

            9.2.1.6. Rest of Latin America

        9.2.2. By Application

        9.2.3. By End Use Industry

    9.3. Market Attractiveness Analysis

        9.3.1. By Country

        9.3.2. By Application

        9.3.3. By End Use Industry

    9.4. Key Takeaways

10. Europe Market Analysis 2015 to 2021 and Forecast 2022 to 2032

    10.1. Historical Market Size Value (US$ Million) & Volume (Units) Trend Analysis By Market Taxonomy, 2015 to 2021

    10.2. Market Size Value (US$ Million) & Volume (Units) Forecast By Market Taxonomy, 2022 to 2032

        10.2.1. By Country

            10.2.1.1. Germany

            10.2.1.2. Italy

            10.2.1.3. France

            10.2.1.4. United Kingdom

            10.2.1.5. Spain

            10.2.1.6. BENELUX

            10.2.1.7. Nordic

            10.2.1.8. Russia

            10.2.1.9. Poland

            10.2.1.10. Rest of Europe

        10.2.2. By Application

        10.2.3. By End Use Industry

    10.3. Market Attractiveness Analysis

        10.3.1. By Country

        10.3.2. By Application

        10.3.3. By End Use Industry

    10.4. Key Takeaways

11. East Asia Market Analysis 2015 to 2021 and Forecast 2022 to 2032

    11.1. Historical Market Size Value (US$ Million) & Volume (Units) Trend Analysis By Market Taxonomy, 2015 to 2021

    11.2. Market Size Value (US$ Million) & Volume (Units) Forecast By Market Taxonomy, 2022 to 2032

        11.2.1. By Country

            11.2.1.1. China

            11.2.1.2. Japan

            11.2.1.3. South Korea

        11.2.2. By Application

        11.2.3. By End Use Industry

    11.3. Market Attractiveness Analysis

        11.3.1. By Country

        11.3.2. By Application

        11.3.3. By End Use Industry

    11.4. Key Takeaways

12. South Asia Market Analysis 2015 to 2021 and Forecast 2022 to 2032

    12.1. Historical Market Size Value (US$ Million) & Volume (Units) Trend Analysis By Market Taxonomy, 2015 to 2021

    12.2. Market Size Value (US$ Million) & Volume (Units) Forecast By Market Taxonomy, 2022 to 2032

        12.2.1. By Country

            12.2.1.1. India

            12.2.1.2. Thailand

            12.2.1.3. Malaysia

            12.2.1.4. Indonesia

            12.2.1.5. Rest of South Asia

        12.2.2. By Application

        12.2.3. By End Use Industry

    12.3. Market Attractiveness Analysis

        12.3.1. By Country

        12.3.2. By Application

        12.3.3. By End Use Industry

    12.4. Key Takeaways

13. Oceania Market Analysis 2015 to 2021 and Forecast 2022 to 2032

    13.1. Historical Market Size Value (US$ Million) & Volume (Units) Trend Analysis By Market Taxonomy, 2015 to 2021

    13.2. Market Size Value (US$ Million) & Volume (Units) Forecast By Market Taxonomy, 2022 to 2032

        13.2.1. By Country

            13.2.1.1. Australia

            13.2.1.2. New Zealand

        13.2.2. By Application

        13.2.3. By End Use Industry

    13.3. Market Attractiveness Analysis

        13.3.1. By Country

        13.3.2. By Application

        13.3.3. By End Use Industry

    13.4. Key Takeaways

14. Middle East & Africa Market Analysis 2015 to 2021 and Forecast 2022 to 2032

    14.1. Historical Market Size Value (US$ Million) & Volume (Units) Trend Analysis By Market Taxonomy, 2015 to 2021

    14.2. Market Size Value (US$ Million) & Volume (Units) Forecast By Market Taxonomy, 2022 to 2032

        14.2.1. By Country

            14.2.1.1. GCC Countries

            14.2.1.2. Turkey

            14.2.1.3. Northern Africa

            14.2.1.4. South Africa

            14.2.1.5. Rest of Middle East and Africa

        14.2.2. By Application

        14.2.3. By End Use Industry

    14.3. Market Attractiveness Analysis

        14.3.1. By Country

        14.3.2. By Application

        14.3.3. By End Use Industry

    14.4. Key Takeaways

15. Country-wise Market Analysis

    15.1. USA

        15.1.1. Market Share Analysis, 2022

        15.1.2. By Application

        15.1.3. By End Use Industry

    15.2. Canada

        15.2.1. Market Share Analysis, 2022

        15.2.2. By Application

        15.2.3. By End Use Industry

    15.3. Brazil

        15.3.1. Market Share Analysis, 2022

        15.3.2. By Application

        15.3.3. By End Use Industry

    15.4. Mexico

        15.4.1. Market Share Analysis, 2022

        15.4.2. By Application

        15.4.3. By End Use Industry

    15.5. Germany

        15.5.1. Market Share Analysis, 2022

        15.5.2. By Application

        15.5.3. By End Use Industry

    15.6. Italy

        15.6.1. Market Share Analysis, 2022

        15.6.2. By Application

        15.6.3. By End Use Industry

    15.7. France

        15.7.1. Market Share Analysis, 2022

        15.7.2. By Application

        15.7.3. By End Use Industry

    15.8. Spain

        15.8.1. Market Share Analysis, 2022

        15.8.2. By Application

        15.8.3. By End Use Industry

    15.9. United Kingdom

        15.9.1. Market Share Analysis, 2022

        15.9.2. By Application

        15.9.3. By End Use Industry

    15.10. Russia

        15.10.1. Market Share Analysis, 2022

        15.10.2. By Application

        15.10.3. By End Use Industry

    15.11. China

        15.11.1. Market Share Analysis, 2022

        15.11.2. By Application

        15.11.3. By End Use Industry

    15.12. Japan

        15.12.1. Market Share Analysis, 2022

        15.12.2. By Application

        15.12.3. By End Use Industry

    15.13. India

        15.13.1. Market Share Analysis, 2022

        15.13.2. By Application

        15.13.3. By End Use Industry

    15.14. GCC Countries

        15.14.1. Market Share Analysis, 2022

        15.14.2. By Application

        15.14.3. By End Use Industry

    15.15. Australia

        15.15.1. Market Share Analysis, 2022

        15.15.2. By Application

        15.15.3. By End Use Industry

16. Market Structure Analysis

    16.1. Competition Dashboard

    16.2. Competition Benchmarking

    16.3. Market Share Analysis of Top Players

        16.3.1. By Region

        16.3.2. By Product Portfolio

17. Competition Analysis

    17.1. Competition Deep Dive

        17.1.1. Ecovative Design LLC

            17.1.1.1. Overview

            17.1.1.2. Product Portfolio

            17.1.1.3. Profitability by Market Segments (Product/Channel/Region)

            17.1.1.4. Sales Footprint

            17.1.1.5. Strategy Overview

                17.1.1.5.1. Marketing Strategy

                17.1.1.5.2. Product Strategy

                17.1.1.5.3. Channel Strategy

        17.1.2. Sealed Air Corporation

            17.1.2.1. Overview

            17.1.2.2. Product Portfolio

            17.1.2.3. Profitability by Market Segments (Product/Channel/Region)

            17.1.2.4. Sales Footprint

            17.1.2.5. Strategy Overview

                17.1.2.5.1. Marketing Strategy

                17.1.2.5.2. Product Strategy

                17.1.2.5.3. Channel Strategy

        17.1.3. Magical Mushroom Company

            17.1.3.1. Overview

            17.1.3.2. Product Portfolio

            17.1.3.3. Profitability by Market Segments (Product/Channel/Region)

            17.1.3.4. Sales Footprint

            17.1.3.5. Strategy Overview

                17.1.3.5.1. Marketing Strategy

                17.1.3.5.2. Product Strategy

                17.1.3.5.3. Channel Strategy

        17.1.4. Interpack

            17.1.4.1. Overview

            17.1.4.2. Product Portfolio

            17.1.4.3. Profitability by Market Segments (Product/Channel/Region)

            17.1.4.4. Sales Footprint

            17.1.4.5. Strategy Overview

                17.1.4.5.1. Marketing Strategy

                17.1.4.5.2. Product Strategy

                17.1.4.5.3. Channel Strategy

        17.1.5. Mushroom® Packaging

            17.1.5.1. Overview

            17.1.5.2. Product Portfolio

            17.1.5.3. Profitability by Market Segments (Product/Channel/Region)

            17.1.5.4. Sales Footprint

            17.1.5.5. Strategy Overview

                17.1.5.5.1. Marketing Strategy

                17.1.5.5.2. Product Strategy

                17.1.5.5.3. Channel Strategy

        17.1.6. Dell Technologies

            17.1.6.1. Overview

            17.1.6.2. Product Portfolio

            17.1.6.3. Profitability by Market Segments (Product/Channel/Region)

            17.1.6.4. Sales Footprint

            17.1.6.5. Strategy Overview

                17.1.6.5.1. Marketing Strategy

                17.1.6.5.2. Product Strategy

                17.1.6.5.3. Channel Strategy

        17.1.7. Costa Group

            17.1.7.1. Overview

            17.1.7.2. Product Portfolio

            17.1.7.3. Profitability by Market Segments (Product/Channel/Region)

            17.1.7.4. Sales Footprint

            17.1.7.5. Strategy Overview

                17.1.7.5.1. Marketing Strategy

                17.1.7.5.2. Product Strategy

                17.1.7.5.3. Channel Strategy

        17.1.8. CMP Mushroom

            17.1.8.1. Overview

            17.1.8.2. Product Portfolio

            17.1.8.3. Profitability by Market Segments (Product/Channel/Region)

            17.1.8.4. Sales Footprint

            17.1.8.5. Strategy Overview

                17.1.8.5.1. Marketing Strategy

                17.1.8.5.2. Product Strategy

                17.1.8.5.3. Channel Strategy

        17.1.9. Shroom Labs

            17.1.9.1. Overview

            17.1.9.2. Product Portfolio

            17.1.9.3. Profitability by Market Segments (Product/Channel/Region)

            17.1.9.4. Sales Footprint

            17.1.9.5. Strategy Overview

                17.1.9.5.1. Marketing Strategy

                17.1.9.5.2. Product Strategy

                17.1.9.5.3. Channel Strategy

        17.1.10. MANNOK

            17.1.10.1. Overview

            17.1.10.2. Product Portfolio

            17.1.10.3. Profitability by Market Segments (Product/Channel/Region)

            17.1.10.4. Sales Footprint

            17.1.10.5. Strategy Overview

                17.1.10.5.1. Marketing Strategy

                17.1.10.5.2. Product Strategy

                17.1.10.5.3. Channel Strategy

        17.1.11. Steelcase

            17.1.11.1. Overview

            17.1.11.2. Product Portfolio

            17.1.11.3. Profitability by Market Segments (Product/Channel/Region)

            17.1.11.4. Sales Footprint

            17.1.11.5. Strategy Overview

                17.1.11.5.1. Marketing Strategy

                17.1.11.5.2. Product Strategy

                17.1.11.5.3. Channel Strategy

        17.1.12. Poly Tech

            17.1.12.1. Overview

            17.1.12.2. Product Portfolio

            17.1.12.3. Profitability by Market Segments (Product/Channel/Region)

            17.1.12.4. Sales Footprint

            17.1.12.5. Strategy Overview

                17.1.12.5.1. Marketing Strategy

                17.1.12.5.2. Product Strategy

                17.1.12.5.3. Channel Strategy

        17.1.13. Thermo Packer

            17.1.13.1. Overview

            17.1.13.2. Product Portfolio

            17.1.13.3. Profitability by Market Segments (Product/Channel/Region)

            17.1.13.4. Sales Footprint

            17.1.13.5. Strategy Overview

                17.1.13.5.1. Marketing Strategy

                17.1.13.5.2. Product Strategy

                17.1.13.5.3. Channel Strategy

        17.1.14. Paradise Packaging Company

            17.1.14.1. Overview

            17.1.14.2. Product Portfolio

            17.1.14.3. Profitability by Market Segments (Product/Channel/Region)

            17.1.14.4. Sales Footprint

            17.1.14.5. Strategy Overview

                17.1.14.5.1. Marketing Strategy

                17.1.14.5.2. Product Strategy

                17.1.14.5.3. Channel Strategy

        17.1.15. UNO PLAST

            17.1.15.1. Overview

            17.1.15.2. Product Portfolio

            17.1.15.3. Profitability by Market Segments (Product/Channel/Region)

            17.1.15.4. Sales Footprint

            17.1.15.5. Strategy Overview

                17.1.15.5.1. Marketing Strategy

                17.1.15.5.2. Product Strategy

                17.1.15.5.3. Channel Strategy

18. Assumptions and Acronyms Used

19. Research Methodology

Don't pay for what you don't need

Customize your report by selecting specific countries or regions and save 30%!

List of Tables

Table 01: Global Market Value (US$ Million) Forecast by Region, 2015 to 2032

Table 02: Global Market Volume (Units) Forecast by Region, 2015 to 2032

Table 03: Global Market Value (US$ Million) Forecast by Application, 2015 to 2032

Table 04: Global Market Volume (Units) Forecast by Application, 2015 to 2032

Table 05: Global Market Value (US$ Million) Forecast by End-Use Industry, 2015 to 2032

Table 06: Global Market Volume (Units) Forecast by End-Use Industry, 2015 to 2032

Table 09: North America Market Value (US$ Million) Forecast by Country, 2015 to 2032

Table 10: North America Market Volume (Units) Forecast by Country, 2015 to 2032

Table 11: North America Market Value (US$ Million) Forecast by Application, 2015 to 2032

Table 12: North America Market Volume (Units) Forecast by Application, 2015 to 2032

Table 13: North America Market Value (US$ Million) Forecast by End-Use Industry, 2015 to 2032

Table 14: North America Market Volume (Units) Forecast by End-Use Industry, 2015 to 2032

Table 15: Latin America Market Value (US$ Million) Forecast by Country, 2015 to 2032

Table 16: Latin America Market Volume (Units) Forecast by Country, 2015 to 2032

Table 17: Latin America Market Value (US$ Million) Forecast by Application, 2015 to 2032

Table 18: Latin America Market Volume (Units) Forecast by Application, 2015 to 2032

Table 19: Latin America Market Value (US$ Million) Forecast by End-Use Industry, 2015 to 2032

Table 20: Latin America Market Volume (Units) Forecast by End-Use Industry, 2015 to 2032

Table 21: Europe Market Value (US$ Million) Forecast by Country, 2015 to 2032

Table 22: Europe Market Volume (Units) Forecast by Country, 2015 to 2032

Table 23: Europe Market Value (US$ Million) Forecast by Application, 2015 to 2032

Table 24: Europe Market Volume (Units) Forecast by Application, 2015 to 2032

Table 25: Europe Market Value (US$ Million) Forecast by End-Use Industry, 2015 to 2032

Table 26: Europe Market Volume (Units) Forecast by End-Use Industry, 2015 to 2032

Table 27: East Asia Market Value (US$ Million) Forecast by Country, 2015 to 2032

Table 28: East Asia Market Volume (Units) Forecast by Country, 2015 to 2032

Table 29: East Asia Market Value (US$ Million) Forecast by Application, 2015 to 2032

Table 30: East Asia Market Volume (Units) Forecast by Application, 2015 to 2032

Table 31: East Asia Market Value (US$ Million) Forecast by End-Use Industry, 2015 to 2032

Table 32: East Asia Market Volume (Units) Forecast by End-Use Industry, 2015 to 2032

Table 33: South Asia Market Value (US$ Million) Forecast by Country, 2015 to 2032

Table 34: South Asia Market Volume (Units) Forecast by Country, 2015 to 2032

Table 35: South Asia Market Value (US$ Million) Forecast by Application, 2015 to 2032

Table 36: South Asia Market Volume (Units) Forecast by Application, 2015 to 2032

Table 37: South Asia Market Value (US$ Million) Forecast by End-Use Industry, 2015 to 2032

Table 38: South Asia Market Volume (Units) Forecast by End-Use Industry, 2015 to 2032

Table 39: Oceania Market Value (US$ Million) Forecast by Country, 2015 to 2032

Table 40: Oceania Market Volume (Units) Forecast by Country, 2015 to 2032

Table 41: Oceania Market Value (US$ Million) Forecast by Application, 2015 to 2032

Table 42: Oceania Market Volume (Units) Forecast by Application, 2015 to 2032

Table 43: Oceania Market Value (US$ Million) Forecast by End-Use Industry, 2015 to 2032

Table 44: Oceania Market Volume (Units) Forecast by End-Use Industry, 2015 to 2032

Table 45: Middle East and Africa Market Value (US$ Million) Forecast by Country, 2015 to 2032

Table 46: Middle East and Africa Market Volume (Units) Forecast by Country, 2015 to 2032

Table 47: Middle East and Africa Market Value (US$ Million) Forecast by Application, 2015 to 2032

Table 48: Middle East and Africa Market Volume (Units) Forecast by Application, 2015 to 2032

Table 49: Middle East and Africa Market Value (US$ Million) Forecast by End-Use Industry, 2015 to 2032

Table 50: Middle East and Africa Market Volume (Units) Forecast by End-Use Industry, 2015 to 2032

Table 51: USA Market Value (US$ Million) Forecast by Application, End-Use Industry (2022(E) & 2032(F))

Table 52: Brazil Market Value (US$ Million) Forecast by Application, End-Use Industry (2022(E) & 2032(F))

Table 53: Mexico Market Value (US$ Million) Forecast by Application, End-Use Industry (2022(E) & 2032(F))

Table 54: Germany Market Value (US$ Million) Forecast by Application, End-Use Industry (2022(E) & 2032(F))

Table 55: Italy Market Value (US$ Million) Forecast by Application, End-Use Industry (2022(E) & 2032(F))

Table 56: France Market Value (US$ Million) Forecast by Application, End-Use Industry (2022(E) & 2032(F))

Table 57: Spain Market Value (US$ Million) Forecast by Application, End-Use Industry (2022(E) & 2032(F))

Table 58: United Kingdom Market Value (US$ Million) Forecast by Application, End-Use Industry (2022(E) & 2032(F))

Table 59: China Market Value (US$ Million) Forecast by Application, End-Use Industry (2022(E) & 2032(F))

Table 60: Japan Market Value (US$ Million) Forecast by Application, End-Use Industry (2022(E) & 2032(F))

Table 61: India Market Value (US$ Million) Forecast by Application, End-Use Industry (2022(E) & 2032(F))

Table 62: Australia Market Value (US$ Million) Forecast by Application, End-Use Industry (2022(E) & 2032(F))
Ismail Sutaria
Ismail Sutaria
Principal Consultant
LinkedIn
Talk to Analyst

Find your sweet spots for generating winning opportunities in this market.

Talk to Analyst

List of Charts

Figure 01: Global Market Value (US$ Million) by Application, 2022 to 2032

Figure 02: Global Market Value (US$ Million) by End-Use Industry, 2022 to 2032

Figure 03: Global Market Value (US$ Million) by End-Use, 2022 to 2032

Figure 04: Global Market Value (US$ Million) by Region, 2022 to 2032

Figure 05: Global Market Value (US$ Million) Analysis by Region, 2015 to 2021

Figure 06: Global Market Volume (Units) Analysis by Region, 2015 to 2032

Figure 07: Global Market Value Share (%) and BPS Analysis by Region, 2022 & 2032

Figure 08: Global Market Y-o-Y Growth (%) Projections by Region, 2022 to 2032

Figure 09: Global Market Value (US$ Million) Analysis by Application, 2015 to 2021

Figure 10: Global Market Volume (Units) Analysis by Application, 2015 to 2032

Figure 11: Global Market Value Share (%) and BPS Analysis by Application, 2022 & 2032

Figure 12: Global Market Y-o-Y Growth (%) Projections by Application, 2022 to 2032

Figure 13: Global Market Value (US$ Million) Analysis by End-Use Industry, 2015 to 2021

Figure 14: Global Market Volume (Units) Analysis by End-Use Industry, 2015 to 2032

Figure 15: Global Market Value Share (%) and BPS Analysis by End-Use Industry, 2022 & 2032

Figure 16: Global Market Y-o-Y Growth (%) Projections by End-Use Industry, 2022 to 2032

Figure 17: Global Market Value (US$ Million) Analysis by End-Use, 2015 to 2021

Figure 18: Global Market Volume (Units) Analysis by End-Use, 2015 to 2032

Figure 19: Global Market Value Share (%) and BPS Analysis by End-Use, 2022 & 2032

Figure 20: Global Market Attractiveness by Application, 2022 to 2032

Figure 21: Global Market Attractiveness by End-Use Industry, 2022 to 2032

Figure 22: Global Market Attractiveness by Region, 2022 to 2032

Figure 23: North America Market Value (US$ Million) by Application, 2022 to 2032

Figure 24: North America Market Value (US$ Million) by End-Use Industry, 2022 to 2032

Figure 25: North America Market Value (US$ Million) by Country, 2022 to 2032

Figure 26: North America Market Value (US$ Million) Analysis by Country, 2015 to 2021

Figure 27: North America Market Volume (Units) Analysis by Country, 2015 to 2032

Figure 28: North America Market Value Share (%) and BPS Analysis by Country, 2022 & 2032

Figure 29: North America Market Y-o-Y Growth (%) Projections by Country, 2022 to 2032

Figure 30: North America Market Value (US$ Million) Analysis by Application, 2015 to 2021

Figure 31: North America Market Volume (Units) Analysis by Application, 2015 to 2032

Figure 32: North America Market Value Share (%) and BPS Analysis by Application, 2022 & 2032

Figure 33: North America Market Y-o-Y Growth (%) Projections by Application, 2022 to 2032

Figure 34: North America Market Value (US$ Million) Analysis by End-Use Industry, 2015 to 2021

Figure 35: North America Market Volume (Units) Analysis by End-Use Industry, 2015 to 2032

Figure 36: North America Market Attractiveness by Application, 2022 to 2032

Figure 37: North America Market Attractiveness by End-Use Industry, 2022 to 2032

Figure 38: North America Market Attractiveness by Country, 2022 to 2032

Figure 39: Latin America Market Value (US$ Million) by Application, 2022 & 2032

Figure 40: Latin America Market Value (US$ Million) by End-Use Industry, 2022 to 2032

Figure 41: Latin America Market Value (US$ Million) by Country, 2022 to 2032

Figure 42: Latin America Market Value (US$ Million) Analysis by Country, 2015 to 2021

Figure 43: Latin America Market Volume (Units) Analysis by Country, 2015 to 2032

Figure 44: Latin America Market Value Share (%) and BPS Analysis by Country, 2022 & 2032

Figure 45: Latin America Market Y-o-Y Growth (%) Projections by Country, 2022 to 2032

Figure 46: Latin America Market Value (US$ Million) Analysis by Application, 2015 to 2021

Figure 47: Latin America Market Volume (Units) Analysis by Application, 2015 to 2032

Figure 48: Latin America Market Value Share (%) and BPS Analysis by Application, 2022 & 2032

Figure 49: Latin America Market Y-o-Y Growth (%) Projections by Application, 2022 to 2032

Figure 50: Latin America Market Value (US$ Million) Analysis by End-Use Industry, 2015 to 2021

Figure 51: Latin America Market Volume (Units) Analysis by End-Use Industry, 2015 to 2032

Figure 52: Latin America Market Value Share (%) and BPS Analysis by End-Use Industry, 2022 & 2032

Figure 53: Latin America Market Y-o-Y Growth (%) Projections by End-Use Industry, 2022 to 2032

Figure 54: Latin America Market Attractiveness by Application, 2022 to 2032

Figure 55: Latin America Market Attractiveness by End-Use Industry, 2022 to 2032

Figure 56: Latin America Market Attractiveness by Country, 2022 to 2032

Figure 57: Europe Market Value (US$ Million) by Application, 2022 to 2032

Figure 58: Europe Market Value (US$ Million) by End-Use Industry, 2022 to 2032

Figure 59: Europe Market Value (US$ Million) by Country, 2022 to 2032

Figure 60: Europe Market Value (US$ Million) Analysis by Country, 2015 to 2021

Figure 61: Europe Market Volume (Units) Analysis by Country, 2015 to 2032

Figure 62: Europe Market Value Share (%) and BPS Analysis by Country, 2022 & 2032

Figure 63: Europe Market Y-o-Y Growth (%) Projections by Country, 2022 to 2032

Figure 64: Europe Market Value (US$ Million) Analysis by Application, 2015 to 2021

Figure 65: Europe Market Volume (Units) Analysis by Application, 2015 to 2032

Figure 66: Europe Market Value Share (%) and BPS Analysis by Application, 2022 & 2032

Figure 67: Europe Market Y-o-Y Growth (%) Projections by Application, 2022 to 2032

Figure 68: Europe Market Value (US$ Million) Analysis by End-Use Industry, 2015 to 2021

Figure 69: Europe Market Volume (Units) Analysis by End-Use Industry, 2015 to 2032

Figure 70: Europe Market Value Share (%) and BPS Analysis by End-Use Industry, 2022 & 2032

Figure 71: Europe Market Y-o-Y Growth (%) Projections by End-Use Industry, 2022 to 2032

Figure 72: Europe Market Attractiveness by Application, 2022 to 2032

Figure 73: Europe Market Attractiveness by End-Use Industry, 2022 to 2032

Figure 74: Europe Market Attractiveness by Country, 2022 to 2032

Figure 75: East Asia Market Value (US$ Million) by Application, 2022 to 2032

Figure 76: East Asia Market Value (US$ Million) by End-Use Industry, 2022 to 2032

Figure 77: East Asia Market Value (US$ Million) by Country, 2022 to 2032

Figure 78: East Asia Market Value (US$ Million) Analysis by Country, 2015 to 2021

Figure 79: East Asia Market Volume (Units) Analysis by Country, 2015 to 2032

Figure 80: East Asia Market Value Share (%) and BPS Analysis by Country, 2022 & 2032

Figure 81: East Asia Market Y-o-Y Growth (%) Projections by Country, 2022 to 2032

Figure 82: East Asia Market Value (US$ Million) Analysis by Application, 2015 to 2021

Figure 83: East Asia Market Volume (Units) Analysis by Application, 2015 to 2032

Figure 84: East Asia Market Value Share (%) and BPS Analysis by Application, 2022 & 2032

Figure 85: East Asia Market Y-o-Y Growth (%) Projections by Application, 2022 to 2032

Figure 86: East Asia Market Value (US$ Million) Analysis by End-Use Industry, 2015 to 2021

Figure 87: East Asia Market Volume (Units) Analysis by End-Use Industry, 2015 to 2032

Figure 88: East Asia Market Value Share (%) and BPS Analysis by End-Use Industry, 2022 & 2032

Figure 89: East Asia Market Y-o-Y Growth (%) Projections by End-Use Industry, 2022 to 2032

Figure 90: East Asia Market Attractiveness by Application, 2022 to 2032

Figure 91: East Asia Market Attractiveness by End-Use Industry, 2022 to 2032

Figure 92: East Asia Market Attractiveness by End-Use, 2022 to 2032

Figure 93: East Asia Market Attractiveness by Country, 2022 to 2032

Figure 94: South Asia Market Value (US$ Million) by Application, 2022 to 2032

Figure 95: South Asia Market Value (US$ Million) by End-Use Industry, 2022 to 2032Figure 96: South Asia Market Value (US$ Million) by Country, 2022 to 2032

Figure 97: South Asia Market Value (US$ Million) Analysis by Country, 2015 to 2021

Figure 98: South Asia Market Volume (Units) Analysis by Country, 2015 to 2032

Figure 99: South Asia Market Value Share (%) and BPS Analysis by Country, 2022 & 2032

Figure 100: South Asia Market Y-o-Y Growth (%) Projections by Country, 2022 to 2032

Figure 101: South Asia Market Value (US$ Million) Analysis by Application, 2015 to 2021

Figure 102: South Asia Market Volume (Units) Analysis by Application, 2015 to 2032

Figure 103: South Asia Market Value Share (%) and BPS Analysis by Application, 2022 & 2032

Figure 104: South Asia Market Y-o-Y Growth (%) Projections by Application, 2022 to 2032

Figure 105: South Asia Market Value (US$ Million) Analysis by End-Use Industry, 2015 to 2021

Figure 106: South Asia Market Volume (Units) Analysis by End-Use Industry, 2015 to 2032

Figure 107: South Asia Market Value Share (%) and BPS Analysis by End-Use Industry, 2022 & 2032

Figure 108: South Asia Market Y-o-Y Growth (%) Projections by End-Use Industry, 2022 to 2032

Figure 109: South Asia Market Attractiveness by Application, 2022 to 2032

Figure 110: South Asia Market Attractiveness by End-Use Industry, 2022 to 2032

Figure 111: South Asia Market Attractiveness by Country, 2022 to 2032

Figure 112: Oceania Market Value (US$ Million) by Application, 2022 to 2032

Figure 113: Oceania Market Value (US$ Million) by End-Use Industry, 2022 to 2032

Figure 114: Oceania Market Value (US$ Million) by Country, 2022 to 2032

Figure 115: Oceania Market Value (US$ Million) Analysis by Country, 2015 to 2021

Figure 116: Oceania Market Volume (Units) Analysis by Country, 2015 to 2032

Figure 117: Oceania Market Value Share (%) and BPS Analysis by Country, 2022 & 2032

Figure 118: Oceania Market Y-o-Y Growth (%) Projections by Country, 2022 to 2032

Figure 119: Oceania Market Value (US$ Million) Analysis by Application, 2015 to 2021

Figure 120: Oceania Market Volume (Units) Analysis by Application, 2015 to 2032

Figure 121: Oceania Market Value Share (%) and BPS Analysis by Application, 2022 & 2032

Figure 122: Oceania Market Y-o-Y Growth (%) Projections by Application, 2022 to 2032

Figure 123: Oceania Market Value (US$ Million) Analysis by End-Use Industry, 2015 to 2021

Figure 124: Oceania Market Volume (Units) Analysis by End-Use Industry, 2015 to 2032

Figure 125: Oceania Market Value Share (%) and BPS Analysis by End-Use Industry, 2022 & 2032

Figure 126: Oceania Market Y-o-Y Growth (%) Projections by End-Use Industry, 2022 to 2032

Figure 127: Oceania Market Attractiveness by Application, 2022 to 2032

Figure 128: Oceania Market Attractiveness by End-Use Industry, 2022 to 2032

Figure 129 Oceania Market Attractiveness by Country, 2022 to 2032

Figure 130: Middle East and Africa Market Value (US$ Million) by Application, 2022 to 2032

Figure 131: Middle East and Africa Market Value (US$ Million) by End-Use Industry, 2022 to 2032

Figure 132: Middle East and Africa Market Value (US$ Million) by Country, 2022 to 2032

Figure 133: Middle East and Africa Market Value (US$ Million) Analysis by Country, 2015 to 2021

Figure 134: Middle East and Africa Market Volume (Units) Analysis by Country, 2015 to 2032

Figure 135: Middle East and Africa Market Value Share (%) and BPS Analysis by Country, 2022 & 2032

Figure 136: Middle East and Africa Market Y-o-Y Growth (%) Projections by Country, 2022 to 2032

Figure 137: Middle East and Africa Market Value (US$ Million) Analysis by Application, 2015 to 2021

Figure 138: Middle East and Africa Market Volume (Units) Analysis by Application, 2015 to 2032

Figure 139: Middle East and Africa Market Value Share (%) and BPS Analysis by Application, 2022 & 2032

Figure 140: Middle East and Africa Market Y-o-Y Growth (%) Projections by Application, 2022 to 2032

Figure 141: Middle East and Africa Market Value (US$ Million) Analysis by End-Use Industry, 2015 to 2021

Figure 142: Middle East and Africa Market Volume (Units) Analysis by End-Use Industry, 2015 to 2032

Figure 143: Middle East and Africa Market Value Share (%) and BPS Analysis by End-Use Industry, 2022 & 2032

Figure 144: Middle East and Africa Market Y-o-Y Growth (%) Projections by End-Use Industry, 2022 to 2032

Figure 145: Middle East and Africa Market Attractiveness by Application, 2022 to 2032

Figure 146: Middle East and Africa Market Attractiveness by End-Use Industry, 2022 to 2032

Figure 147 Middle East and Africa Market Attractiveness by Country, 2022 to 2032

Recommendations

Packaging

Molded Fiber Pulp Packaging Market

Published : March 2023

Packaging

Bagasse Tableware Products Market

Published : December 2022

Packaging

Biodegradable Packaging Market

Published : September 2022

Packaging

Zero-waste Packaging Market

Published : August 2022

Explore Packaging Insights

View Reports
Google translate

Mushroom Packaging Market