
- Market Size (2026)
- USD 615.0 Mn
- Forecast (2036)
- USD 826.5 Mn
- CAGR (2026 to 2036)
- 3.0%
How big is the Nepheline Syenite Market in 2026?
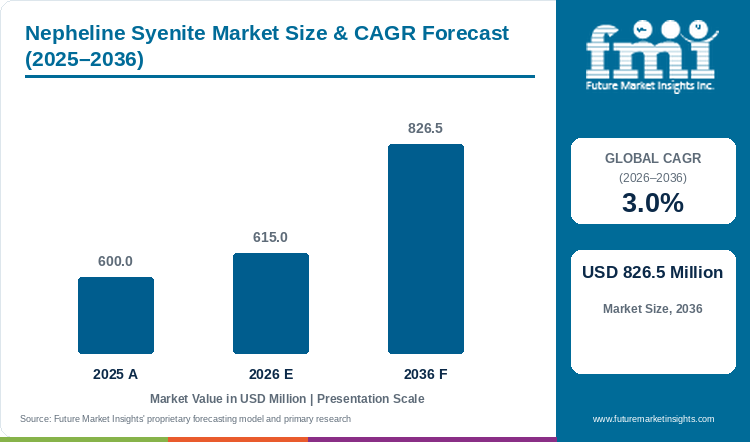
FMI projects the global nepheline syenite market at USD 826.5 million in 2036, a 3.0% CAGR over 2026 to 2036. The market was valued at USD 600.0 million in 2025 and is estimated at USD 615.0 million in 2026.
Nepheline Syenite Market Size and Forecast
Table 1: Nepheline Syenite Market Size and Forecast
| Market size and forecast | Value |
|---|---|
| Market size in 2025 | USD 600.0 million |
| Estimated market size in 2026 | USD 615.0 million |
| Projected market size by 2036 | USD 826.5 million |
| CAGR from 2026 to 2036 | 3.0% |
Source: Future Market Insights analysis of the nepheline syenite market, 2026.
Import dependence and furnace economics explain this market. The U.S. Geological Survey reports that U.S. nepheline syenite imports declined to an estimated 420.0 thousand tonnes in 2025, while their average unit value increased to USD 220.0 per tonne. The divergence shows why higher mineral revenue need not indicate stronger physical consumption. Sibelco describes its Norwegian product as a low-iron flux that accelerates melting and supplies alumina. A glassmaker evaluates that contribution against the complete batch, including available cullet and the cost of competing feldspar.
Supply continuity is especially relevant when a mineral comes from a limited number of commercial deposits. On 7 May 2026, Norway's energy regulator granted Sibelco permission for a replacement subsea power connection serving Stjernøy. The authorization addresses ageing electrical infrastructure at an established source. FMI therefore expects moderate bulk-volume expansion alongside stronger development of milled filler grades. The latter business rewards repeatable particle size and application testing, while glass customers remain exposed to furnace operating rates and recycled-glass substitution.
Key Market Trends & Insights
- Recycled glass competes directly with virgin batch minerals. USGS identifies cullet use as a factor reducing feldspar and nepheline syenite consumption. Mineral purchasing therefore depends on the recycled content of the batch as well as the quantity of glass produced.
- Coatings demand is specified by particle grade. Covia offers different MINEX grades for gloss control, powder coatings and clear systems. The commercial opportunity in coatings is tied to an approved finish and dispersion result, which makes the fine-grade mix a better indicator than total milled tonnes.
- Weak glass output limits immediate flux orders. German glass production tonnage fell 0.9% in 2025, according to BV Glas, even where producers continue to invest in more efficient melting.
Regional Highlights
- India, China and Turkey widen their share of global revenue. The 2036 outlook has India at 7.7% against 6.0% in 2026, China at 13.3% against 12.0% in 2026 and Turkey at 7.4% against 7.0% in 2026.
- The United States, Germany and Italy still add revenue but lose share of the global total. FMI projects the United States from 20.0% to 18.3%, Germany from 8.0% to 7.3% and Italy from 8.0% to 7.3% over the same period.
Analyst Perspective
“Nepheline syenite suppliers face two different earnings tests. Glass customers judge the mineral within a furnace batch and a delivered freight bill. Coating formulators judge a particular milled grade within the finished film. The strongest commercial position combines dependable mineral supply with evidence that the selected grade performs consistently in its intended application. A broad claim about energy savings cannot replace a customer's melt trial, and a low bulk price does not establish the economics of an ultrafine filler.”
- Nikhil Kaitwade, Principal Consultant, FMI
How is the Nepheline Syenite Market segmented?
- By grade: Glass Grade, Ceramic Grade, and Filler Grade.
- By end use: Glass, Ceramics and Tiles, Paints and Coatings, Plastics and Rubber, and Other.
- By sales route: Direct Contract Supply and Distributor and Trader Supply.
- By region: North America, Latin America, Western Europe, Eastern Europe, East Asia, South Asia and Pacific, and Middle East and Africa.
Why does the Glass Grade segment lead by Grade in the Nepheline Syenite Market in 2026?
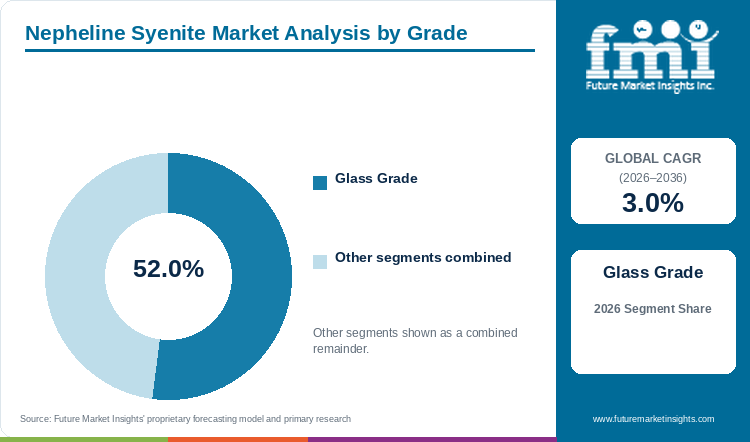
The Glass Grade segment holds 52.0% of the Nepheline Syenite Market by grade in 2026.
Glass Grade leads because it supplies an established, high-volume outlet for the mineral's alumina and alkali content. Its value depends on keeping unwanted colour and unmelted inclusions out of a customer's furnace. One producer identifies low iron and stable chemistry in its glass application description. Those characteristics connect a deposit's mineralogy to the saleable glass produced, giving consistency commercial weight alongside the delivered tonne price.
The grade also competes with feldspar and recycled glass. A lower-priced substitute is commercially relevant only after the manufacturer assesses the altered batch and the resulting glass quality. That comparison is central to the glass container market, where recurring furnace production and recycled content affect raw-material intake.
FMI estimates Glass Grade at 49.2% by 2036, with revenue reaching USD 406.8 million. Its share declines while its value grows, because Filler Grade expands faster from a smaller base. Mineral processors serving both outlets need different specifications and separate commercial discussions for each grade.
Ceramic Grade and Filler Grade together hold the remaining 48.0% by grade.
Table 2: Grade, 2026 Share
| Leading Share | 2026 market share |
|---|---|
| Glass Grade | 52.0% |
| All Other Segments Combined Share | 48.0% |
Source: Future Market Insights analysis of the nepheline syenite market, 2026.
Why does the Glass segment lead by End Use in the Nepheline Syenite Market in 2026?
The Glass segment holds 52.0% of the Nepheline Syenite Market by end use in 2026.
Glass demand is anchored in repeated batch preparation, with purchasing quantities linked to actual furnace activity. The customer relationship therefore lasts beyond the original construction project that created the furnace. Şişecam reported completing its Tarsus flat-glass investment with annual capacity of 432.0 thousand tonnes in its March 2026 shareholder update.
Glass nevertheless contains several markets with different product requirements. Clear packaging, flat glass and glass fibre do not share one interchangeable batch. Colour tolerances and the available recycled material determine which mineral specification remains suitable. China's official 2025 plate-glass output fell 3.0%, showing that a large installed industry does not guarantee rising annual flux intake.
The end-use outlook therefore separates continued mineral supply to existing customers from new formulation wins. Glass retains 49.7% of end-use revenue in 2036. Paints and Coatings reaches 8.8%, while Plastics and Rubber reaches 7.3%. These smaller outlets broaden revenue without removing the market's exposure to glass production. Flat glass, one of the glass products served, is covered separately in FMI's flat glass market.
Ceramics and Tiles, Paints and Coatings, Plastics and Rubber and Other together account for the remaining 48.0% by end use.
Table 3: End Use, 2026 Share
| Leading Share | 2026 market share |
|---|---|
| Glass | 52.0% |
| All Other Segments Combined Share | 48.0% |
Source: Future Market Insights analysis of the nepheline syenite market, 2026.
Why does the Direct Contract Supply segment lead by Sales Route in the Nepheline Syenite Market in 2026?
The Direct Contract Supply segment holds 62.0% of the Nepheline Syenite Market by sales route in 2026.
Direct contract supply leads because glass and ceramic plants buy nepheline syenite in repeated batch quantities against a fixed specification. The bulk mineral moves under arrangements that fix grade, delivery frequency and quality tolerances, which suits direct dealing between producer and plant. USGS identifies cullet use as a factor reducing feldspar and nepheline syenite consumption, so a producer must keep the batch economics attractive to retain such contracts.
Distributors and traders serve a different buyer. Finer filler grades sold to coating and polymer formulators, and smaller ceramic works, need shorter lead times and smaller lots than a glass furnace. These buyers value local availability and mixed deliveries more than a tonnage price. The channel therefore carries a larger share of the finer grades, while direct supply carries the bulk glass flow.
FMI's 2026 assessment values Direct Contract Supply at USD 381.3 million. The balance may shift if filler demand grows faster than glass, because that business depends more on intermediaries. Producers should keep the two routes separate in pricing, since a distributor margin is not comparable with a furnace-side contract.
Distributor and Trader Supply together hold the remaining 38.0% by sales route.
Table 4: Sales Route, 2026 Share
| Leading Share | 2026 market share |
|---|---|
| Direct Contract Supply | 62.0% |
| All Other Segments Combined Share | 38.0% |
Source: Future Market Insights analysis of the nepheline syenite market, 2026.
What are the key drivers restraints and opportunities?
Furnace-batch performance supports core demand, recycled cullet and competing feldspar constrain virgin mineral purchases, and precisely milled filler grades provide a route to higher-value applications.
Driver
Glass and ceramic producers assess low-iron alumina and alkali supply against melting behaviour, fired appearance and the cost of the complete formulation.
Restraint
Cullet replaces part of the virgin batch, while established feldspar supply gives manufacturers another route to the required chemistry.
Opportunity
Fine fillers qualified for clear, powder and industrial coatings extend the addressable customer base beyond bulk furnace consumption.
How do purchasing rules and qualification affect nepheline syenite market demand?
New demand is most credible where a manufacturer has both operating capacity and a reason to alter its raw-material blend. Şişecam's Tarsus completion provides a dated example of added glass capacity. Its commercial relevance to nepheline syenite depends on the approved batch and the procurement route. A mineral producer earns the order through suitability and delivery, not through the customer's capacity announcement alone.
Ceramic manufacturers present a separate route. The ceramic tiles market includes different body and glaze requirements, giving mineral suppliers several possible points of entry. Spain-based Prodesco's August 2025 nepheline syenite sheet identifies its role in lower-maturity bodies, frits and glazes. Trials must establish fired colour and dimensional behaviour in the customer's formulation. Once accepted, the specification ties demand to production of that particular range instead of to the entire national tile industry.
What limits reliable nepheline syenite market supply and quality?
The immediate demand risk is weaker output at customers that already use the mineral. Production curtailment removes batch requirements regardless of the theoretical efficiency of the flux. German glass statistics and Chinese plate-glass figures show this exposure in two major consuming markets. A second risk is substitution within continuing production. More cullet or a different feldspar blend reduces the amount of nepheline needed per tonne of glass.
The supply risk sits elsewhere. A suitable deposit still needs dependable power, processing and transport. Stjernøy's replacement-cable permit demonstrates the significance of supporting infrastructure at an existing mineral operation. Permission is one stage in that process. Commercial delivery commitments should reflect available operating capability and shipping arrangements, while any expected benefit from new infrastructure follows its actual implementation.
Where can suppliers win additional business in the nepheline syenite market?
Filler Grade is projected to grow at 4.4% annually over 2026 to 2036 and reach 23.0% of grade revenue in 2036. The opportunity lies in applications where particle distribution, abrasion resistance or optical behaviour changes the finished formulation's performance. Covia's MINEX range distinguishes coarse and fine grades for different coating finishes. That is a more precise commercial proposition than selling an unspecified mineral powder.
Application support becomes part of the offer. A mineral producer opened its Concord innovation centre on 24 June 2025 with capabilities covering coatings and polymers among other industries. The centre is broader than nepheline syenite, but it illustrates the technical resources available to compete for formulation work. Suppliers seeking filler business need comparable evidence from the relevant finished system, while avoiding unsupported claims that laboratory capability guarantees market-share gains.
Nepheline Syenite Market by Country (2026 to 2036)
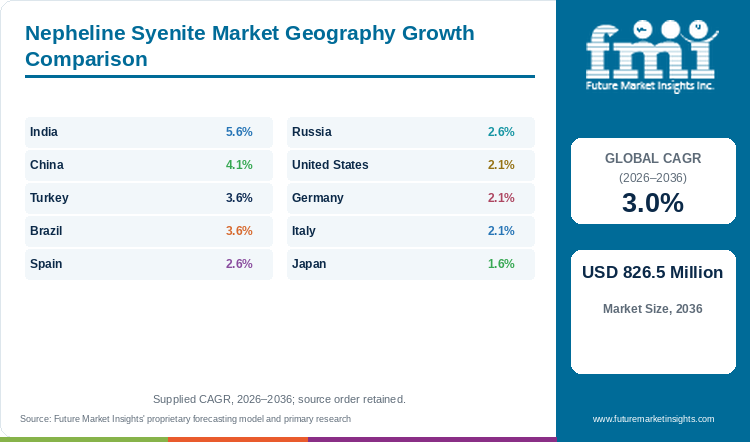
Table 5: Nepheline Syenite Market Country Growth Forecast
| Country | CAGR, 2026 to 2036 |
|---|---|
| India | 5.6% |
| China | 4.1% |
| Turkey | 3.6% |
| Brazil | 3.6% |
| Spain | 2.6% |
| Russia | 2.6% |
| United States | 2.1% |
| Germany | 2.1% |
| Italy | 2.1% |
| Japan | 1.6% |
Source: Future Market Insights analysis of the nepheline syenite market, 2026.
India
India has the highest forecast growth among the ten individually assessed countries. Revenue rises from USD 36.9 million in 2026 to USD 63.5 million in 2036, representing a 5.6% CAGR over 2026 to 2036. The relatively small starting value leaves room for additional mineral adoption, but the commercial case must account for India's existing feldspar industry.
USGS places Indian feldspar production at an estimated 6.0 million tonnes in 2025. Its relevance is that glass and ceramic producers have an established alternative for part of the required batch chemistry. An imported nepheline grade consequently faces a practical landed-cost test before it wins a place in a formulation.
The opportunity is most credible where a customer values a particular combination of alumina, alkalis and low iron. A standard bulk offer without that distinction is exposed to domestic mineral prices and the additional freight involved. Filler applications create a second route, especially where a finely controlled grade is accepted for a defined coating finish.
FMI's view is that the forecast reflects incremental penetration across applications instead of an assumption that Indian factories broadly abandon established raw materials. A durable account needs repeatable grade quality and an order quantity compatible with the customer's storage and processing system. Growth therefore depends on the conversion of successful formulation work into recurring purchases, with bulk-glass and filler opportunities assessed on their own economics.
China
China's large glass industry presents an important distinction between installed scale and current consumption. The National Bureau of Statistics recorded a 3.0% decline in plate-glass output for 2025. That result limits the case for treating all glass-related mineral demand as an immediate expansion market. Mineral sales are tied to the furnaces actually running and the materials specified in their batches.
Against that operating backdrop, FMI estimates China's nepheline syenite revenue at USD 73.8 million in 2026 and USD 110.1 million in 2036. The projected CAGR stands at 4.1% over 2026 to 2036. Growth over that longer period need not follow the recent plate-glass cycle in a straight line. It also includes the changing mix of ceramic and filler customers within the defined mineral market.
Competition from feldspar is especially relevant. USGS lists China as a substantial feldspar producer, giving manufacturers access to an established alternative source of alumina and alkalis. A nepheline offer therefore needs to establish a formulation advantage after freight and processing costs. The relevant comparison is not whether one mineral melts at a lower temperature in isolation. It is whether its inclusion improves the customer's production result at an acceptable total cost.
For overseas suppliers, the commercial task is consequently selective. A specification that addresses a clear-glass or specialized coating requirement offers a stronger opening than an undifferentiated bulk proposition. Local operating evidence should determine the order timing, while the longer forecast captures opportunities across a broader range of consuming industries.
Turkey
Turkey combines an expanding glass-production base with strong domestic competition from feldspathic minerals. In its March 2026 shareholder update, Şişecam reported completion of its Tarsus flat-glass project. The event is relevant because new melting capacity creates a potential customer requirement for batch materials.
The Turkish market is projected to reach USD 61.2 million in 2036 from USD 43.1 million in 2026. FMI's forecast CAGR of 3.6% for 2026 to 2036 is supported by opportunities across glass and ceramic uses, with supplier selection constrained by local raw-material alternatives. A high-level customer expansion plan is therefore only the beginning of the mineral sales process. In the nepheline syenite market, Turkey grows 3.6% a year, 0.6 points above the global rate. Global revenue share for Turkey increases from 7.0% to 7.4%. The USD 18.1 million rise over the decade ranks Turkey fourth for increase.
Esan Eczacibasi lists sodium and potassium feldspar alongside other industrial minerals, and identifies glass and ceramic manufacturing among the sectors it serves. That verified portfolio places the company in the competitive purchasing environment. For manufacturers evaluating the two mineral routes, chemical consistency and transport cost determine the practical difference.
FMI expects bulk opportunities to be strongest where a specific production line adopts a suitable batch and maintains sufficient utilization. Finer filler sales require a separate channel to coating or polymer formulators.
Brazil
Brazil's ceramic sector creates a sizeable potential customer base with a strong domestic-market component. ANFACER describes Brazil as a major tile producer and consumer, with finished products also exported to more than 110 countries. The association's account establishes the breadth of the consuming industry.
The Brazilian nepheline syenite market is forecast to grow at a 3.6% CAGR between 2026 and 2036. Revenue increases from USD 30.8 million to USD 43.7 million over the period. FMI expects the opportunity to be shaped by whether a grade improves an accepted ceramic or glass formulation at a competitive delivered cost. Domestic construction conditions and overseas ceramic demand both influence the production schedule behind that decision.
The comparison with local feldspathic materials matters because transport absorbs part of the value of a low-priced industrial mineral. A specialized nepheline specification has a stronger commercial case where its chemistry or colour performance addresses a defined requirement.
Filler customers add a smaller and more differentiated outlet. Their purchase quantities and packaging requirements differ from bulk ceramic intake, making local distribution and consistent product handling relevant to the offer. FMI sees Brazilian growth coming from these distinct uses instead of from treating every tonne of ceramic output as a proportional mineral opportunity. Suppliers that identify the actual formulation and its production volume have a more credible order outlook than those relying on broad building-market growth alone.
Spain
Castellón's concentrated ceramic industry makes Spain a market where technical approval and distribution within one manufacturing district carry considerable commercial value. ASCER states that approximately 94.0% of national tile production originates in the province. That concentration brings body, glaze and frit users into a relatively compact purchasing area. It also exposes mineral suppliers to changes in the export orders received by those manufacturers.
FMI projects Spanish nepheline syenite revenue of USD 30.8 million in 2026 and USD 39.7 million in 2036, equivalent to a 2.6% CAGR during 2026 to 2036. The opportunity is selective instead of a claim that all tile output uses nepheline. Different products require different firing behaviour, colour and composition, so the commercially relevant unit is an approved formulation.
Prodesco's 2025 technical sheet provides a local example of the mineral being offered for ceramic bodies, frits and glazes. This supports its relevance to the Spanish supply chain without establishing the size of the company's sales. A formulation change has to preserve the finished ceramic's appearance and firing result, which limits substitution based solely on a low mineral quote.
Spanish suppliers and distributors therefore have an opportunity to combine the selected grade with dependable local availability. Export exposure remains a demand constraint because a district's raw-material intake ultimately follows production for domestic and overseas customers. FMI expects moderate expansion through additional accepted uses and continued replenishment of existing accounts, with the strength of the ceramic order book shaping the timing of bulk deliveries.
Russia
Russia requires a careful distinction between industrial nepheline syenite grades and its much broader nepheline-ore processing chains. PhosAgro's 2025 report lists nepheline concentrate and syenite alkali aluminium concentrate among its products. These materials demonstrate the country's mineral-processing capability.
Within that defined market, FMI forecasts Russian revenue of USD 24.6 million in 2026 and USD 31.7 million in 2036. The outlook implies a 2.6% CAGR from 2026 to 2036. The commercial question is how much suitable material reaches consuming manufacturers in an accepted specification, instead of the total tonnage of rock or concentrate produced nationally. Russia supplies 4.0% of global revenue in 2026 and 3.8% by 2036. By absolute increase, Russia ranks ninth with USD 7.1 million over the decade.
Domestic processing provides an established mineral context, but each glass or coating customer still needs the composition, iron level and particle distribution appropriate to its product. This separates mineral-resource scale from the practical supply available to the applications assessed in this report.
FMI expects growth to depend on converting appropriate grades into recurring manufacturing inputs. For glass and ceramics, that means a stable formulation and dependable deliveries to the operating plant. Coating fillers require more intensive milling and application qualification, with a different price basis from bulk ore. The Russian opportunity should therefore be judged through the actual processed product and destination.
United States
Canadian supply is the defining commercial feature of the U.S. market. USGS places U.S. nepheline syenite import reliance above 95.0%, with Canada supplying almost all imports during its stated 2021 to 2024 reference period. This is a mature cross-border mineral trade, so demand growth alone does not explain purchasing behaviour. The route from a qualified source to the consuming plant determines the inventory and freight commitment behind each annual contract.
FMI forecasts U.S. revenue to rise from USD 123.0 million in 2026 to USD 151.1 million in 2036, a 2.1% CAGR over 2026 to 2036. The rate reflects continued demand across established applications with limited evidence for a sudden bulk-volume step change. Glass remains exposed to the amount of virgin material required in each batch. A furnace running with more suitable cullet may increase glass output without increasing mineral demand proportionately.
The coatings outlet introduces a different sales process. The MINEX portfolio includes grades intended for clear systems and powder coatings. Orders in those applications depend on the approved product's particle characteristics and finished appearance. A supplier's North American presence is commercially useful when it connects reliable stock with the particular grade already accepted by the formulator. FMI therefore sees the U.S. opportunity in sustaining core glass accounts while adding selected filler applications, with price realization affected by the mix between those two businesses.
Germany
Weakness in German glass production constrains the immediate flux market. BV Glas reports that total industry tonnage contracted 0.9% in 2025, alongside a 4.8% revenue decline. A mineral with an efficiency benefit still competes for a smaller batch requirement when customers reduce output.
Germany's nepheline syenite market is forecast at USD 49.2 million in 2026, reaching USD 60.4 million by 2036. FMI's 2.1% CAGR for 2026 to 2036 points to measured expansion instead of a return to unrestricted bulk buying. Commercial emphasis falls on preserving accepted specifications and identifying applications where the mineral's properties justify the delivered cost.
The established European supply base gives manufacturers several formulation choices. Norwegian nepheline and continental feldspar offers compete with one another within the customer's production constraints. For a glass account, maintaining composition and colour is central to a supplier change. For an industrial coating, the accepted particle grade and its effect on film appearance become more important than the mine's total output.
FMI therefore expects the German sales discussion to remain closely connected to operating evidence at each customer. Long-term demand is supported by an existing glass and industrial-material base, but replacement of a current mineral blend requires a documented commercial reason. Opportunities in filler applications should be evaluated separately from the recovery of glass tonnage, since the two businesses have different qualification periods and order sizes.
Italy
Italy's ceramic districts provide a concentrated route to mineral customers, although finished-tile sales and raw-material intake do not move identically. Confindustria Ceramica reported 2024 tile production of 369.8 million square metres, down 1.1%, while sales increased 2.5%. Manufacturers may sell inventory before increasing body or glaze production.
FMI expects Italian nepheline syenite revenue to rise at a 2.1% CAGR during 2026 to 2036, from USD 49.2 million to USD 60.4 million. The local commercial argument centres on formulation performance within an established ceramic supply chain. Export customers influence production decisions, while energy expenditure and finished-product margins affect the willingness to change raw materials. Italy adds USD 11.2 million, ranking joint sixth for increase. Italy's share of the global market eases from 8.0% to 7.3%.
Minerali Industriali illustrates the competitive breadth available to Italian manufacturers. Its published portfolio includes feldspars, feldspathic sands and processed recycled glass. Their availability makes the supplier comparison a matter of the full formulation and its delivered economics.
For a nepheline processor, the strongest opening is a clearly defined technical requirement in a body, frit or glaze. FMI sees repeat orders developing where the mineral's chemistry remains useful across a production range and the delivery schedule fits that range's actual output. This gives application work greater importance than a general forecast for Italian construction alone.
Japan
Japan's progress in glass recycling places a practical limit on the link between finished-glass production and virgin mineral purchases. On 18 September 2026, NSG announced a successful demonstration using post-consumer waste glass in float-glass production. It nevertheless shows the direction of work that may change raw-material demand per tonne of glass.
FMI assigns Japan the lowest forecast growth among the ten named countries, at a 1.6% CAGR over 2026 to 2036. Nepheline syenite revenue reaches USD 21.6 million in 2036 from USD 18.5 million in 2026. The modest increase is consistent with a market where accepted material specifications and existing industrial customers matter more than rapid expansion of bulk consumption.
Recycling does not eliminate every virgin batch component. The amount and quality of available cullet still influence the remaining formulation. Mineral suppliers therefore need to understand the particular glass being produced and the properties of the accepted input. An efficiency argument should be assessed against the customer's actual recycled-glass blend, not against an assumed virgin batch.
Fine filler applications provide another route to sales, with purchasing driven by the performance of a selected grade in a coating or polymer. That opportunity is separate from glass recycling and should be evaluated on its own specification. FMI expects Japanese demand to remain selective, rewarding reliable chemistry and well-defined application performance while changes in cullet use constrain the scale of bulk flux growth.
Who are the notable companies in the Nepheline Syenite Market?
Notable companies in the Nepheline Syenite Market include Sibelco, Covia, Esan Eczacibasi and Minerali Industriali.
Competition includes both direct nepheline syenite producers and suppliers of materials considered in the same formulation decision. Sibelco's documented Norwegian operation gives it a direct position in glass, ceramics and filler applications. Covia's Blue Mountain material and MINEX portfolio establish another verified product route. Their presence makes deposit quality and the processing specification central to the direct supplier comparison.
Esan Eczacibasi and Minerali Industriali have a different documented role. Esan lists feldspar among its industrial minerals, while Minerali Industriali offers feldspars, feldspathic sands and recycled-glass materials. Those portfolios are commercially relevant where manufacturers compare batch alternatives. They do not establish that either company mines nepheline syenite.
FMI's competitive assessment therefore distinguishes mineral origin from access to a customer formulation. A producer with direct ore supply competes on accepted chemistry, processing and logistics. A broader industrial-mineral company may influence the same purchase through a competing blend or a complementary input. Market-share rankings cannot be inferred from the size of a group's total mineral business. The useful comparison is the actual material and service offered for the application being purchased.
Directly documented nepheline syenite supply: Sibelco and Covia.
Feldspathic alternatives and related industrial materials: Esan Eczacibasi and Minerali Industriali.
Key Developments in the Nepheline Syenite Market
- 27 March 2026: Şişecam's shareholder update reported completion of the Tarsus greenfield flat-glass investment. The stated 432.0 thousand-tonne annual capacity represents a downstream opportunity, with mineral procurement dependent on the adopted batch.
Key Players in the Nepheline Syenite Market
- Sibelco
- Covia
- Esan Eczacibasi
- Minerali Industriali
Nepheline Syenite Market Report Scope
Table 6: Nepheline Syenite Market Report Scope
| Coverage field | Report scope |
|---|---|
| Market definition | Nepheline syenite supplied as lump and milled grades for glass, ceramics, paints, plastics and other filler applications. |
| Market boundary | Mineral sales within the stated applications. Finished glass, tiles, paints and polymers are outside the market value. |
| Material distinction | Other feldspars and upstream nepheline concentrates are discussed as context or alternatives and are not automatically counted as the defined product. |
| Quantitative Units | USD million |
| Grade coverage | Glass Grade, Ceramic Grade and Filler Grade. |
| End-use coverage | Glass. Ceramics and Tiles. Paints and Coatings. Plastics and Rubber. Other. |
| Country coverage | United States, China, Germany, Italy, Turkey, India, Spain, Brazil, Russia and Japan |
| Competitive coverage | Sibelco, Esan Eczacibasi and Minerali Industriali, with Covia included as a directly documented nepheline syenite supplier. |
| Sales Route coverage | Direct Contract Supply, Distributor and Trader Supply. |
Source: Future Market Insights analysis of the nepheline syenite market, 2026.
Nepheline Syenite Market Research Methodology
The assessment combines FMI's quantitative outlook with secondary review of government mineral statistics, industry releases and original company disclosures. Checks cover product scope, share complements, forecast periods and volume units. External evidence supports commercial interpretation. Competitive comparisons preserve each company's documented products and the status of its operations and developments.
Nepheline Syenite Market by Segments
Nepheline Syenite Market segmented by Grade:
- Glass Grade
- Ceramic Grade
- Filler Grade
Nepheline Syenite Market segmented by End Use:
- Glass
- Ceramics and Tiles
- Paints and Coatings
- Plastics and Rubber
- Other
Nepheline Syenite Market segmented by Sales Route:
- Direct Contract Supply
- Distributor and Trader Supply
Nepheline Syenite Market by Region
- North America
- United States
- Latin America
- Brazil
- Western Europe
- Germany
- Italy
- Spain
- Eastern Europe
- Russia
- East Asia
- China
- Japan
- South Asia and Pacific
- India
- Middle East and Africa
- Turkey
- Rest of world
Research Sources and Bibliography
- ANFACER. (Undated). Quem somos: industry overview. Accessed 9 November 2026.
- ASCER. (2026). El sector: 2025 industry figures. Accessed 9 November 2026.
- Bundesverband Glasindustrie. (2026). An overview of the glass industry: 2025 figures. Accessed 9 November 2026.
- Confindustria Ceramica. (2025, June 10). Presentati i dati 2024 dell'industria ceramica italiana.
- Covia. (2025, June 24). Covia Opens New Innovation Center in Concord, NC. https://www.coviacorp.com/news-releases/covia-opens-new-innovation-center-in-concord-nc/
- Covia. (Undated). MINEX Functional Filler. Accessed 9 November 2026. https://www.coviacorp.com/products/minex/
- Esan Eczacibasi. (Undated). Industrial minerals, sectors and operating locations. Accessed 9 November 2026. https://esan.com.tr/
- Minerali Industriali. (Undated). Raw materials. Accessed 9 November 2026. https://www.mineraliindustriali.it/en/raw-materials/
- National Bureau of Statistics of China. (2026, January 20). Industrial Production Operation in December 2025. https://www.stats.gov.cn/english/PressRelease/202601/t20260120_1962350.html
- Norwegian Water Resources and Energy Directorate. (2026, May 7). Konsesjonssøknad Sibelco avd. Stjernøy 22 kV sjøkabel, case 202516376. https://www.nve.no/konsesjon/konsesjonssaker/konsesjonssak?id=25750&type=A-1
- NSG Group. (2026, September 18). Horizontal Recycling of Float Glass Using Waste Glass Collected from the Market Successfully Demonstrated. https://www.nsg.com/en/media/ir-updates/announcements-2026/waste-glass-recycling
- PhosAgro. (2026). Integrated Report 2025: Operational performance. https://ar2025.phosagro.com/en/perfomance-review/operational-performance/
- Prodesco. (2025, August 7). Nepheline Syenite, technical data sheet 50107100, version 1.3. https://prodesco.es/assets/ficheros/en/ft_50107100_en.pdf
- Sibelco. (Undated). Greener glass. Accessed 9 November 2026. https://www.sibelco.com/en/sustainability/case-study/greener-glass
- Sibelco. (Undated). Norway: Stjernøy operating-site description. Accessed 9 November 2026. https://www.sibelco.com/en/country/norway
- Şişecam. (2026, March 27). Şişecam Held Its 90th Annual Ordinary General Assembly with Shareholders. https://www.sisecam.com/en/press-releases/sisecam-held-its-90th-annual-ordinary-general-assembly-with-shareholders
- U.S. Geological Survey. (2026). Mineral Commodity Summaries 2026: Feldspar and Nepheline Syenite. https://pubs.usgs.gov/periodicals/mcs2026/mcs2026-feldspar.pdf
Table of Content
- Key Takeaways
- Market Size and CAGR
- Top Growth Driver
- Fastest Growing Segment
- Leading Region
- Key Companies
- Emerging Opportunities
- Executive Summary
- Global Market Outlook
- Demand-side Trends
- Supply-side Trends
- Technology Roadmap Analysis
- Analysis and Recommendations
- Analyst Perspective (What is happening? Why now? What should investors know?)
- Key Questions Answered
- How large is the market?
- What is the CAGR?
- What are key trends?
- Which region dominates?
- Who are the leaders?
Read More...
- Market Overview
- Market Coverage / Taxonomy
- Market Definition / Scope / Limitations
- Research Methodology
- Chapter Orientation
- Analytical Lens and Working Hypotheses
- Market Structure, Signals, and Trend Drivers
- Benchmarking and Cross-market Comparability
- Market Sizing, Forecasting, and Opportunity Mapping
- Research Design and Evidence Framework
- Desk Research Programme (Secondary Evidence)
- Expert Input and Fieldwork (Primary Evidence)
- Tooling, Models, and Reference Databases
- Data Engineering and Model Build
- Quality Assurance and Audit Trail
- Market Background
- Market Dynamics (Drivers, Restraints, Opportunity, Trends)
- Scenario Forecast (Optimistic, Likely, Conservative)
- Impact Analysis
- AI Impact
- Sustainability Impact
- Regulatory Impact
- Technology Impact
- Consumer / Buyer Analysis
- Purchase Drivers
- Adoption Barriers
- Buyer Journey
- Opportunity Map Analysis
- Product Life Cycle Analysis
- Supply Chain Analysis
- Investment Feasibility Matrix
- Value Chain Analysis
- PESTLE and Porter's Analysis
- Regulatory Landscape
- Regional Parent Market Outlook
- Production and Consumption Statistics
- Import and Export Statistics
- Global Market Analysis and Forecast, 2021 to 2036
- Historical Market Size Value (USD Million) Analysis, 2021 to 2025
- Current and Future Market Size Value (USD Million) Projections, 2026 to 2036
- Y-o-Y Growth Trend Analysis
- Absolute $ Opportunity Analysis
- Global Market Pricing Analysis, 2021 to 2036
- Global Market Analysis and Forecast, By Grade, 2021 to 2036
- Introduction / Key Findings
- Historical Market Size Value (USD Million) Analysis By Grade, 2021 to 2025
- Current and Future Market Size Value (USD Million) Analysis and Forecast By Grade, 2026 to 2036
- Glass Grade
- Ceramic Grade
- Filler Grade
- Y-o-Y Growth Trend Analysis By Grade, 2021 to 2025
- Absolute $ Opportunity Analysis By Grade, 2026 to 2036
- Global Market Analysis and Forecast, By End Use, 2021 to 2036
- Introduction / Key Findings
- Historical Market Size Value (USD Million) Analysis By End Use, 2021 to 2025
- Current and Future Market Size Value (USD Million) Analysis and Forecast By End Use, 2026 to 2036
- Glass
- Ceramics and Tiles
- Paints and Coatings
- Plastics and Rubber
- Other
- Y-o-Y Growth Trend Analysis By End Use, 2021 to 2025
- Absolute $ Opportunity Analysis By End Use, 2026 to 2036
- Global Market Analysis and Forecast, By Sales Route, 2021 to 2036
- Introduction / Key Findings
- Historical Market Size Value (USD Million) Analysis By Sales Route, 2021 to 2025
- Current and Future Market Size Value (USD Million) Analysis and Forecast By Sales Route, 2026 to 2036
- Direct Contract Supply
- Distributor and Trader Supply
- Y-o-Y Growth Trend Analysis By Sales Route, 2021 to 2025
- Absolute $ Opportunity Analysis By Sales Route, 2026 to 2036
- Global Market Analysis and Forecast, By Region, 2021 to 2036
- Introduction
- Historical Market Size Value (USD Million) Analysis By Region, 2021 to 2025
- Current Market Size Value (USD Million) Analysis and Forecast By Region, 2026 to 2036
- North America
- Latin America
- Western Europe
- Eastern Europe
- East Asia
- South Asia and Pacific
- Middle East and Africa
- Market Attractiveness Analysis By Region
- North America Market Analysis and Forecast, By Country, 2021 to 2036
- Historical Market Size Value (USD Million) Trend Analysis By Market Taxonomy, 2021 to 2025
- Market Size Value (USD Million) Forecast By Market Taxonomy, 2026 to 2036
- By Country
- United States
- By Grade
- By End Use
- By Sales Route
- By Country
- Market Attractiveness Analysis
- By Country
- By Grade
- By End Use
- By Sales Route
- Key Takeaways
- Latin America Market Analysis and Forecast, By Country
- Historical Market Size Value (USD Million) Trend Analysis By Market Taxonomy, 2021 to 2025
- Market Size Value (USD Million) Forecast By Market Taxonomy, 2026 to 2036
- By Country
- Brazil
- By Grade
- By End Use
- By Sales Route
- By Country
- Market Attractiveness Analysis
- By Country
- By Grade
- By End Use
- By Sales Route
- Key Takeaways
- Western Europe Market Analysis and Forecast, By Country
- Historical Market Size Value (USD Million) Trend Analysis By Market Taxonomy, 2021 to 2025
- Market Size Value (USD Million) Forecast By Market Taxonomy, 2026 to 2036
- By Country
- Germany
- Italy
- Spain
- By Grade
- By End Use
- By Sales Route
- By Country
- Market Attractiveness Analysis
- By Country
- By Grade
- By End Use
- By Sales Route
- Key Takeaways
- Eastern Europe Market Analysis and Forecast, By Country
- Historical Market Size Value (USD Million) Trend Analysis By Market Taxonomy, 2021 to 2025
- Market Size Value (USD Million) Forecast By Market Taxonomy, 2026 to 2036
- By Country
- Russia
- By Grade
- By End Use
- By Sales Route
- By Country
- Market Attractiveness Analysis
- By Country
- By Grade
- By End Use
- By Sales Route
- Key Takeaways
- East Asia Market Analysis and Forecast, By Country
- Historical Market Size Value (USD Million) Trend Analysis By Market Taxonomy, 2021 to 2025
- Market Size Value (USD Million) Forecast By Market Taxonomy, 2026 to 2036
- By Country
- China
- Japan
- By Grade
- By End Use
- By Sales Route
- By Country
- Market Attractiveness Analysis
- By Country
- By Grade
- By End Use
- By Sales Route
- Key Takeaways
- South Asia and Pacific Market Analysis and Forecast, By Country
- Historical Market Size Value (USD Million) Trend Analysis By Market Taxonomy, 2021 to 2025
- Market Size Value (USD Million) Forecast By Market Taxonomy, 2026 to 2036
- By Country
- India
- By Grade
- By End Use
- By Sales Route
- By Country
- Market Attractiveness Analysis
- By Country
- By Grade
- By End Use
- By Sales Route
- Key Takeaways
- Middle East and Africa Market Analysis and Forecast, By Country
- Historical Market Size Value (USD Million) Trend Analysis By Market Taxonomy, 2021 to 2025
- Market Size Value (USD Million) Forecast By Market Taxonomy, 2026 to 2036
- By Country
- Turkey
- Rest of world
- By Grade
- By End Use
- By Sales Route
- By Country
- Market Attractiveness Analysis
- By Country
- By Grade
- By End Use
- By Sales Route
- Key Takeaways
- Key Countries Market Analysis
- United States
- Pricing Analysis
- Market Share Analysis, 2025
- By Grade
- By End Use
- By Sales Route
- Brazil
- Pricing Analysis
- Market Share Analysis, 2025
- By Grade
- By End Use
- By Sales Route
- Germany
- Pricing Analysis
- Market Share Analysis, 2025
- By Grade
- By End Use
- By Sales Route
- Italy
- Pricing Analysis
- Market Share Analysis, 2025
- By Grade
- By End Use
- By Sales Route
- Spain
- Pricing Analysis
- Market Share Analysis, 2025
- By Grade
- By End Use
- By Sales Route
- India
- Pricing Analysis
- Market Share Analysis, 2025
- By Grade
- By End Use
- By Sales Route
- China
- Pricing Analysis
- Market Share Analysis, 2025
- By Grade
- By End Use
- By Sales Route
- Japan
- Pricing Analysis
- Market Share Analysis, 2025
- By Grade
- By End Use
- By Sales Route
- Russia
- Pricing Analysis
- Market Share Analysis, 2025
- By Grade
- By End Use
- By Sales Route
- Turkey
- Pricing Analysis
- Market Share Analysis, 2025
- By Grade
- By End Use
- By Sales Route
- United States
- Market Structure Analysis
- Competition Dashboard
- Competition Benchmarking
- Market Share Analysis of Top Players
- By Regional
- By Grade
- By End Use
- By Sales Route
- Emerging Startups
- Innovation Benchmarking
- Competition Analysis
- Competition Deep Dive
- Sibelco
- Overview
- Product Portfolio
- Profitability by Market Segments
- Sales Footprint
- Strategy Overview
- Marketing Strategy
- Product Strategy
- Channel Strategy
- Esan Eczacibasi
- Minerali Industriali
- Covia
- Sibelco
- Case Studies
- Success Stories
- Recent Developments
- Competition Deep Dive
- Assumptions & Acronyms Used
List of Tables
- Table 1: Global Market Value (USD Million) Forecast by Region, 2021 to 2036
- Table 2: Global Market Value (USD Million) Forecast by Grade, 2021 to 2036
- Table 3: Global Market Value (USD Million) Forecast by End Use, 2021 to 2036
- Table 4: Global Market Value (USD Million) Forecast by Sales Route, 2021 to 2036
- Table 5: North America Market Value (USD Million) Forecast by Country, 2021 to 2036
- Table 6: North America Market Value (USD Million) Forecast by Grade, 2021 to 2036
- Table 7: North America Market Value (USD Million) Forecast by End Use, 2021 to 2036
- Table 8: North America Market Value (USD Million) Forecast by Sales Route, 2021 to 2036
- Table 9: Latin America Market Value (USD Million) Forecast by Country, 2021 to 2036
- Table 10: Latin America Market Value (USD Million) Forecast by Grade, 2021 to 2036
- Table 11: Latin America Market Value (USD Million) Forecast by End Use, 2021 to 2036
- Table 12: Latin America Market Value (USD Million) Forecast by Sales Route, 2021 to 2036
- Table 13: Western Europe Market Value (USD Million) Forecast by Country, 2021 to 2036
- Table 14: Western Europe Market Value (USD Million) Forecast by Grade, 2021 to 2036
- Table 15: Western Europe Market Value (USD Million) Forecast by End Use, 2021 to 2036
- Table 16: Western Europe Market Value (USD Million) Forecast by Sales Route, 2021 to 2036
- Table 17: Eastern Europe Market Value (USD Million) Forecast by Country, 2021 to 2036
- Table 18: Eastern Europe Market Value (USD Million) Forecast by Grade, 2021 to 2036
- Table 19: Eastern Europe Market Value (USD Million) Forecast by End Use, 2021 to 2036
- Table 20: Eastern Europe Market Value (USD Million) Forecast by Sales Route, 2021 to 2036
- Table 21: East Asia Market Value (USD Million) Forecast by Country, 2021 to 2036
- Table 22: East Asia Market Value (USD Million) Forecast by Grade, 2021 to 2036
- Table 23: East Asia Market Value (USD Million) Forecast by End Use, 2021 to 2036
- Table 24: East Asia Market Value (USD Million) Forecast by Sales Route, 2021 to 2036
- Table 25: South Asia and Pacific Market Value (USD Million) Forecast by Country, 2021 to 2036
- Table 26: South Asia and Pacific Market Value (USD Million) Forecast by Grade, 2021 to 2036
- Table 27: South Asia and Pacific Market Value (USD Million) Forecast by End Use, 2021 to 2036
- Table 28: South Asia and Pacific Market Value (USD Million) Forecast by Sales Route, 2021 to 2036
- Table 29: Middle East and Africa Market Value (USD Million) Forecast by Country, 2021 to 2036
- Table 30: Middle East and Africa Market Value (USD Million) Forecast by Grade, 2021 to 2036
- Table 31: Middle East and Africa Market Value (USD Million) Forecast by End Use, 2021 to 2036
- Table 32: Middle East and Africa Market Value (USD Million) Forecast by Sales Route, 2021 to 2036
List of Figures
- Figure 1: Global Market Pricing Analysis
- Figure 2: Global Market Value (USD Million) Forecast 2021-2036
- Figure 3: Global Market Value Share and BPS Analysis by Grade, 2026 and 2036
- Figure 4: Global Market Y-o-Y Growth Comparison by Grade, 2026-2036
- Figure 5: Global Market Attractiveness Analysis by Grade
- Figure 6: Global Market Value Share and BPS Analysis by End Use, 2026 and 2036
- Figure 7: Global Market Y-o-Y Growth Comparison by End Use, 2026-2036
- Figure 8: Global Market Attractiveness Analysis by End Use
- Figure 9: Global Market Value Share and BPS Analysis by Sales Route, 2026 and 2036
- Figure 10: Global Market Y-o-Y Growth Comparison by Sales Route, 2026-2036
- Figure 11: Global Market Attractiveness Analysis by Sales Route
- Figure 12: Global Market Value (USD Million) Share and BPS Analysis by Region, 2026 and 2036
- Figure 13: Global Market Y-o-Y Growth Comparison by Region, 2026-2036
- Figure 14: Global Market Attractiveness Analysis by Region
- Figure 15: North America Market Incremental Dollar Opportunity, 2026-2036
- Figure 16: Latin America Market Incremental Dollar Opportunity, 2026-2036
- Figure 17: Western Europe Market Incremental Dollar Opportunity, 2026-2036
- Figure 18: Eastern Europe Market Incremental Dollar Opportunity, 2026-2036
- Figure 19: East Asia Market Incremental Dollar Opportunity, 2026-2036
- Figure 20: South Asia and Pacific Market Incremental Dollar Opportunity, 2026-2036
- Figure 21: Middle East and Africa Market Incremental Dollar Opportunity, 2026-2036
- Figure 22: North America Market Value Share and BPS Analysis by Country, 2026 and 2036
- Figure 23: North America Market Value Share and BPS Analysis by Grade, 2026 and 2036
- Figure 24: North America Market Y-o-Y Growth Comparison by Grade, 2026-2036
- Figure 25: North America Market Attractiveness Analysis by Grade
- Figure 26: North America Market Value Share and BPS Analysis by End Use, 2026 and 2036
- Figure 27: North America Market Y-o-Y Growth Comparison by End Use, 2026-2036
- Figure 28: North America Market Attractiveness Analysis by End Use
- Figure 29: North America Market Value Share and BPS Analysis by Sales Route, 2026 and 2036
- Figure 30: North America Market Y-o-Y Growth Comparison by Sales Route, 2026-2036
- Figure 31: North America Market Attractiveness Analysis by Sales Route
- Figure 32: Latin America Market Value Share and BPS Analysis by Country, 2026 and 2036
- Figure 33: Latin America Market Value Share and BPS Analysis by Grade, 2026 and 2036
- Figure 34: Latin America Market Y-o-Y Growth Comparison by Grade, 2026-2036
- Figure 35: Latin America Market Attractiveness Analysis by Grade
- Figure 36: Latin America Market Value Share and BPS Analysis by End Use, 2026 and 2036
- Figure 37: Latin America Market Y-o-Y Growth Comparison by End Use, 2026-2036
- Figure 38: Latin America Market Attractiveness Analysis by End Use
- Figure 39: Latin America Market Value Share and BPS Analysis by Sales Route, 2026 and 2036
- Figure 40: Latin America Market Y-o-Y Growth Comparison by Sales Route, 2026-2036
- Figure 41: Latin America Market Attractiveness Analysis by Sales Route
- Figure 42: Western Europe Market Value Share and BPS Analysis by Country, 2026 and 2036
- Figure 43: Western Europe Market Value Share and BPS Analysis by Grade, 2026 and 2036
- Figure 44: Western Europe Market Y-o-Y Growth Comparison by Grade, 2026-2036
- Figure 45: Western Europe Market Attractiveness Analysis by Grade
- Figure 46: Western Europe Market Value Share and BPS Analysis by End Use, 2026 and 2036
- Figure 47: Western Europe Market Y-o-Y Growth Comparison by End Use, 2026-2036
- Figure 48: Western Europe Market Attractiveness Analysis by End Use
- Figure 49: Western Europe Market Value Share and BPS Analysis by Sales Route, 2026 and 2036
- Figure 50: Western Europe Market Y-o-Y Growth Comparison by Sales Route, 2026-2036
- Figure 51: Western Europe Market Attractiveness Analysis by Sales Route
- Figure 52: Eastern Europe Market Value Share and BPS Analysis by Country, 2026 and 2036
- Figure 53: Eastern Europe Market Value Share and BPS Analysis by Grade, 2026 and 2036
- Figure 54: Eastern Europe Market Y-o-Y Growth Comparison by Grade, 2026-2036
- Figure 55: Eastern Europe Market Attractiveness Analysis by Grade
- Figure 56: Eastern Europe Market Value Share and BPS Analysis by End Use, 2026 and 2036
- Figure 57: Eastern Europe Market Y-o-Y Growth Comparison by End Use, 2026-2036
- Figure 58: Eastern Europe Market Attractiveness Analysis by End Use
- Figure 59: Eastern Europe Market Value Share and BPS Analysis by Sales Route, 2026 and 2036
- Figure 60: Eastern Europe Market Y-o-Y Growth Comparison by Sales Route, 2026-2036
- Figure 61: Eastern Europe Market Attractiveness Analysis by Sales Route
- Figure 62: East Asia Market Value Share and BPS Analysis by Country, 2026 and 2036
- Figure 63: East Asia Market Value Share and BPS Analysis by Grade, 2026 and 2036
- Figure 64: East Asia Market Y-o-Y Growth Comparison by Grade, 2026-2036
- Figure 65: East Asia Market Attractiveness Analysis by Grade
- Figure 66: East Asia Market Value Share and BPS Analysis by End Use, 2026 and 2036
- Figure 67: East Asia Market Y-o-Y Growth Comparison by End Use, 2026-2036
- Figure 68: East Asia Market Attractiveness Analysis by End Use
- Figure 69: East Asia Market Value Share and BPS Analysis by Sales Route, 2026 and 2036
- Figure 70: East Asia Market Y-o-Y Growth Comparison by Sales Route, 2026-2036
- Figure 71: East Asia Market Attractiveness Analysis by Sales Route
- Figure 72: South Asia and Pacific Market Value Share and BPS Analysis by Country, 2026 and 2036
- Figure 73: South Asia and Pacific Market Value Share and BPS Analysis by Grade, 2026 and 2036
- Figure 74: South Asia and Pacific Market Y-o-Y Growth Comparison by Grade, 2026-2036
- Figure 75: South Asia and Pacific Market Attractiveness Analysis by Grade
- Figure 76: South Asia and Pacific Market Value Share and BPS Analysis by End Use, 2026 and 2036
- Figure 77: South Asia and Pacific Market Y-o-Y Growth Comparison by End Use, 2026-2036
- Figure 78: South Asia and Pacific Market Attractiveness Analysis by End Use
- Figure 79: South Asia and Pacific Market Value Share and BPS Analysis by Sales Route, 2026 and 2036
- Figure 80: South Asia and Pacific Market Y-o-Y Growth Comparison by Sales Route, 2026-2036
- Figure 81: South Asia and Pacific Market Attractiveness Analysis by Sales Route
- Figure 82: Middle East and Africa Market Value Share and BPS Analysis by Country, 2026 and 2036
- Figure 83: Middle East and Africa Market Value Share and BPS Analysis by Grade, 2026 and 2036
- Figure 84: Middle East and Africa Market Y-o-Y Growth Comparison by Grade, 2026-2036
- Figure 85: Middle East and Africa Market Attractiveness Analysis by Grade
- Figure 86: Middle East and Africa Market Value Share and BPS Analysis by End Use, 2026 and 2036
- Figure 87: Middle East and Africa Market Y-o-Y Growth Comparison by End Use, 2026-2036
- Figure 88: Middle East and Africa Market Attractiveness Analysis by End Use
- Figure 89: Middle East and Africa Market Value Share and BPS Analysis by Sales Route, 2026 and 2036
- Figure 90: Middle East and Africa Market Y-o-Y Growth Comparison by Sales Route, 2026-2036
- Figure 91: Middle East and Africa Market Attractiveness Analysis by Sales Route
- Figure 92: Global Market - Tier Structure Analysis
- Figure 93: Global Market - Company Share Analysis
Frequently Asked Questions
How big is the nepheline syenite market in 2026?
FMI estimates the market at USD 615.0 million in 2026, up from USD 600.0 million in 2025. It is forecast to reach USD 826.5 million by 2036 at a 3.0% CAGR.
Which grade leads the nepheline syenite market in 2026?
Glass Grade leads by grade with 52.0% in 2026. All other segments together hold 48.0%.
Which end use and sales route lead in 2026?
Glass holds 52.0% by end use and Direct Contract Supply holds 62.0% by sales route in FMI's 2026 assessment.
Which market is forecast to grow fastest through 2036?
India has the highest forecast CAGR at 5.6% during 2026 to 2036, followed by China at 4.1%.
Why does recycled glass affect nepheline syenite demand?
Cullet supplies part of a glass batch, reducing the virgin mineral requirement. USGS identifies this substitution in its mineral assessment.[1]
Preview the report firsthand - request a free sample
Get SampleGet the brochure for pricing and purchase details.
Get PDF
