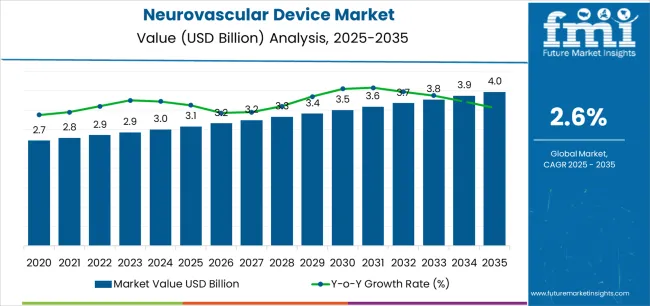
The Neurovascular Device Market is estimated to be valued at USD 3.1 billion in 2025 and is projected to reach USD 4.0 billion by 2035, registering a compound annual growth rate (CAGR) of 2.6% over the forecast period.
The Neurovascular Device market is experiencing robust growth, driven by the rising prevalence of cerebrovascular disorders, increasing geriatric population, and growing awareness of minimally invasive treatment options. Advanced interventional procedures, including coiling, embolization, and stenting, are being increasingly preferred over traditional open surgeries due to their reduced risk, shorter recovery times, and improved clinical outcomes. Ongoing technological innovations, such as enhanced device design, improved imaging compatibility, and biocompatible materials, are enhancing procedural efficiency and patient safety.
The market is further supported by increasing investments in healthcare infrastructure, particularly in hospitals and specialized surgical centers, along with favorable reimbursement policies in developed regions. Growing research initiatives and clinical trials aimed at expanding device indications are also fueling adoption.
Regulatory approvals and increasing availability of neurovascular devices in emerging markets are broadening the patient base As healthcare systems continue to prioritize minimally invasive neurointerventions, the market is poised for sustained growth, driven by technological innovation, rising patient demand, and the need for effective treatment of cerebral vascular conditions worldwide.
| Metric | Value |
|---|---|
| Neurovascular Device Market Estimated Value in (2025 E) | USD 3.1 billion |
| Neurovascular Device Market Forecast Value in (2035 F) | USD 4.0 billion |
| Forecast CAGR (2025 to 2035) | 2.6% |
The market is segmented by Product, Disease Pathology, and End User and region. By Product, the market is divided into Aneurysm Coiling And Embolization Devices, Cerebral Balloon Angioplasty, Stenting Systems, Support Devices, and Neurothrombectomy Devices. In terms of Disease Pathology, the market is classified into Cerebral Aneurysms, Carotid Artery Stenosis, Arteriovenous Malformations, Fistulas, Ischemic Strokes, and Others. Based on End User, the market is segmented into Hospitals And Surgical Centers, Ambulatory Care Centers, Research Laboratories, and Academic Institutes. Regionally, the market is classified into North America, Latin America, Western Europe, Eastern Europe, Balkan & Baltic Countries, Russia & Belarus, Central Asia, East Asia, South Asia & Pacific, and the Middle East & Africa.
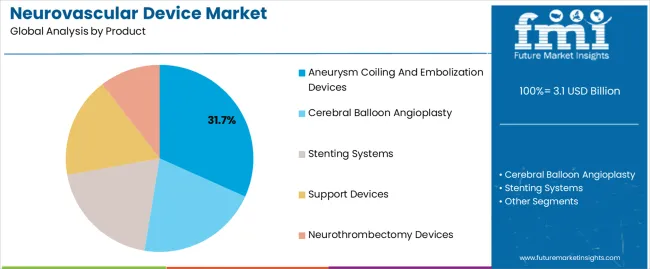
The aneurysm coiling and embolization devices segment is projected to hold 31.7% of the market revenue in 2025, positioning it as the leading product type. Growth in this segment is being driven by the increasing prevalence of cerebral aneurysms and other neurovascular abnormalities requiring minimally invasive intervention. These devices enable targeted occlusion of aneurysms, reducing rupture risk and improving patient outcomes while minimizing procedural complications.
Technological advancements in coil design, embolic materials, and delivery systems have improved safety, efficacy, and ease of use, enhancing adoption by neurointerventional specialists. Hospitals and surgical centers are increasingly deploying these devices to offer advanced treatment options with shorter hospitalization and faster recovery.
The ability to integrate these devices with modern imaging systems ensures precise placement and real-time monitoring As the demand for minimally invasive procedures continues to rise, aneurysm coiling and embolization devices are expected to maintain their market leadership, supported by innovation, clinical effectiveness, and growing adoption in both developed and emerging healthcare markets.
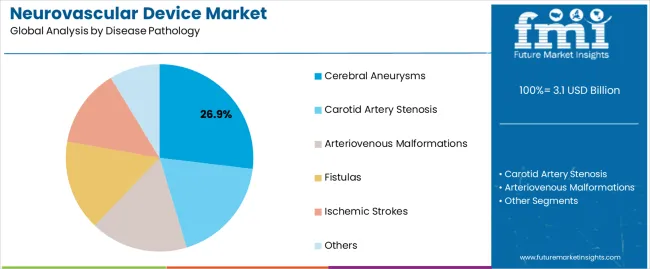
The cerebral aneurysms segment is anticipated to account for 26.9% of the market revenue in 2025, making it the leading disease pathology. Growth in this segment is driven by the rising incidence of cerebral aneurysms worldwide, coupled with increasing detection rates due to improved neuroimaging technologies. Early diagnosis and intervention are critical for preventing aneurysm rupture, which can lead to severe neurological deficits or mortality.
Neurovascular devices, such as coiling and embolization systems, are increasingly being adopted as the standard of care for managing cerebral aneurysms due to their minimally invasive nature and high clinical success rates. Technological innovations, including enhanced coil materials and delivery systems, have improved procedural precision and safety.
Hospitals and surgical centers are expanding neurointerventional capabilities to meet rising demand, supported by growing patient awareness and government initiatives focused on cerebrovascular health As clinical evidence supporting efficacy continues to accumulate, the cerebral aneurysms segment is expected to remain the largest disease pathology contributor to market revenue.
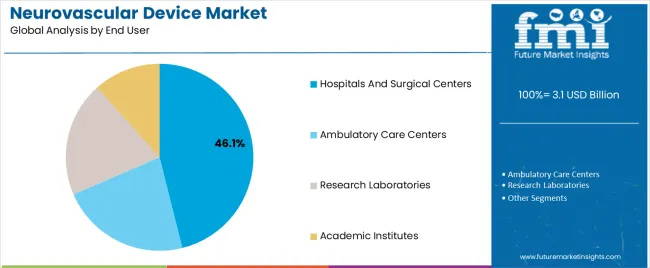
The hospitals and surgical centers segment is projected to hold 46.1% of the market revenue in 2025, establishing it as the leading end-user category. Growth is driven by increasing adoption of neurovascular interventions in well-equipped healthcare facilities capable of supporting advanced imaging, interventional suites, and specialized neurovascular teams. Hospitals and surgical centers provide access to minimally invasive procedures, postoperative monitoring, and rehabilitation services, which are critical for patient outcomes.
Rising investments in healthcare infrastructure, particularly in urban and high-population areas, have expanded the availability of neurovascular devices for routine clinical use. These centers are leveraging advanced devices to treat cerebral aneurysms, arteriovenous malformations, and other neurovascular conditions efficiently while reducing hospitalization time.
The ability to offer safe, precise, and high-success-rate interventions is further encouraging adoption As the demand for minimally invasive procedures continues to grow, hospitals and surgical centers are expected to remain the primary end-users driving market growth, supported by increasing patient volumes and procedural advancements.
The scope for neurovascular device rose at a 5.1% CAGR between 2020 and 2025. The global market is achieving heights to grow at a moderate CAGR of 2.7% over the forecast period 2025 to 2035. Several advancements were made in the neurovascular equipment category, during the historical period, such as the creation of new stent designs, embolization techniques as well as imaging technologies.
Increasing prevalence of neurovascular diseases including stroke, aneurysms, and AVMs across the globe also contributed to the increasing demand for neurovascular devices. Patients as well as the healthcare providers shifted their preference towards the minimally invasive procedures as compared to traditional surgeries, owing to their low risks implications, shorter recovery periods and better diagnostic advantages.
Healthcare spending is projected is all set to climb up particularly in developing countries in the coming years. The increased investment will augment the demand for neurovascular devices and drive market expansion.
Regulatory reforms aimed at streamlining the approval process for medical devices and ensuring patient safety will facilitate market access for neurovascular device manufacturers.
Faster regulatory approvals and expanded reimbursement coverage will drive market growth and innovation. Advances in genomics, proteomics, as well as imaging technologies will accelerate the adoption of personalized medicine approaches in neurovascular care. Neurovascular devices tailored to individual patient characteristics and disease profiles will become increasingly important, leading to market growth.
The below table showcases revenues in terms of the top 5 leading countries, spearheaded by India and Thailand. The countries will lead the market through 2035.
| Countries | Forecast CAGRs from 2025 to 2035 |
|---|---|
| The United States | 1.4% |
| Germany | 2.2% |
| France | 3.3% |
| Thailand | 3.4% |
| India | 5.5% |
The neurovascular device market in the United States will expand at a CAGR of 1.4% through 2035. The country is a hub for medical innovation, with ongoing advancements in neurovascular devices such as stents, embolic coils, thrombectomy devices, and flow diverters.
The technological innovations improve the efficacy, safety, and outcomes of neurovascular interventions, augmenting the market growth. The United States has a significant burden of neurovascular diseases such as stroke, aneurysms, and arteriovenous malformations.
There is a growing demand for neurovascular devices to treat and manage these diseases, with an aging population and changing lifestyles contributing to the rise in these conditions.
The neurovascular device market in the United Kingdom to expand at a CAGR of 2.2% through 2035. Government initiatives aimed at improving stroke care and reducing the burden of neurovascular diseases contribute to market growth.
Funding for stroke prevention programs, research grants, and investments in healthcare infrastructure further bolster the neurovascular device market in the country.
The United Kingdom has a well-developed healthcare infrastructure, including advanced hospitals, specialized neurovascular centers, and skilled healthcare professionals. The infrastructure supports the diagnosis, treatment, and management of neurovascular diseases, creating a conducive environment for market growth.
Neurovascular device trends in France are taking a turn for the better. A 3.3% CAGR is forecast for the country from 2025 to 2035. France has an aging population, which is more susceptible to neurovascular diseases.
The growing elderly population increases the demand for neurovascular interventions and devices to manage conditions such as stroke and cerebral aneurysms.
Public awareness campaigns and educational programs raise awareness about the signs, symptoms, and risk factors associated with neurovascular diseases. Increased awareness leads to earlier diagnosis and treatment, driving the demand for neurovascular devices in France.
The neurovascular device market in Thailand is poised to expand at a CAGR of 3.4% through 2035. Thailand has emerged as a popular destination for medical tourism due to its high quality healthcare services, affordable costs, and well trained medical professionals.
The influx of medical tourists seeking neurovascular treatments creates additional demand for neurovascular devices and procedures, accelerating the market growth. Increasing healthcare expenditure, both public and private in Thailand, reflects the growing investment in healthcare infrastructure, technology, and services.
The higher healthcare spending contributes to the expansion of neurovascular services and the adoption of advanced medical devices, including neurovascular devices.
The neurovascular device market in India will expand at a CAGR of 5.5% through 2035. The expansion of health insurance coverage in India, both through government schemes and private insurance providers, improves access to healthcare services for a larger segment of the population.
The affordability of neurovascular treatments increases, with more people covered by health insurance, stimulating market growth for neurovascular devices. India is increasingly becoming a hub for medical research and innovation, with the government and private sector investing in research and development initiatives.
The development of indigenous neurovascular devices, as well as collaborative research projects with international partners, leads to the introduction of innovative products tailored to the Indian market, stimulating market growth.
The below table highlights how aneurysm coiling and embolization segment is leading the market in terms of product type, and will account for a share of 31.7% in 2025.
Based on disease pathology, the cerebral aneuryms segment is gaining heights and will to account for a share of 26.9% in 2025.
| Category | Shares in 2025 |
|---|---|
| Aneurysm Coiling and Embolization | 31.7% |
| Cerebral Aneuryms | 26.9% |
Based on product type, the aneurysm coiling and embolization segment will dominate the neurovascular device market. Aneurysms, particularly intracranial aneurysms, are a significant health concern globally.
The growing incidence of aneurysms, coupled with advancements in imaging technologies leading to better detection rates, is propelling the demand for aneurysm coiling and embolization devices. Aneurysm coiling and embolization procedures offer minimally invasive alternatives to traditional surgical treatments for aneurysms.
Patients and healthcare providers increasingly prefer these less invasive procedures due to their lower risk of complications, shorter recovery times, and better outcomes, thus boosting the demand for related devices.
In terms of disease pathology, the cerebral aneuryms segment will dominate the neurovascular device market. Technological advancements in aneurysm coiling and embolization devices have significantly improved treatment outcomes for cerebral aneurysms.
Innovations such as detachable coils, flow diverters, and intrasaccular devices offer more effective and minimally invasive options for managing cerebral aneurysms, thereby driving segmental growth.
Cerebral aneurysms are a common and serious neurovascular condition, with a significant proportion of cases leading to potentially life threatening complications such as subarachnoid hemorrhage. The increasing incidence of cerebral aneurysms globally is a primary driver for the growth of this segment.
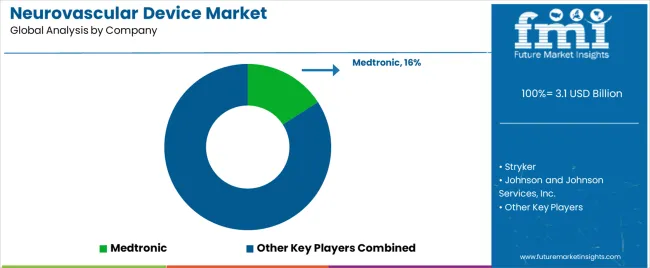
The neurovascular device market is characterized by intense competition among key players striving to maintain or enhance their market share through strategic initiatives, product innovation, and differentiation strategies.
Company Portfolio
| Attribute | Details |
|---|---|
| Estimated Market Size in 2025 | USD 3.0 billion |
| Projected Market Valuation in 2035 | USD 3.9 billion |
| Value-based CAGR 2025 to 2035 | 2.7% |
| Forecast Period | 2025 to 2035 |
| Historical Data Available for | 2020 to 2025 |
| Market Analysis | Value in USD Billion |
| Key Regions Covered | North America; Latin America; Western Europe; Eastern Europe; South Asia and Pacific; East Asia; The Middle East & Africa |
| Key Market Segments Covered | Product, Disease Pathology, End User, Region |
| Key Countries Profiled | The United States, Canada, Brazil, Mexico, Germany, France, France, Spain, Italy, Russia, Poland, Czech Republic, Romania, India, Bangladesh, Australia, New Zealand, China, Japan, South Korea, GCC countries, South Africa, Israel |
| Key Companies Profiled | Medtronic; Penumbra, Inc.; Stryker; Johnson and Johnson Services, Inc.; MicroPort Scientific Corporation; Acandis GmbH; MicroVention, Inc.; NeuroVasc Technologies, Inc.; Asahi Intecc USA, Inc.; Perflow Medical Ltd. |
The global neurovascular device market is estimated to be valued at USD 3.1 billion in 2025.
The market size for the neurovascular device market is projected to reach USD 4.0 billion by 2035.
The neurovascular device market is expected to grow at a 2.6% CAGR between 2025 and 2035.
The key product types in neurovascular device market are aneurysm coiling and embolization devices, cerebral balloon angioplasty, stenting systems, support devices and neurothrombectomy devices.
In terms of disease pathology, cerebral aneurysms segment to command 26.9% share in the neurovascular device market in 2025.


Full Research Suite comprises of:
Market outlook & trends analysis
Interviews & case studies
Strategic recommendations
Vendor profiles & capabilities analysis
5-year forecasts
8 regions and 60+ country-level data splits
Market segment data splits
12 months of continuous data updates
DELIVERED AS:
PDF EXCEL ONLINE
Neurovascular Stent Retrievers Market Size and Share Forecast Outlook 2025 to 2035
Neurovascular Guidewires Market Insights – Growth & Forecast 2025-2035
Neurovascular Access Catheters Market
Device-Embedded Biometric Authentication Market Size and Share Forecast Outlook 2025 to 2035
IoT Device Management Market Size and Share Forecast Outlook 2025 to 2035
IoT Device Management Platform Market Size and Share Forecast Outlook 2025 to 2035
Drug Device Combination Products Market Size and Share Forecast Outlook 2025 to 2035
FBAR Devices Market
X-Ray Device Market Size and Share Forecast Outlook 2025 to 2035
Power Device Analyzer Market Growth – Trends & Forecast 2025 to 2035
Snare devices Market
Biopsy Device Market Forecast and Outlook 2025 to 2035
Timing Devices Market Analysis - Size, Growth, & Forecast Outlook 2025 to 2035
Spinal Devices Market Size and Share Forecast Outlook 2025 to 2035
Mobile Device Management Market Analysis by Deployment Type, Solution, Business Size, Vertical, and Region Through 2035
C-Arms Devices Market Analysis – Trends & Forecast 2024-2034
Venous Device Market
Serial Device Servers Market
Medical Device Tester Market Size and Share Forecast Outlook 2025 to 2035
Medical Device Trays Market Size and Share Forecast Outlook 2025 to 2035

Thank you!
You will receive an email from our Business Development Manager. Please be sure to check your SPAM/JUNK folder too.
Chat With
MaRIA