NGS-based AMR Detection Market Size and Share Forecast Outlook 2025 to 2035

The global NGS-based AMR Detection Market is expected to reach a valuation of USD 823.7 million by 2025, growing to USD 1,666.0 million by 2035. This reflects an absolute increase of USD 842.6 million over the ten-year period, representing a 2.02X growth. The market is projected to expand at a robust compound annual growth rate (CAGR) of 7.3%, driven by the rising burden of antimicrobial resistance, advancements in NGS technologies, and increasing adoption in clinical and public health applications.
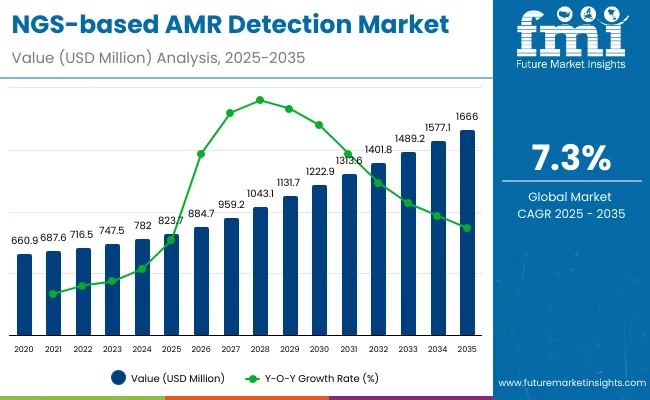
Quick Stats for NGS-based AMR Detection Market

  • Industry Value (2025): USD 823.7 million
  • Forecast Value (2035): USD 1,666.0 million
  • Forecast CAGR: 7.3%
  • Leading Segment in 2025 (Product Type): Instruments/Platforms (56.3% share)
  • Key Growth Region: Asia Pacific, North America and Europe
  • Top Key Players: Illumina, Thermo Fisher Scientific, QIAGEN, BIOMÉRIEUX, CD Genomics, Credence Genomics, Diagnostics Longwood SL, Fraunhofer IGB

Ngs Based Amr Detection Market

Metric Value
Industry Size (2025E) USD 823.7 million
Industry Value (2035F) USD 1,666.0 million
CAGR (2025 to 2035) 7.3%

During the first five-year period from 2025 to 2030, the global NGS-based AMR Detection Market is projected to grow from USD 823.7 million to approximately USD 1,222.9 million, adding USD 399.2 million in value. This growth accounts for nearly 47.4% of the total market expansion expected over the 2025-2035 decade. Within the product type category, the Instruments/Platforms segment will maintain dominance, projected to hold around 58.5% share by 2030, supported by widespread adoption across hospitals, public health labs, and pharma companies. The Reagents and Consumables segment is expected to rise steadily, reaching approximately 29.5% share by 2030, driven by the recurring demand associated with routine sequencing workflows. Meanwhile, Bioinformatics & Software Solutions will see a relative decline, expected to hold below 12% share by 2030, reflecting a shift toward integrated and bundled platform offerings.

The second half from 2030 to 2035 contributes USD 443.4million which is equal to 52.6% of the total growth as the market jumps from USD 1,222.9million to USD 1,666.0million,accounting for 52.6% of the total decade-long market growth. This accelerated momentum will be driven by the deepening integration of NGS-based antimicrobial resistance (AMR) detection across clinical diagnostics and public health surveillance systems globally. Towards the end of 2035, Clinical Diagnostics and Public Health & Surveillance hold 78.7% cumulatively.

From 2020 to 2024, the global NGS-based AMR Detection Market expanded from USD 660.9million to USD 782.0million, reflecting a compound annual growth rate (CAGR) of 5.5%. This growth was largely driven by increasing awareness of antimicrobial resistance (AMR) and early adoption of NGS technologies for resistance gene detection in clinical and public health settings. Leading companies such as Illumina, QIAGEN, and Thermo Fisher Scientific collectively accounted for an estimated over 50% of global revenues, propelled by bundled offerings of sequencing instruments, reagent kits, and bioinformatics platforms.

These players have actively pursued strategies such as the launch of rapid library preparation kits, enhancements in cloud-based bioinformatics pipelines, and partnerships with academic and clinical laboratories to validate real-world applications of NGS in AMR surveillance and diagnostics. Their continued focus on workflow automation and integration with electronic health systems has further reinforced their competitive position during this period.

In 2025, the global NGS-based AMR Detection Market is projected to reach a value of approximately USD 823.7 million, fueled by the transition from conventional culture-based antimicrobial susceptibility testing to advanced, genomics-driven diagnostic ecosystems. This growth is being driven by increasing investments from hospitals, public health agencies, and pharmaceutical companies in precision diagnostics, real-time resistance surveillance, and genomic epidemiology. Healthcare institutions are actively adopting NGS platforms integrated with automated library prep, targeted AMR panels, and cloud-based bioinformatics tools to accelerate detection workflows and improve treatment decision-making. Regulatory alignment with global AMR action plans and support from agencies such as the CDC, ECDC, and WHO is further pushing the adoption of genomic sequencing in infectious disease labs. Additionally, user demand is shifting toward modular, scalable sequencing systems and plug-and-play informatics dashboards that can support both high-throughput and point-of-care use cases while ensuring rapid turnaround times and robust data interpretation.

Why Is This Market Growing?

NGS-based AMR Detection is experiencing robust growth as healthcare systems globally face intensifying pressure to combat rising antimicrobial resistance, improve diagnostic turnaround times, and support evidence-based infection management. Key drivers fueling market expansion include increasing incidence of multidrug-resistant infections, regulatory mandates for AMR surveillance, and the growing demand for precision diagnostics. The global healthcare industry is rapidly shifting toward genomic platforms that can deliver high-throughput, pathogen-specific resistance profiling with enhanced speed and accuracy compared to conventional methods.

Technological innovations such as automated sample prep kits, cloud-native bioinformatics pipelines, and customizable AMR gene panels are reducing time-to-result and minimizing human interpretation errors, delivering measurable clinical and operational benefits. The COVID-19 pandemic highlighted the importance of genomic surveillance infrastructure, which has since been extended to AMR tracking, accelerating adoption of NGS across hospitals and public health agencies. As healthcare budgets increasingly prioritize infection control, data-driven therapeutics, and diagnostic preparedness, vendors offering end-to-end sequencing solutions with integrated reporting and pathogen tracking are capturing significant market share.

Segmental Analysis

The market is segmented by Product Type, Technology, Application, End User, and region. Product include Instruments/Platforms, Reagents and Consumables, and Bioinformatics & Software Solutions. Technology classification covers Whole-Genome Sequencing (WGS) and Targeted NGS. By Application segment includes Clinical Diagnostics, Public Health & Surveillance, Pharma/R&D, and Academic & Research Use. Based on End User, the segmentation includes Hospitals & Clinical Laboratories, Public Health Agencies & Reference Labs, Pharmaceutical & Biotechnology Companies, and Academic & Research Institutes. Regionally, the scope spans North America, Latin America, Western and Eastern Europe, East Asia, South Asia and Pacific, and the Middle East and Africa.
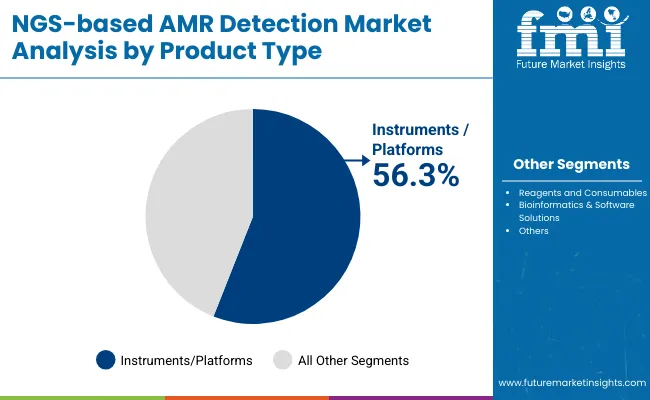
Insights into the Product Type Segment with Instruments/Platforms Leading in Market Share

Ngs Based Amr Detection Market By Product

Product Type Market Share (%)
Instruments/Platforms 56.3%
Reagents and Consumables 27.9%
Bioinformatics & Software Solutions 15.8%

Instruments and platforms are expected to retain a dominant position in the NGS-based AMR Detection Market, accounting for approximately 56.3% of the market share in 2025. Their prominence is driven by the critical need for high-throughput, accurate sequencing systems capable of comprehensive antimicrobial resistance profiling. Healthcare providers, public health agencies, and pharmaceutical companies are increasingly investing in state-of-the-art sequencing platforms that offer rapid turnaround times, scalability, and integration with automated workflows. The adoption of these instruments is further propelled by ongoing advancements in sequencing technology, such as improved accuracy, longer read lengths, and enhanced multiplexing capabilities, which collectively support precise identification of resistance genes and mutations. Regulatory bodies and infection control protocols emphasize the importance of reliable and reproducible genomic data, encouraging institutions to upgrade from traditional methods to cutting-edge NGS platforms.
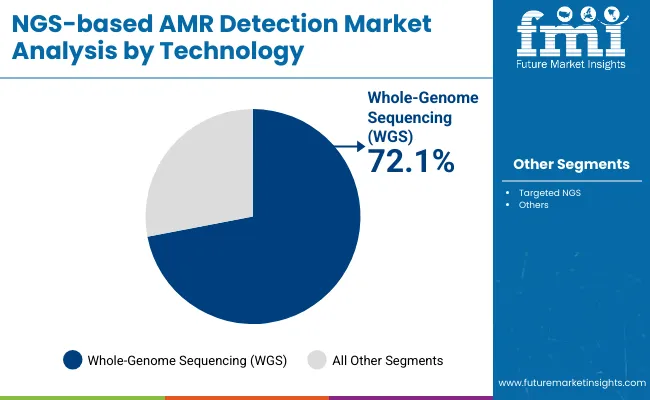
Insights into the Technology Segment with Whole-Genome Sequencing (WGS)Dominating the Demand

Ngs Based Amr Detection Market By Technology

Technology Market Share (%)
Whole-Genome Sequencing (WGS) 72.1%
Targeted NGS 27.9%

Whole-Genome Sequencing (WGS) has emerged as the leading technology in the NGS-based AMR Detection Market, projected to hold approximately 72.1% of the market share in 2025. This dominant position is driven by the growing demand for comprehensive and high-resolution profiling of antimicrobial resistance genes across diverse pathogens. Regulatory agencies and healthcare organizations are increasingly endorsing WGS for its unparalleled ability to provide detailed genomic insights, enabling accurate identification of resistance mechanisms, outbreak tracking, and epidemiological surveillance.

The rise of multidrug-resistant infections and the need for precision antimicrobial stewardship have further accelerated the adoption of WGS in clinical diagnostics, public health laboratories, and pharmaceutical R&D. WGS enables complete characterization of bacterial genomes, offering actionable data to guide treatment decisions and containment strategies. Additionally, advancements in sequencing speed, cost reduction, and bioinformatics tools have made WGS more accessible and practical for routine AMR detection workflows.
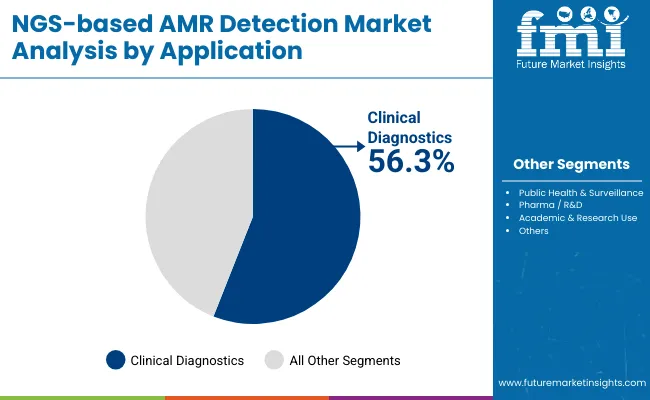
Insights into the Application Segment with Clinical Diagnostics Leading in Market Share

Ngs Based Amr Detection Market By Application

Application Market Share (%)
Clinical Diagnostics 56.3%
Public Health & Surveillance 22.4%
Pharma/R&D 15.0%
Academic & Research Use 6.3%

Clinical Diagnostics is expected to retain a dominant position in the NGS-based AMR Detection Market, accounting for approximately 56.3% of the market share in 2025. This leadership is driven by the increasing adoption of next-generation sequencing technologies in hospitals and clinical laboratories for rapid, precise identification of antimicrobial resistance profiles. The rising prevalence of multidrug-resistant infections and the urgent need for tailored antibiotic therapies have underscored the value of NGS in improving patient outcomes through timely and accurate diagnostics.

Healthcare providers are increasingly integrating NGS-based AMR detection into routine diagnostic workflows, enabling comprehensive pathogen characterization and resistance gene identification in a single assay. This integration supports antibiotic stewardship programs and helps reduce empirical antibiotic use, mitigating the spread of resistance. Technological advancements in sequencing speed, cost-effectiveness, and user-friendly bioinformatics solutions further facilitate clinical adoption.
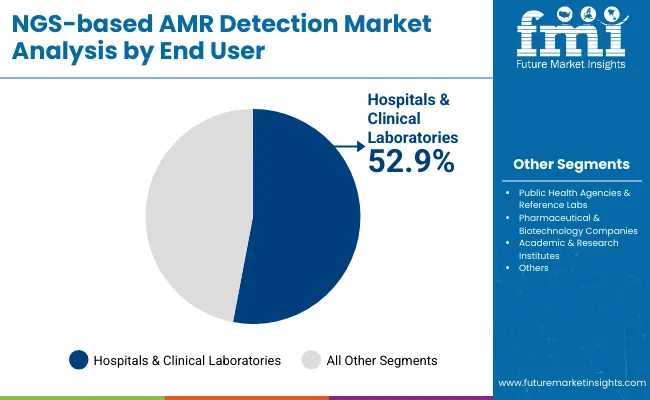
Insights into the End User Segment with Hospitals & Clinical Laboratories leading the major market share.

Ngs Based Amr Detection Market By End User

End User Market Share (%)
Hospitals & Clinical Laboratories 52.9%
Public Health Agencies & Reference Labs 24.7%
Pharmaceutical & Biotechnology Companies 15.3%
Academic & Research Institutes 7.1%

Hospitals and Clinical Laboratories are expected to remain the largest end-user segment in the NGS-based AMR Detection Market, contributing approximately 52.9% of the market share in 2025. This dominance is driven by the increasing need for rapid, accurate, and comprehensive antimicrobial resistance detection in clinical settings where timely diagnosis directly impacts patient management and treatment outcomes. Hospitals perform the majority of infectious disease testing and require scalable, regulation-compliant sequencing solutions to meet growing demands from infection control and antibiotic stewardship programs.

The rising incidence of multidrug-resistant infections in healthcare facilities has accelerated investments in advanced NGS platforms and associated consumables to support high-throughput genomic surveillance and diagnostics. Additionally, hospital laboratories are upgrading their infrastructure to integrate automated workflows and bioinformatics tools that streamline data analysis and reporting, ensuring compliance with stringent healthcare regulations and quality standards.

What are the Drivers, Restraints, and Key Trends of the NGS-based AMR Detection Market?

Rising Incidence of Antimicrobial Resistance (AMR)

The rising incidence of antimicrobial resistance (AMR) is a significant driver accelerating the growth of the global NGS-based AMR Detection Market. According to the World Health Organization (WHO), bacterial AMR was directly responsible for 1.27 million deaths and contributed to nearly 4.95 million deaths globally in 2019. Without effective interventions, it is projected that AMR could lead to 10 million deaths annually by 2050, surpassing fatalities from cancer. This escalating threat has prompted urgent action from global health bodies, including the WHO’s Global Action Plan on AMR, which emphasizes the critical role of enhanced surveillance and research. Next-generation sequencing (NGS), particularly whole-genome sequencing (WGS), has emerged as a preferred technology for AMR surveillance due to its ability to provide high-resolution data on resistance genes, transmission patterns, and genetic mutations.

Platforms from leading companies like Illumina are increasingly used in public health agencies to track outbreaks, detect emerging resistance genes, and inform antimicrobial stewardship strategies. Additionally, initiatives such as the Global Antimicrobial Resistance Surveillance System (GLASS) advocate for the integration of genomics into routine AMR monitoring frameworks, further validating the role of NGS. These developments are propelling investment in NGS-based technologies by hospitals, public health labs, and pharmaceutical companies seeking faster, more comprehensive resistance profiling tools. As a result, the global surge in AMR prevalence is not only raising clinical concerns but also creating sustained demand for NGS-based diagnostic and surveillance solutions, driving market growth significantly.

Limited Standardization and Data Interpretation Complexity

The growth of the global NGS‑based AMR Detection Market is being hampered by the lack of standardized workflows and the complexity of interpreting sequencing data. As identified in expert reviews, the absence of unified protocols, from sample preparation and DNA extraction to library prep and bioinformatics analysis, undermines consistency across laboratories and complicates cross-study comparisons. There is, for example, no universally accepted reference reagents or clinical breakpoints for interpreting resistance-related genomic predictions, even as WGS becomes more central to AMR diagnosis and surveillance.

Moreover, the bioinformatics layer poses significant challenges: devising validated pipelines to reliably detect resistance determinants requires rigorous benchmarking and quality assurance measures, yet such robust resources remain scarce. This need for harmonized validation tools and performance metrics is especially pressing given the reliance on diverse platforms and analytical approaches. Laboratories also face hurdles in interpretation. Clinical metagenomic sequencing can yield vast, complex datasets that demand deep bioinformatics expertise to identify clinically actionable findings accurately. Many labs lack the specialized computational infrastructure and skilled personnel to filter out noise such as contaminating human DNA and to translate raw reads into reliable resistance profiles

Integration of AI-Driven Bioinformatics and Cloud-Based Analytics

The integration of AI-driven bioinformatics and cloud-based analytics is emerging as a major market trend propelling the global NGS‑based AMR Detection Market. As the volume and complexity of genomic data generated by NGS platforms continue to escalate, traditional bioinformatics is straining under the burden. AI-powered algorithms particularly those utilizing machine learning and deep learning are being deployed to accelerate and improve accuracy in variant calling, resistance gene identification, and data interpretation, transforming complex raw data into actionable insights. In parallel, cloud-native platforms are gaining traction due to their scalability, accessibility, and pay-as-you-go cost structure. These platforms enable widespread access to advanced analytics workflows, even for smaller labs with limited in-house infrastructure, while offering high-performance computing and storage capabilities. The synergy of AI-enhanced analysis and flexible cloud deployment is thus enabling faster, more reliable AMR detection and expanding adoption of NGS tools across clinical, public health, and research environments.
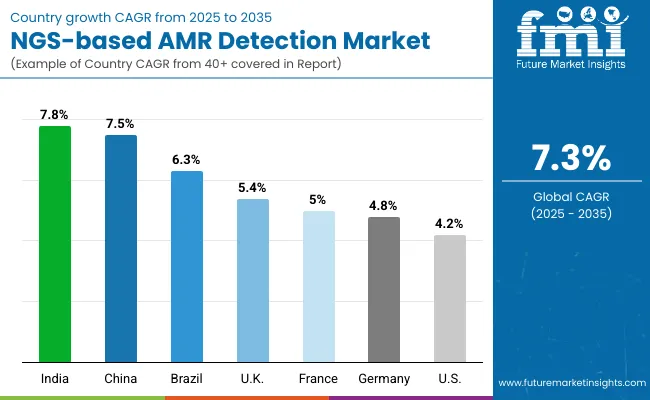
Analysis of NGS-based AMR Detection Market, By Key Countries

Ngs Based Amr Detection Market By Country

Countries CAGR
USA 4.2%
Brazil 6.3%
China 7.5%
India 7.8%
Europe 5.1%
Germany 4.8%
France 5.0%
UK 5.4%

Asia Pacific is emerging as the fastest-growing region in the global NGS-based AMR Detection Market, projected to expand at a CAGR of 7.2% between 2025 and 2035. India, with a CAGR of 6.9%, is witnessing strong momentum due to government-backed antimicrobial resistance surveillance programs, increased investments in genomic laboratories, and the expansion of tertiary care hospitals equipped with next-generation sequencing (NGS) capabilities. China, growing at 7.2% CAGR, is advancing large-scale pathogen genomic monitoring across hospital networks and provincial centers for disease control (CDCs), driven by its national action plans to combat AMR. Regional growth is further supported by the WHO's GLASS initiative and APAC-specific collaborations such as Japan’s National Institute of Infectious Diseases (NIID), which is strengthening the role of Whole-Genome Sequencing (WGS) in AMR surveillance.

Europe is expected to grow at a CAGR of 7.1% through 2035, driven by robust policy frameworks, established AMR surveillance systems, and increased R&D funding for genomic diagnostics. Germany is projected to grow at 7.6% CAGR, supported by precision medicine initiatives and hospital modernization, contributing 28.9% of Europe’s total NGS-based AMR Detection Market by 2035. France (5.0% CAGR) benefits from national health reforms under the “Ségur de la santé” plan, which prioritizes public health genomics. The UK, growing at 6.3% CAGR, is reinforcing its commitment to AMR surveillance via the UKHSA and investments in pathogen genomics infrastructure through Genomics England and NHS partnerships.

North America remains the largest and most mature region, led by the United States, which is projected to grow at a CAGR of 8.7% between 2025 and 2035. The USA market—valued at USD 355.8 million in 2025 and expected to reach USD 819.5 million by 2035—is driven by the integration of AI-enabled bioinformatics platforms, federal funding for AMR detection, and expansion of sequencing capacity in clinical and public health labs. Initiatives like the CDC’s Antibiotic Resistance Solutions Initiative and the National Action Plan for Combating Antibiotic-Resistant Bacteria are accelerating NGS deployment. The rise of cloud-based data analytics and real-time genomic surveillance tools is further fueling adoption across hospitals, academic centers, and reference labs.
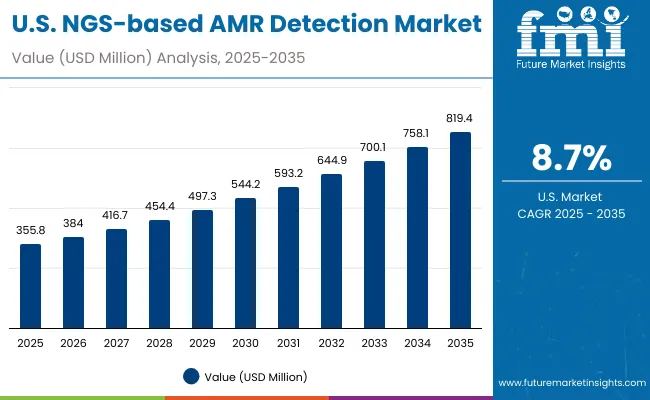
Sales Outlook for NGS-based AMR Detection Market in the United States

Ngs Based Amr Detection Market Usa

The NGS-based AMR Detection Market in the United States is projected to grow at a CAGR of 8.7% between 2025 and 2035, rising from USD 355.8 million in 2025 to USD 819.4 million by 2035. This growth is largely driven by aggressive national efforts to combat antimicrobial resistance, spearheaded by federal initiatives such as the CDC's AR Solutions Initiative, NIH-funded genomic research programs, and interagency collaboration under the National Action Plan for Combating Antibiotic-Resistant Bacteria. Hospitals, public health labs, and pharmaceutical companies are scaling up NGS implementation to support rapid, high-throughput detection of resistance genes directly from clinical isolates and metagenomic samples. A push toward real-time genomic surveillance, AI-enabled analytics, and cloud-integrated sequencing pipelines is further advancing market maturity in the USA

  • Clinical laboratories and hospital microbiology departments are integrating WGS platforms with automated sample preparation systems to accelerate AMR profiling, reduce diagnostic delays, and inform precision antibiotic stewardship.
  • State and federal public health agencies are investing in regional sequencing hubs to facilitate community-level AMR surveillance, outbreak detection, and linkage to epidemiological databases under CDC’s enhanced data modernization strategies.
  • Biotech and pharma companies are increasingly leveraging targeted NGS for AMR biomarker discovery and preclinical testing of novel antibiotics, with emphasis on FDA-aligned sequencing validation and regulatory submission protocols.

Growth and Expansion Outlook for NGS-based AMR Detection Market in the United Kingdom

The NGS-based AMR Detection Market in the United Kingdom is projected to grow at a CAGR of 6.3% through 2035, driven by nationwide efforts to bolster pathogen genomics and antimicrobial stewardship as part of the UK’s Five-Year National Action Plan on AMR (2019-2024) and its post-Brexit health security agenda. The country’s market share within Europe is expected to reach 19.1% by 2035, supported by sustained investments from NHS England and UKHSA (UK Health Security Agency) in decentralized sequencing infrastructure and bioinformatics capabilities. Programs such as the Genomics England Pathogen Genomics Service and NHS-led adoption of WGS in clinical microbiology labs are enhancing the real-time monitoring of drug-resistant infections and community outbreaks.

  • NHS Trust hospitals are expanding their molecular diagnostics capacity by incorporating benchtop NGS platforms into routine workflows, reducing time-to-diagnosis for resistant infections and improving antimicrobial stewardship in inpatient care.
  • Public health agencies under UKHSA are deploying WGS across regional laboratories for surveillance of high-concern AMR pathogens such as carbapenem-resistant Enterobacteriaceae (CRE) and MRSA, with data feeding into national epidemiology platforms.
  • Academic-medical centers and university research hubs are increasing collaborations with biotech firms to develop predictive AMR algorithms using sequencing datasets, aligned with MHRA and NICE digital health priorities.

In-depth Analysis of NGS-based AMR Detection Market in Germany

The NGS-based AMR Detection Market in Germany is projected to grow at a CAGR of 7.6% through 2035, reflecting one of the strongest growth trajectories in Western Europe. Germany is expected to maintain its lead within the European market, increasing its share from 27.9% in 2025 to 28.9% by 2035. The country’s robust healthcare infrastructure, well-funded public health system, and strong regulatory oversight are contributing to accelerated adoption of whole-genome sequencing (WGS) for AMR detection. Backed by federal investments through initiatives like Digital Healthcare Act (DVG) and the Krankenhauszukunftsgesetz (KHZG), hospitals and research centers are upgrading microbiology labs with next-generation sequencing systems to detect resistance determinants in real-time and inform therapeutic strategies.

  • University-affiliated hospitals and teaching clinics are embedding WGS into clinical microbiology protocols, especially for high-risk patient cohorts in intensive care and transplant units. These institutions are also partnering with academic consortia to build AMR sequencing databases tailored to German epidemiology.
  • Regional public health labs (Landesgesundheitsämter) are scaling up pathogen surveillance using standardized NGS workflows, integrated with EUCAST resistance interpretation frameworks and linked to national early warning systems under Germany's AMR strategy.
  • Independent research institutes and biotech companies are increasingly focused on developing Germany-specific AMR panels and AI-enabled data analytics platforms, in line with BfArM and PEI standards for clinical application and software validation.

Moreover, the German healthcare sector’s emphasis on evidence-based infection control, hospital hygiene law (IfSG §23), and rigorous antimicrobial stewardship programs is driving demand for sequencing platforms that deliver actionable, reproducible resistance data.
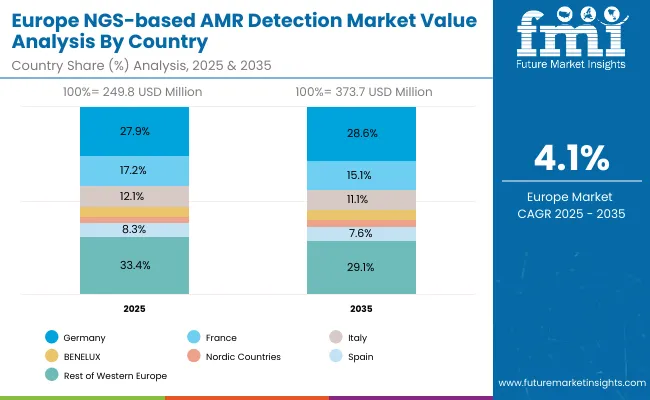
Europe NGS-based AMR Detection Market Value Analysis, By Country

Ngs Based Amr Detection Market Europe

Europe Countries 2025
Germany 27.9%
France 17.2%
Italy 12.1%
BENELUX 6.0%
Nordic Countries 3.4%
Spain 8.3%
Rest of Western Europe 33.4%
Europe Countries 2035
Germany 28.6%
France 15.1%
Italy 11.1%
BENELUX 5.4%
Nordic Countries 3.3%
Spain 7.6%
Rest of Western Europe 29.1%

Market Expansion Outlook for Sterile Prep-Pack Workstation Market in India

The NGS-based AMR Detection Market in India is expected to grow at a CAGR of 7.5% between 2025 and 2035, making it one of the fastest-expanding markets in the Asia Pacific region. This robust growth is being driven by the escalating burden of antimicrobial resistance (AMR), the increasing availability of sequencing technologies, and strong government commitment under the National Action Plan on AMR (NAP-AMR). As India continues to report high rates of multidrug-resistant infections, major hospitals, research institutes, and public health labs are adopting next-generation sequencing (NGS) for faster and more accurate detection of resistance patterns.

Leading public health agencies, including the Indian Council of Medical Research (ICMR) and National Centre for Disease Control (NCDC), have rolled out nationwide AMR surveillance programs that emphasize genomic analysis. Concurrently, India's private diagnostic labs and hospital chains are investing in in-house NGS platforms to enable localized, real-time AMR profiling, especially in ICUs, oncology, and transplant care units.

  • Private tertiary hospitals and lab chains are installing benchtop sequencing platforms to provide faster, high-resolution AMR diagnostics and improve antimicrobial stewardship across departments.
  • Government research institutes and AIIMS-level teaching hospitals are spearheading AMR genomics studies, integrating WGS into pathogen surveillance and outbreak investigation workflows under ICMR-AMRSN.
  • Startups and bioinformatics firms in India are launching region-specific AMR panels and cloud-based interpretation software, making NGS more accessible to mid-sized labs across urban centers.

Sales Outlook for NGS-based AMR Detection Market in China

The NGS-based AMR Detection Market in China is projected to grow at a CAGR of 7.5% between 2025 and 2035, driven by the country’s expanding national genomics infrastructure and heightened focus on combating antimicrobial resistance. Under the Healthy China 2030 policy, China’s National Health Commission (NHC) and Center for Disease Control (CDC China) are ramping up genomic surveillance of AMR pathogens, creating a strong foundation for the widespread integration of next-generation sequencing (NGS) technologies in clinical and public health settings.

High-burden hospital-acquired infections (HAIs), especially involving carbapenem-resistant Enterobacteriaceae (CRE) and multidrug-resistant Pseudomonas aeruginosa, have spurred investments in whole-genome sequencing (WGS) platforms across top-tier hospitals and provincial CDCs. In addition, the Chinese government is funding regional AMR monitoring centers that utilize NGS for resistance gene tracking and outbreak detection.
  • Urban tertiary hospitals, particularly in Beijing, Shanghai, and Guangdong, are adopting high-throughput sequencers for in-house AMR profiling as part of hospital-wide infection control upgrades.
  • Provincial CDCs and public health labs are receiving government-backed equipment grants to implement NGS in routine AMR surveillance, in line with national surveillance mandates.
  • Chinese bioinformatics and medtech startups are developing localized AMR databases and automated interpretation tools to reduce the burden of data complexity, enabling broader adoption in regional and district-level laboratories.

Growth Outlook of NGS-based AMR Detection Market in Japan

Ngs Based Amr Detection Market Japan

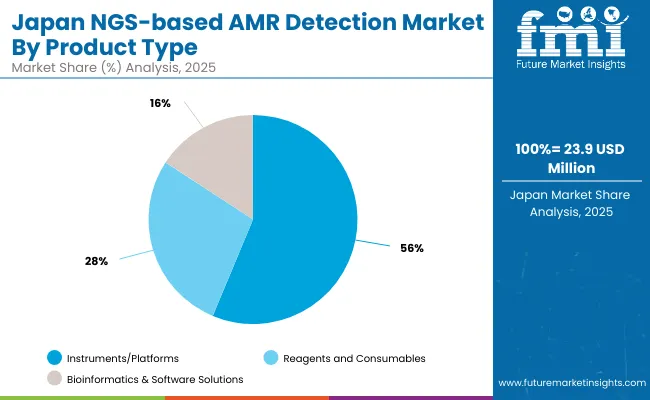
The NGS-based AMR Detection Market in Japan is projected to reach approximately USD 23.8 million in 2025, growing at a CAGR of 6.1%, reflecting a focused but steadily expanding deployment of next-generation sequencing in antimicrobial resistance (AMR) detection primarily driven by public health initiatives and a precision medicine framework.

Japan’s growing concern over multidrug-resistant organisms (MDROs), especially in aging and immunocompromised populations, has prompted hospitals and public health agencies to invest in Whole-Genome Sequencing (WGS) tools, which dominate the technology segment with 72.1% share. This trend is further reinforced by government-backed surveillance programs like the Japan Nosocomial Infections Surveillance (JANIS), which increasingly utilize NGS data for resistance gene tracking and outbreak source identification.
  • Market in Japan holds 2.9% revenue share of the global market in 2025
  • Instruments/Platforms dominates other Product Type due to high installation rate.
  • Private laboratories and pharmaceutical firms are using targeted NGS for drug-resistance profiling in clinical trials and translational research, particularly in tuberculosis, gonorrhea, and bloodstream infections.

Opportunity Analysis of South Korea in NGS-based AMR Detection Market

Ngs Based Amr Detection Market Southokorea

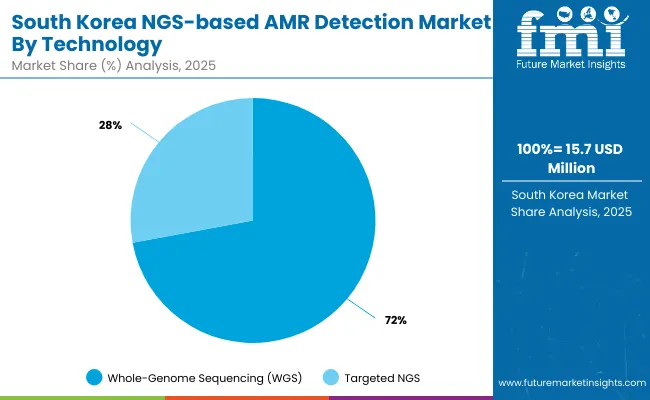
The NGS-based AMR Detection Market in South Korea is projected to reach USD 15.6 million in 2025, growing to USD 25.01 million by 2035, with a forecast CAGR of 4.8%. Though relatively smaller in size compared to Western counterparts, South Korea represents a strategically important market within the Asia-Pacific region, driven by robust national healthcare IT systems, universal health coverage, and increasing investment in infectious disease surveillance.

  • Market size for South Korea in 2025 is USD 15.65 million
  • South Korea holds 1.9% of the Global Market.
  • Clinical Diagnostics continues to account for the largest application share in the country 59.1% as of 2025 supported by government-led hospital modernization programs and national mandates for antimicrobial resistance (AMR) testing.

Competition Landscape

The global NGS-based AMR Detection Market is moderately consolidated, with a mix of leading sequencing platform providers, molecular diagnostics companies, and niche AMR-focused biotech firms. The competitive environment is shaped by continual innovations in sequencing accuracy, bioinformatics pipelines, and regulatory-aligned diagnostic offerings.

Illumina, holding the largest individual market share at 31.4% in 2025, dominates the market with its widely adopted sequencing platforms such as the NextSeq and MiSeq systems. Its leadership is reinforced by high-throughput capabilities, strong distribution channels, and end-to-end bioinformatics tools tailored for microbial resistance gene analysis. Illumina’s continued investment in clinical-grade sequencing and partnerships with public health agencies (e.g., CDC’s AMD program) strengthens its position in AMR surveillance and hospital diagnostics.

Thermo Fisher Scientific, QIAGEN, and bioMérieux are key established players providing integrated workflows that combine sequencing platforms, sample prep kits, and informatics tailored to infectious disease diagnostics. Thermo Fisher’s Ion Torrent platforms are leveraged in both research and regulated diagnostics, while QIAGEN offers targeted panels and pathogen-specific AMR detection kits. bioMérieux continues to enhance its AMR footprint through sequencing-linked pathogen ID and resistance profiling, supported by its acquisition of companies such as BioFire and Invisible Sentinel.

Mid-sized firms like CD Genomics, Diagnostics Longwood SL, and Credence Genomics are gaining traction through cost-competitive sequencing services, customized AMR panels, and bioinformatics solutions for low- and middle-income country (LMIC) markets. These companies often work with local governments and research institutes to build AMR surveillance capacity at the population level.

Fraunhofer IGB and other emerging academic and public research institutions are contributing through open-source bioinformatics tools and regional pilot programs. Their work focuses on decentralized AMR tracking and novel detection methods-particularly in the context of zoonotic and environmental resistomes.

Key Developments

  • In 2024, OpGen, Inc., announced that its group company and wholly owned subsidiary Ares Genetics GmbH launched an early access program for its novel, NGS-based molecular antibiotic resistance (AMR) test for comprehensive profiling of genetic AMR markers from native specimen by a hybrid-capture based targeted NGS assay..
  • In 2025, Cepheid has announced a strategic partnership with the Fleming Initiative, a global collaboration spearheaded by Imperial College Healthcare NHS Trust and Imperial College London, aimed at combating the escalating threat of antimicrobial resistance (AMR).

Scope of the Report

Item Value
Quantitative Units USD 823.7 million
Product type Instruments/Platforms, Reagents and Consumables, and Bioinformatics & Software Solutions
Technology Whole-Genome Sequencing (WGS) and Targeted NGS
Application Clinical Diagnostics, Public Health & Surveillance, Pharma/R&D and Academic & Research Use
End User Ho spitals & Clinical Laboratories, Public Health Agencies & Reference Labs, Pharmaceutical & Biotechnology Companies and Academic & Research Institutes
Regions Covered North America, Latin America, Western & Eastern Europe, East Asia, South Asia & Pacific, Middle East & Africa
Countries Covered USA, Brazil, China, India, Germany, France, UK etc.
Key Companies Profiled Illumina, QIAGEN, Thermo Fisher Scientific, BIOMÉRIEUX, Abbott, ACRO Biosystems, CD Genomics., Diagnostics Longwood SL, Credence Genomics, and Fraunhofer IGB
Additional Attributes Dollar sales by Product Type and region s, adoption trends of Integration of AI-Driven Bioinformatics and Cloud-Based Analytics, and Rising Incidence of Antimicrobial Resistance (AMR)

Key Segments

By Product Type:

  • Instruments/Platforms
  • Reagents and Consumables
  • Bioinformatics & Software Solutions

By Technology:

  • Whole-Genome Sequencing (WGS)
  • Targeted NGS

By Application:

  • Clinical Diagnostics
  • Public Health & Surveillance
  • Pharma/R&D
  • Academic & Research Use

By End User:

  • Hospitals & Clinical Laboratories
  • Public Health Agencies & Reference Labs
  • Pharmaceutical & Biotechnology Companies
  • Academic & Research Institutes

By Region:

  • North America
  • Latin America
  • Western Europe
  • Eastern Europe
  • East Asia
  • South Asia
  • MEA

Table of Content

  1. Executive Summary
    • Global Market Outlook
    • Demand-side Trends
    • Supply-side Trends
    • Technology Roadmap Analysis
    • Analysis and Recommendations
  2. Market Overview
    • Market Coverage / Taxonomy
    • Market Definition / Scope / Limitations
  3. Market Background
    • Market Dynamics
      • Drivers
      • Restraints
      • Opportunity
      • Trends
    • Scenario Forecast
      • Demand in Optimistic Scenario
      • Demand in Likely Scenario
      • Demand in Conservative Scenario
    • Opportunity Map Analysis
    • Product Life Cycle Analysis
    • Technological Advancement
    • Investment Feasibility Matrix
    • PESTLE and Porter’s Analysis
    • Regulatory Landscape
  4. By Key Regions
  5. By Key Countries
    • Regional Parent Market Outlook
    • Recent Prouct Launches/Approvals
  6. Global Market Analysis 2020 to 2024 and Forecast, 2025 to 2035
    • Historical Market Size Value (USD Million) & Volume (Units) Analysis, 2020 to 2024
    • Current and Future Market Size Value (USD Million) & Volume (Units) Projections, 2025 to 2035
      • Y-o-Y Growth Trend Analysis
      • Absolute $ Opportunity Analysis
  7. Global Market Analysis 2020 to 2024 and Forecast 2025 to 2035, By Product Type
    • Introduction / Key Findings
    • Historical Market Size Value (USD Million) & Volume (Units) Analysis By Product Type, 2020 to 2024
    • Current and Future Market Size Value (USD Million) & Volume (Units) Analysis and Forecast By Product Type, 2025 to 2035
      • Instruments/Platforms
      • Reagents and Consumables
      • Bioinformatics & Software Solutions
    • Y-o-Y Growth Trend Analysis By Product Type, 2020 to 2024
    • Absolute $ Opportunity Analysis By Product Type, 2025 to 2035
  8. Global Market Analysis 2020 to 2024 and Forecast 2025 to 2035, By Technology
    • Introduction / Key Findings
    • Historical Market Size Value (USD Million) & Volume (Units) Analysis By Technology, 2020 to 2024
    • Current and Future Market Size Value (USD Million) & Volume (Units) Analysis and Forecast By Technology, 2025 to 2035
      • Whole-Genome Sequencing (WGS)
      • Targeted NGS
    • Y-o-Y Growth Trend Analysis By Technology, 2020 to 2024
    • Absolute $ Opportunity Analysis By Technology, 2025 to 2035
  9. Global Market Analysis 2020 to 2024 and Forecast 2025 to 2035, By Application
    • Introduction / Key Findings
    • Historical Market Size Value (USD Million) & Volume (Units) Analysis By Application, 2020 to 2024
    • Current and Future Market Size Value (USD Million) & Volume (Units) Analysis and Forecast By Application, 2025 to 2035
      • Clinical Diagnostics
      • Public Health & Surveillance
      • Pharma/R&D
      • Academic & Research Use
  10. Others
    • Y-o-Y Growth Trend Analysis By Application, 2020 to 2024
    • Absolute $ Opportunity Analysis By Application, 2025 to 2035
  11. Global Market Analysis 2020 to 2024 and Forecast 2025 to 2035, By End User
    • Introduction / Key Findings
    • Historical Market Size Value (USD Million) & Volume (Units) Analysis By End User, 2020 to 2024
    • Current and Future Market Size Value (USD Million) & Volume (Units) Analysis and Forecast By End User, 2025 to 2035
      • Hospitals & Clinical Laboratories
      • Public Health Agencies & Reference Labs
      • Pharmaceutical & Biotechnology Companies
      • Academic & Research Institutes
    • Y-o-Y Growth Trend Analysis By End User, 2020 to 2024
    • Absolute $ Opportunity Analysis By End User, 2025 to 2035
  12. Global Market Analysis 2020 to 2024 and Forecast 2025 to 2035, By Region
    • Introduction
    • Historical Market Size Value (USD Million) & Volume (Units) Analysis By Region, 2020 to 2024
    • Current Market Size Value (USD Million) & Volume (Units) Analysis and Forecast By Region, 2025 to 2035
      • North America
      • Latin America
      • Western Europe
      • Eastern Europe
      • East Asia
      • South Asia
      • MEA
    • Market Attractiveness Analysis By Region
  13. North America Market Analysis 2020 to 2024 and Forecast 2025 to 2035, By Country
    • Historical Market Size Value (USD Million) & Volume (Units) Trend Analysis By Market Taxonomy, 2020 to 2024
    • Market Size Value (USD Million) & Volume (Units) Forecast By Market Taxonomy, 2025 to 2035
      • By Country
        • USA
        • Canada
        • Mexico
      • By Product Type
      • By Technology
      • By Application
      • By End User
    • Market Attractiveness Analysis
      • By Country
      • By Product Type
      • By Technology
      • By Application
      • By End User
    • Key Takeaways
  14. Latin America Market Analysis 2020 to 2024 and Forecast 2025 to 2035, By Country
    • Historical Market Size Value (USD Million) & Volume (Units) Trend Analysis By Market Taxonomy, 2020 to 2024
    • Market Size Value (USD Million) & Volume (Units) Forecast By Market Taxonomy, 2025 to 2035
      • By Country
        • Brazil
        • Argentina
        • Rest of Latin America
      • By Product Type
      • By Technology
      • By Application
      • By End User
    • Market Attractiveness Analysis
      • By Country
      • By Product Type
      • By Technology
      • By Application
      • By End User
    • Key Takeaways
  15. Western Europe Market Analysis 2020 to 2024 and Forecast 2025 to 2035, By Country
    • Historical Market Size Value (USD Million) & Volume (Units) Trend Analysis By Market Taxonomy, 2020 to 2024
    • Market Size Value (USD Million) & Volume (Units) Forecast By Market Taxonomy, 2025 to 2035
      • By Country
        • Germany
        • Italy
        • France
        • UK
        • Spain
        • BENELUX
        • Nordic Countries
        • Rest of Western Europe
      • By Product Type
      • By Technology
      • By Application
      • By End User
    • Market Attractiveness Analysis
      • By Country
      • By Product Type
      • By Technology
      • By Application
      • By End User
    • Key Takeaways
  16. Eastern Europe Market Analysis 2020 to 2024 and Forecast 2025 to 2035, By Country
    • Historical Market Size Value (USD Million) & Volume (Units) Trend Analysis By Market Taxonomy, 2020 to 2024
    • Market Size Value (USD Million) & Volume (Units) Forecast By Market Taxonomy, 2025 to 2035
      • By Country
        • Russia
        • Hungry
        • Poland
        • Rest of Eastern Europe
      • By Product Type
      • By Technology
      • By Application
      • By End User
    • Market Attractiveness Analysis
      • By Country
      • By Product Type
      • By Technology
      • By Application
      • By End User
    • Key Takeaways
  17. East Asia Market Analysis 2020 to 2024 and Forecast 2025 to 2035, By Country
    • Historical Market Size Value (USD Million) & Volume (Units) Trend Analysis By Market Taxonomy, 2020 to 2024
    • Market Size Value (USD Million) & Volume (Units) Forecast By Market Taxonomy, 2025 to 2035
      • By Country
        • China
        • Japan
        • South Korea
      • By Product Type
      • By Technology
      • By Application
      • By End User
    • Market Attractiveness Analysis
      • By Country
      • By Product Type
      • By Technology
      • By Application
      • By End User
    • Key Takeaways
  18. South Asia Market Analysis 2020 to 2024 and Forecast 2025 to 2035, By Country
    • Historical Market Size Value (USD Million) & Volume (Units) Trend Analysis By Market Taxonomy, 2020 to 2024
    • Market Size Value (USD Million) & Volume (Units) Forecast By Market Taxonomy, 2025 to 2035
      • By Country
        • India
        • ASEAN Countries
        • Australia & New Zealand
        • Rest of South Asia
      • By Product Type
      • By Technology
      • By Application
      • By End User
    • Market Attractiveness Analysis
      • By Country
      • By Product Type
      • By Technology
      • By Application
      • By End User
    • Key Takeaways
  19. MEA Market Analysis 2020 to 2024 and Forecast 2025 to 2035, By Country
    • Historical Market Size Value (USD Million) & Volume (Units) Trend Analysis By Market Taxonomy, 2020 to 2024
    • Market Size Value (USD Million) & Volume (Units) Forecast By Market Taxonomy, 2025 to 2035
      • By Country
        • Saudi Arabia
        • Türkiye
        • South Africa
        • Other African Union
        • Rest of MEA
      • By Product Type
      • By Technology
      • By Application
      • By End User
    • Market Attractiveness Analysis
      • By Country
      • By Product Type
      • By Technology
      • By Application
      • By End User
    • Key Takeaways
  20. Key Countries Market Analysis
    • USA
      • Pricing Analysis
      • Market Share Analysis, 2024
        • By Product Type
        • By Technology
        • By Application
        • By End User
    • Brazil
      • Pricing Analysis
      • Market Share Analysis, 2024
        • By Product Type
        • By Technology
        • By Application
        • By End User
    • China
      • Pricing Analysis
      • Market Share Analysis, 2024
        • By Product Type
        • By Technology
        • By Application
        • By End User
    • India
      • Pricing Analysis
      • Market Share Analysis, 2024
        • By Product Type
        • By Technology
        • By Application
        • By End User
    • Europe
      • Pricing Analysis
      • Market Share Analysis, 2024
        • By Product Type
        • By Technology
        • By Application
        • By End User
    • Germany
      • Pricing Analysis
      • Market Share Analysis, 2024
        • By Product Type
        • By Technology
        • By Application
        • By End User
    • France
      • Pricing Analysis
      • Market Share Analysis, 2024
        • By Product Type
        • By Technology
        • By Application
        • By End User
    • UK
      • Pricing Analysis
      • Market Share Analysis, 2024
        • By Product Type
        • By Technology
        • By Application
        • By End User
  21. Market Structure Analysis
    • Competition Dashboard
    • Competition Benchmarking
    • Market Share Analysis of Top Players
      • By Regional
      • By Product Type
      • By Technology
      • By Application
      • By End User
  22. Competition Analysis
    • Competition Deep Dive
      • Illumina
        • Overview
        • Product Portfolio
        • Profitability by Market Segments (Product/Age /Sales Channel/Region)
        • Sales Footprint
        • Strategy Overview
          • Marketing Strategy
          • Product Strategy
          • Channel Strategy
      • QIAGEN
        • Overview
        • Product Portfolio
        • Profitability by Market Segments (Product/Age /Sales Channel/Region)
        • Sales Footprint
        • Strategy Overview
          • Marketing Strategy
          • Product Strategy
          • Channel Strategy
      • Thermo Fisher Scientific
        • Overview
        • Product Portfolio
        • Profitability by Market Segments (Product/Age /Sales Channel/Region)
        • Sales Footprint
        • Strategy Overview
          • Marketing Strategy
          • Product Strategy
          • Channel Strategy
      • BIOMÉRIEUX
        • Overview
        • Product Portfolio
        • Profitability by Market Segments (Product/Age /Sales Channel/Region)
        • Sales Footprint
        • Strategy Overview
          • Marketing Strategy
          • Product Strategy
          • Channel Strategy
      • Abbott
        • Overview
        • Product Portfolio
        • Profitability by Market Segments (Product/Age /Sales Channel/Region)
        • Sales Footprint
        • Strategy Overview
          • Marketing Strategy
          • Product Strategy
          • Channel Strategy
      • ACROBiosystems
        • Overview
        • Product Portfolio
        • Profitability by Market Segments (Product/Age /Sales Channel/Region)
        • Sales Footprint
        • Strategy Overview
          • Marketing Strategy
          • Product Strategy
          • Channel Strategy
      • CD Genomics.
        • Overview
        • Product Portfolio
        • Profitability by Market Segments (Product/Age /Sales Channel/Region)
        • Sales Footprint
        • Strategy Overview
          • Marketing Strategy
          • Product Strategy
          • Channel Strategy
      • Diagnostics Longwood SL
        • Overview
        • Product Portfolio
        • Profitability by Market Segments (Product/Age /Sales Channel/Region)
        • Sales Footprint
        • Strategy Overview
          • Marketing Strategy
          • Product Strategy
          • Channel Strategy
      • Credence Genomics
        • Overview
        • Product Portfolio
        • Profitability by Market Segments (Product/Age /Sales Channel/Region)
        • Sales Footprint
        • Strategy Overview
          • Marketing Strategy
          • Product Strategy
          • Channel Strategy
      • Fraunhofer IGB
        • Overview
        • Product Portfolio
        • Profitability by Market Segments (Product/Age /Sales Channel/Region)
        • Sales Footprint
        • Strategy Overview
          • Marketing Strategy
          • Product Strategy
          • Channel Strategy
  23. Assumptions & Acronyms Used
  24. Research Methodology

List of Tables

  • Table 1: Global Market Value (USD Million) Forecast by Region, 2020-2035
  • Table 2: Global Market Volume (Units) Forecast by Region, 2020-2035
  • Table 3: Global Market Value (USD Million) Forecast by Product Type, 2020-2035
  • Table 4: Global Market Volume (Units) Forecast by Product Type, 2020-2035
  • Table 5: Global Market Value (USD Million) Forecast by Technology, 2020-2035
  • Table 6: Global Market Volume (Units) Forecast by Technology, 2020-2035
  • Table 7: Global Market Value (USD Million) Forecast by Application, 2020-2035
  • Table 8: Global Market Volume (Units) Forecast by Application, 2020-2035
  • Table 9: Global Market Value (USD Million) Forecast by End User, 2020-2035
  • Table 10: Global Market Volume (Units) Forecast by End User, 2020-2035
  • Table 11: North America Market Value (USD Million) Forecast by Country, 2020-2035
  • Table 12: North America Market Volume (Units) Forecast by Country, 2020-2035
  • Table 13: North America Market Value (USD Million) Forecast by Product Type, 2020-2035
  • Table 14: North America Market Volume (Units) Forecast by Product Type, 2020-2035
  • Table 15: North America Market Value (USD Million) Forecast by Technology, 2020-2035
  • Table 16: North America Market Volume (Units) Forecast by Technology, 2020-2035
  • Table 17: North America Market Value (USD Million) Forecast by Application, 2020-2035
  • Table 18: North America Market Volume (Units) Forecast by Application, 2020-2035
  • Table 19: North America Market Value (USD Million) Forecast by End User, 2020-2035
  • Table 20: North America Market Volume (Units) Forecast by End User, 2020-2035
  • Table 21: Latin America Market Value (USD Million) Forecast by Country, 2020-2035
  • Table 22: Latin America Market Volume (Units) Forecast by Country, 2020-2035
  • Table 23: Latin America Market Value (USD Million) Forecast by Product Type, 2020-2035
  • Table 24: Latin America Market Volume (Units) Forecast by Product Type, 2020-2035
  • Table 25: Latin America Market Value (USD Million) Forecast by Technology, 2020-2035
  • Table 26: Latin America Market Volume (Units) Forecast by Technology, 2020-2035
  • Table 27: Latin America Market Value (USD Million) Forecast by Application, 2020-2035
  • Table 28: Latin America Market Volume (Units) Forecast by Application, 2020-2035
  • Table 29: Latin America Market Value (USD Million) Forecast by End User, 2020-2035
  • Table 30: Latin America Market Volume (Units) Forecast by End User, 2020-2035
  • Table 31: Western Europe Market Value (USD Million) Forecast by Country, 2020-2035
  • Table 32: Western Europe Market Volume (Units) Forecast by Country, 2020-2035
  • Table 33: Western Europe Market Value (USD Million) Forecast by Product Type, 2020-2035
  • Table 34: Western Europe Market Volume (Units) Forecast by Product Type, 2020-2035
  • Table 35: Western Europe Market Value (USD Million) Forecast by Technology, 2020-2035
  • Table 36: Western Europe Market Volume (Units) Forecast by Technology, 2020-2035
  • Table 37: Western Europe Market Value (USD Million) Forecast by Application, 2020-2035
  • Table 38: Western Europe Market Volume (Units) Forecast by Application, 2020-2035
  • Table 39: Western Europe Market Value (USD Million) Forecast by End User, 2020-2035
  • Table 40: Western Europe Market Volume (Units) Forecast by End User, 2020-2035
  • Table 41: Eastern Europe Market Value (USD Million) Forecast by Country, 2020-2035
  • Table 42: Eastern Europe Market Volume (Units) Forecast by Country, 2020-2035
  • Table 43: Eastern Europe Market Value (USD Million) Forecast by Product Type, 2020-2035
  • Table 44: Eastern Europe Market Volume (Units) Forecast by Product Type, 2020-2035
  • Table 45: Eastern Europe Market Value (USD Million) Forecast by Technology, 2020-2035
  • Table 46: Eastern Europe Market Volume (Units) Forecast by Technology, 2020-2035
  • Table 47: Eastern Europe Market Value (USD Million) Forecast by Application, 2020-2035
  • Table 48: Eastern Europe Market Volume (Units) Forecast by Application, 2020-2035
  • Table 49: Eastern Europe Market Value (USD Million) Forecast by End User, 2020-2035
  • Table 50: Eastern Europe Market Volume (Units) Forecast by End User, 2020-2035
  • Table 51: East Asia Market Value (USD Million) Forecast by Country, 2020-2035
  • Table 52: East Asia Market Volume (Units) Forecast by Country, 2020-2035
  • Table 53: East Asia Market Value (USD Million) Forecast by Product Type, 2020-2035
  • Table 54: East Asia Market Volume (Units) Forecast by Product Type, 2020-2035
  • Table 55: East Asia Market Value (USD Million) Forecast by Technology, 2020-2035
  • Table 56: East Asia Market Volume (Units) Forecast by Technology, 2020-2035
  • Table 57: East Asia Market Value (USD Million) Forecast by Application, 2020-2035
  • Table 58: East Asia Market Volume (Units) Forecast by Application, 2020-2035
  • Table 59: East Asia Market Value (USD Million) Forecast by End User, 2020-2035
  • Table 60: East Asia Market Volume (Units) Forecast by End User, 2020-2035
  • Table 61: South Asia Market Value (USD Million) Forecast by Country, 2020-2035
  • Table 62: South Asia Market Volume (Units) Forecast by Country, 2020-2035
  • Table 63: South Asia Market Value (USD Million) Forecast by Product Type, 2020-2035
  • Table 64: South Asia Market Volume (Units) Forecast by Product Type, 2020-2035
  • Table 65: South Asia Market Value (USD Million) Forecast by Technology, 2020-2035
  • Table 66: South Asia Market Volume (Units) Forecast by Technology, 2020-2035
  • Table 67: South Asia Market Value (USD Million) Forecast by Application, 2020-2035
  • Table 68: South Asia Market Volume (Units) Forecast by Application, 2020-2035
  • Table 69: South Asia Market Value (USD Million) Forecast by End User, 2020-2035
  • Table 70: South Asia Market Volume (Units) Forecast by End User, 2020-2035
  • Table 71: MEA Market Value (USD Million) Forecast by Country, 2020-2035
  • Table 72: MEA Market Volume (Units) Forecast by Country, 2020-2035
  • Table 73: MEA Market Value (USD Million) Forecast by Product Type, 2020-2035
  • Table 74: MEA Market Volume (Units) Forecast by Product Type, 2020-2035
  • Table 75: MEA Market Value (USD Million) Forecast by Technology, 2020-2035
  • Table 76: MEA Market Volume (Units) Forecast by Technology, 2020-2035
  • Table 77: MEA Market Value (USD Million) Forecast by Application, 2020-2035
  • Table 78: MEA Market Volume (Units) Forecast by Application, 2020-2035
  • Table 79: MEA Market Value (USD Million) Forecast by End User, 2020-2035
  • Table 80: MEA Market Volume (Units) Forecast by End User, 2020-2035

List of Figures

  • Figure 1: Global Market Value (USD Million) by Product Type, 2025-2035
  • Figure 2: Global Market Value (USD Million) by Technology, 2025-2035
  • Figure 3: Global Market Value (USD Million) by Application, 2025-2035
  • Figure 4: Global Market Value (USD Million) by End User, 2025-2035
  • Figure 5: Global Market Value (USD Million) by Region, 2025-2035
  • Figure 6: Global Market Value (USD Million) Analysis by Region, 2020-2035
  • Figure 7: Global Market Volume (Units) Analysis by Region, 2020-2035
  • Figure 8: Global Market Value Share (%) and BPS Analysis by Region, 2025-2035
  • Figure 9: Global Market Y-o-Y Growth (%) Projections by Region, 2025-2035
  • Figure 10: Global Market Value (USD Million) Analysis by Product Type, 2020-2035
  • Figure 11: Global Market Volume (Units) Analysis by Product Type, 2020-2035
  • Figure 12: Global Market Value Share (%) and BPS Analysis by Product Type, 2025-2035
  • Figure 13: Global Market Y-o-Y Growth (%) Projections by Product Type, 2025-2035
  • Figure 14: Global Market Value (USD Million) Analysis by Technology, 2020-2035
  • Figure 15: Global Market Volume (Units) Analysis by Technology, 2020-2035
  • Figure 16: Global Market Value Share (%) and BPS Analysis by Technology, 2025-2035
  • Figure 17: Global Market Y-o-Y Growth (%) Projections by Technology, 2025-2035
  • Figure 18: Global Market Value (USD Million) Analysis by Application, 2020-2035
  • Figure 19: Global Market Volume (Units) Analysis by Application, 2020-2035
  • Figure 20: Global Market Value Share (%) and BPS Analysis by Application, 2025-2035
  • Figure 21: Global Market Y-o-Y Growth (%) Projections by Application, 2025-2035
  • Figure 22: Global Market Value (USD Million) Analysis by End User, 2020-2035
  • Figure 23: Global Market Volume (Units) Analysis by End User, 2020-2035
  • Figure 24: Global Market Value Share (%) and BPS Analysis by End User, 2025-2035
  • Figure 25: Global Market Y-o-Y Growth (%) Projections by End User, 2025-2035
  • Figure 26: Global Market Attractiveness by Product Type, 2025-2035
  • Figure 27: Global Market Attractiveness by Technology, 2025-2035
  • Figure 28: Global Market Attractiveness by Application, 2025-2035
  • Figure 29: Global Market Attractiveness by End User, 2025-2035
  • Figure 30: Global Market Attractiveness by Region, 2025-2035
  • Figure 31: North America Market Value (USD Million) by Product Type, 2025-2035
  • Figure 32: North America Market Value (USD Million) by Technology, 2025-2035
  • Figure 33: North America Market Value (USD Million) by Application, 2025-2035
  • Figure 34: North America Market Value (USD Million) by End User, 2025-2035
  • Figure 35: North America Market Value (USD Million) by Country, 2025-2035
  • Figure 36: North America Market Value (USD Million) Analysis by Country, 2020-2035
  • Figure 37: North America Market Volume (Units) Analysis by Country, 2020-2035
  • Figure 38: North America Market Value Share (%) and BPS Analysis by Country, 2025-2035
  • Figure 39: North America Market Y-o-Y Growth (%) Projections by Country, 2025-2035
  • Figure 40: North America Market Value (USD Million) Analysis by Product Type, 2020-2035
  • Figure 41: North America Market Volume (Units) Analysis by Product Type, 2020-2035
  • Figure 42: North America Market Value Share (%) and BPS Analysis by Product Type, 2025-2035
  • Figure 43: North America Market Y-o-Y Growth (%) Projections by Product Type, 2025-2035
  • Figure 44: North America Market Value (USD Million) Analysis by Technology, 2020-2035
  • Figure 45: North America Market Volume (Units) Analysis by Technology, 2020-2035
  • Figure 46: North America Market Value Share (%) and BPS Analysis by Technology, 2025-2035
  • Figure 47: North America Market Y-o-Y Growth (%) Projections by Technology, 2025-2035
  • Figure 48: North America Market Value (USD Million) Analysis by Application, 2020-2035
  • Figure 49: North America Market Volume (Units) Analysis by Application, 2020-2035
  • Figure 50: North America Market Value Share (%) and BPS Analysis by Application, 2025-2035
  • Figure 51: North America Market Y-o-Y Growth (%) Projections by Application, 2025-2035
  • Figure 52: North America Market Value (USD Million) Analysis by End User, 2020-2035
  • Figure 53: North America Market Volume (Units) Analysis by End User, 2020-2035
  • Figure 54: North America Market Value Share (%) and BPS Analysis by End User, 2025-2035
  • Figure 55: North America Market Y-o-Y Growth (%) Projections by End User, 2025-2035
  • Figure 56: North America Market Attractiveness by Product Type, 2025-2035
  • Figure 57: North America Market Attractiveness by Technology, 2025-2035
  • Figure 58: North America Market Attractiveness by Application, 2025-2035
  • Figure 59: North America Market Attractiveness by End User, 2025-2035
  • Figure 60: North America Market Attractiveness by Country, 2025-2035
  • Figure 61: Latin America Market Value (USD Million) by Product Type, 2025-2035
  • Figure 62: Latin America Market Value (USD Million) by Technology, 2025-2035
  • Figure 63: Latin America Market Value (USD Million) by Application, 2025-2035
  • Figure 64: Latin America Market Value (USD Million) by End User, 2025-2035
  • Figure 65: Latin America Market Value (USD Million) by Country, 2025-2035
  • Figure 66: Latin America Market Value (USD Million) Analysis by Country, 2020-2035
  • Figure 67: Latin America Market Volume (Units) Analysis by Country, 2020-2035
  • Figure 68: Latin America Market Value Share (%) and BPS Analysis by Country, 2025-2035
  • Figure 69: Latin America Market Y-o-Y Growth (%) Projections by Country, 2025-2035
  • Figure 70: Latin America Market Value (USD Million) Analysis by Product Type, 2020-2035
  • Figure 71: Latin America Market Volume (Units) Analysis by Product Type, 2020-2035
  • Figure 72: Latin America Market Value Share (%) and BPS Analysis by Product Type, 2025-2035
  • Figure 73: Latin America Market Y-o-Y Growth (%) Projections by Product Type, 2025-2035
  • Figure 74: Latin America Market Value (USD Million) Analysis by Technology, 2020-2035
  • Figure 75: Latin America Market Volume (Units) Analysis by Technology, 2020-2035
  • Figure 76: Latin America Market Value Share (%) and BPS Analysis by Technology, 2025-2035
  • Figure 77: Latin America Market Y-o-Y Growth (%) Projections by Technology, 2025-2035
  • Figure 78: Latin America Market Value (USD Million) Analysis by Application, 2020-2035
  • Figure 79: Latin America Market Volume (Units) Analysis by Application, 2020-2035
  • Figure 80: Latin America Market Value Share (%) and BPS Analysis by Application, 2025-2035
  • Figure 81: Latin America Market Y-o-Y Growth (%) Projections by Application, 2025-2035
  • Figure 82: Latin America Market Value (USD Million) Analysis by End User, 2020-2035
  • Figure 83: Latin America Market Volume (Units) Analysis by End User, 2020-2035
  • Figure 84: Latin America Market Value Share (%) and BPS Analysis by End User, 2025-2035
  • Figure 85: Latin America Market Y-o-Y Growth (%) Projections by End User, 2025-2035
  • Figure 86: Latin America Market Attractiveness by Product Type, 2025-2035
  • Figure 87: Latin America Market Attractiveness by Technology, 2025-2035
  • Figure 88: Latin America Market Attractiveness by Application, 2025-2035
  • Figure 89: Latin America Market Attractiveness by End User, 2025-2035
  • Figure 90: Latin America Market Attractiveness by Country, 2025-2035
  • Figure 91: Western Europe Market Value (USD Million) by Product Type, 2025-2035
  • Figure 92: Western Europe Market Value (USD Million) by Technology, 2025-2035
  • Figure 93: Western Europe Market Value (USD Million) by Application, 2025-2035
  • Figure 94: Western Europe Market Value (USD Million) by End User, 2025-2035
  • Figure 95: Western Europe Market Value (USD Million) by Country, 2025-2035
  • Figure 96: Western Europe Market Value (USD Million) Analysis by Country, 2020-2035
  • Figure 97: Western Europe Market Volume (Units) Analysis by Country, 2020-2035
  • Figure 98: Western Europe Market Value Share (%) and BPS Analysis by Country, 2025-2035
  • Figure 99: Western Europe Market Y-o-Y Growth (%) Projections by Country, 2025-2035
  • Figure 100: Western Europe Market Value (USD Million) Analysis by Product Type, 2020-2035
  • Figure 101: Western Europe Market Volume (Units) Analysis by Product Type, 2020-2035
  • Figure 102: Western Europe Market Value Share (%) and BPS Analysis by Product Type, 2025-2035
  • Figure 103: Western Europe Market Y-o-Y Growth (%) Projections by Product Type, 2025-2035
  • Figure 104: Western Europe Market Value (USD Million) Analysis by Technology, 2020-2035
  • Figure 105: Western Europe Market Volume (Units) Analysis by Technology, 2020-2035
  • Figure 106: Western Europe Market Value Share (%) and BPS Analysis by Technology, 2025-2035
  • Figure 107: Western Europe Market Y-o-Y Growth (%) Projections by Technology, 2025-2035
  • Figure 108: Western Europe Market Value (USD Million) Analysis by Application, 2020-2035
  • Figure 109: Western Europe Market Volume (Units) Analysis by Application, 2020-2035
  • Figure 110: Western Europe Market Value Share (%) and BPS Analysis by Application, 2025-2035
  • Figure 111: Western Europe Market Y-o-Y Growth (%) Projections by Application, 2025-2035
  • Figure 112: Western Europe Market Value (USD Million) Analysis by End User, 2020-2035
  • Figure 113: Western Europe Market Volume (Units) Analysis by End User, 2020-2035
  • Figure 114: Western Europe Market Value Share (%) and BPS Analysis by End User, 2025-2035
  • Figure 115: Western Europe Market Y-o-Y Growth (%) Projections by End User, 2025-2035
  • Figure 116: Western Europe Market Attractiveness by Product Type, 2025-2035
  • Figure 117: Western Europe Market Attractiveness by Technology, 2025-2035
  • Figure 118: Western Europe Market Attractiveness by Application, 2025-2035
  • Figure 119: Western Europe Market Attractiveness by End User, 2025-2035
  • Figure 120: Western Europe Market Attractiveness by Country, 2025-2035
  • Figure 121: Eastern Europe Market Value (USD Million) by Product Type, 2025-2035
  • Figure 122: Eastern Europe Market Value (USD Million) by Technology, 2025-2035
  • Figure 123: Eastern Europe Market Value (USD Million) by Application, 2025-2035
  • Figure 124: Eastern Europe Market Value (USD Million) by End User, 2025-2035
  • Figure 125: Eastern Europe Market Value (USD Million) by Country, 2025-2035
  • Figure 126: Eastern Europe Market Value (USD Million) Analysis by Country, 2020-2035
  • Figure 127: Eastern Europe Market Volume (Units) Analysis by Country, 2020-2035
  • Figure 128: Eastern Europe Market Value Share (%) and BPS Analysis by Country, 2025-2035
  • Figure 129: Eastern Europe Market Y-o-Y Growth (%) Projections by Country, 2025-2035
  • Figure 130: Eastern Europe Market Value (USD Million) Analysis by Product Type, 2020-2035
  • Figure 131: Eastern Europe Market Volume (Units) Analysis by Product Type, 2020-2035
  • Figure 132: Eastern Europe Market Value Share (%) and BPS Analysis by Product Type, 2025-2035
  • Figure 133: Eastern Europe Market Y-o-Y Growth (%) Projections by Product Type, 2025-2035
  • Figure 134: Eastern Europe Market Value (USD Million) Analysis by Technology, 2020-2035
  • Figure 135: Eastern Europe Market Volume (Units) Analysis by Technology, 2020-2035
  • Figure 136: Eastern Europe Market Value Share (%) and BPS Analysis by Technology, 2025-2035
  • Figure 137: Eastern Europe Market Y-o-Y Growth (%) Projections by Technology, 2025-2035
  • Figure 138: Eastern Europe Market Value (USD Million) Analysis by Application, 2020-2035
  • Figure 139: Eastern Europe Market Volume (Units) Analysis by Application, 2020-2035
  • Figure 140: Eastern Europe Market Value Share (%) and BPS Analysis by Application, 2025-2035
  • Figure 141: Eastern Europe Market Y-o-Y Growth (%) Projections by Application, 2025-2035
  • Figure 142: Eastern Europe Market Value (USD Million) Analysis by End User, 2020-2035
  • Figure 143: Eastern Europe Market Volume (Units) Analysis by End User, 2020-2035
  • Figure 144: Eastern Europe Market Value Share (%) and BPS Analysis by End User, 2025-2035
  • Figure 145: Eastern Europe Market Y-o-Y Growth (%) Projections by End User, 2025-2035
  • Figure 146: Eastern Europe Market Attractiveness by Product Type, 2025-2035
  • Figure 147: Eastern Europe Market Attractiveness by Technology, 2025-2035
  • Figure 148: Eastern Europe Market Attractiveness by Application, 2025-2035
  • Figure 149: Eastern Europe Market Attractiveness by End User, 2025-2035
  • Figure 150: Eastern Europe Market Attractiveness by Country, 2025-2035
  • Figure 151: East Asia Market Value (USD Million) by Product Type, 2025-2035
  • Figure 152: East Asia Market Value (USD Million) by Technology, 2025-2035
  • Figure 153: East Asia Market Value (USD Million) by Application, 2025-2035
  • Figure 154: East Asia Market Value (USD Million) by End User, 2025-2035
  • Figure 155: East Asia Market Value (USD Million) by Country, 2025-2035
  • Figure 156: East Asia Market Value (USD Million) Analysis by Country, 2020-2035
  • Figure 157: East Asia Market Volume (Units) Analysis by Country, 2020-2035
  • Figure 158: East Asia Market Value Share (%) and BPS Analysis by Country, 2025-2035
  • Figure 159: East Asia Market Y-o-Y Growth (%) Projections by Country, 2025-2035
  • Figure 160: East Asia Market Value (USD Million) Analysis by Product Type, 2020-2035
  • Figure 161: East Asia Market Volume (Units) Analysis by Product Type, 2020-2035
  • Figure 162: East Asia Market Value Share (%) and BPS Analysis by Product Type, 2025-2035
  • Figure 163: East Asia Market Y-o-Y Growth (%) Projections by Product Type, 2025-2035
  • Figure 164: East Asia Market Value (USD Million) Analysis by Technology, 2020-2035
  • Figure 165: East Asia Market Volume (Units) Analysis by Technology, 2020-2035
  • Figure 166: East Asia Market Value Share (%) and BPS Analysis by Technology, 2025-2035
  • Figure 167: East Asia Market Y-o-Y Growth (%) Projections by Technology, 2025-2035
  • Figure 168: East Asia Market Value (USD Million) Analysis by Application, 2020-2035
  • Figure 169: East Asia Market Volume (Units) Analysis by Application, 2020-2035
  • Figure 170: East Asia Market Value Share (%) and BPS Analysis by Application, 2025-2035
  • Figure 171: East Asia Market Y-o-Y Growth (%) Projections by Application, 2025-2035
  • Figure 172: East Asia Market Value (USD Million) Analysis by End User, 2020-2035
  • Figure 173: East Asia Market Volume (Units) Analysis by End User, 2020-2035
  • Figure 174: East Asia Market Value Share (%) and BPS Analysis by End User, 2025-2035
  • Figure 175: East Asia Market Y-o-Y Growth (%) Projections by End User, 2025-2035
  • Figure 176: East Asia Market Attractiveness by Product Type, 2025-2035
  • Figure 177: East Asia Market Attractiveness by Technology, 2025-2035
  • Figure 178: East Asia Market Attractiveness by Application, 2025-2035
  • Figure 179: East Asia Market Attractiveness by End User, 2025-2035
  • Figure 180: East Asia Market Attractiveness by Country, 2025-2035
  • Figure 181: South Asia Market Value (USD Million) by Product Type, 2025-2035
  • Figure 182: South Asia Market Value (USD Million) by Technology, 2025-2035
  • Figure 183: South Asia Market Value (USD Million) by Application, 2025-2035
  • Figure 184: South Asia Market Value (USD Million) by End User, 2025-2035
  • Figure 185: South Asia Market Value (USD Million) by Country, 2025-2035
  • Figure 186: South Asia Market Value (USD Million) Analysis by Country, 2020-2035
  • Figure 187: South Asia Market Volume (Units) Analysis by Country, 2020-2035
  • Figure 188: South Asia Market Value Share (%) and BPS Analysis by Country, 2025-2035
  • Figure 189: South Asia Market Y-o-Y Growth (%) Projections by Country, 2025-2035
  • Figure 190: South Asia Market Value (USD Million) Analysis by Product Type, 2020-2035
  • Figure 191: South Asia Market Volume (Units) Analysis by Product Type, 2020-2035
  • Figure 192: South Asia Market Value Share (%) and BPS Analysis by Product Type, 2025-2035
  • Figure 193: South Asia Market Y-o-Y Growth (%) Projections by Product Type, 2025-2035
  • Figure 194: South Asia Market Value (USD Million) Analysis by Technology, 2020-2035
  • Figure 195: South Asia Market Volume (Units) Analysis by Technology, 2020-2035
  • Figure 196: South Asia Market Value Share (%) and BPS Analysis by Technology, 2025-2035
  • Figure 197: South Asia Market Y-o-Y Growth (%) Projections by Technology, 2025-2035
  • Figure 198: South Asia Market Value (USD Million) Analysis by Application, 2020-2035
  • Figure 199: South Asia Market Volume (Units) Analysis by Application, 2020-2035
  • Figure 200: South Asia Market Value Share (%) and BPS Analysis by Application, 2025-2035
  • Figure 201: South Asia Market Y-o-Y Growth (%) Projections by Application, 2025-2035
  • Figure 202: South Asia Market Value (USD Million) Analysis by End User, 2020-2035
  • Figure 203: South Asia Market Volume (Units) Analysis by End User, 2020-2035
  • Figure 204: South Asia Market Value Share (%) and BPS Analysis by End User, 2025-2035
  • Figure 205: South Asia Market Y-o-Y Growth (%) Projections by End User, 2025-2035
  • Figure 206: South Asia Market Attractiveness by Product Type, 2025-2035
  • Figure 207: South Asia Market Attractiveness by Technology, 2025-2035
  • Figure 208: South Asia Market Attractiveness by Application, 2025-2035
  • Figure 209: South Asia Market Attractiveness by End User, 2025-2035
  • Figure 210: South Asia Market Attractiveness by Country, 2025-2035
  • Figure 211: MEA Market Value (USD Million) by Product Type, 2025-2035
  • Figure 212: MEA Market Value (USD Million) by Technology, 2025-2035
  • Figure 213: MEA Market Value (USD Million) by Application, 2025-2035
  • Figure 214: MEA Market Value (USD Million) by End User, 2025-2035
  • Figure 215: MEA Market Value (USD Million) by Country, 2025-2035
  • Figure 216: MEA Market Value (USD Million) Analysis by Country, 2020-2035
  • Figure 217: MEA Market Volume (Units) Analysis by Country, 2020-2035
  • Figure 218: MEA Market Value Share (%) and BPS Analysis by Country, 2025-2035
  • Figure 219: MEA Market Y-o-Y Growth (%) Projections by Country, 2025-2035
  • Figure 220: MEA Market Value (USD Million) Analysis by Product Type, 2020-2035
  • Figure 221: MEA Market Volume (Units) Analysis by Product Type, 2020-2035
  • Figure 222: MEA Market Value Share (%) and BPS Analysis by Product Type, 2025-2035
  • Figure 223: MEA Market Y-o-Y Growth (%) Projections by Product Type, 2025-2035
  • Figure 224: MEA Market Value (USD Million) Analysis by Technology, 2020-2035
  • Figure 225: MEA Market Volume (Units) Analysis by Technology, 2020-2035
  • Figure 226: MEA Market Value Share (%) and BPS Analysis by Technology, 2025-2035
  • Figure 227: MEA Market Y-o-Y Growth (%) Projections by Technology, 2025-2035
  • Figure 228: MEA Market Value (USD Million) Analysis by Application, 2020-2035
  • Figure 229: MEA Market Volume (Units) Analysis by Application, 2020-2035
  • Figure 230: MEA Market Value Share (%) and BPS Analysis by Application, 2025-2035
  • Figure 231: MEA Market Y-o-Y Growth (%) Projections by Application, 2025-2035
  • Figure 232: MEA Market Value (USD Million) Analysis by End User, 2020-2035
  • Figure 233: MEA Market Volume (Units) Analysis by End User, 2020-2035
  • Figure 234: MEA Market Value Share (%) and BPS Analysis by End User, 2025-2035
  • Figure 235: MEA Market Y-o-Y Growth (%) Projections by End User, 2025-2035
  • Figure 236: MEA Market Attractiveness by Product Type, 2025-2035
  • Figure 237: MEA Market Attractiveness by Technology, 2025-2035
  • Figure 238: MEA Market Attractiveness by Application, 2025-2035
  • Figure 239: MEA Market Attractiveness by End User, 2025-2035
  • Figure 240: MEA Market Attractiveness by Country, 2025-2035

Frequently Asked Questions

How big is the NGS-based AMR Detection Market t in 2025?

The global NGS-based AMR Detection Market is estimated to be valued at USD 823.70 million in 2025.

What will be the size of the NGS-based AMR Detection Market in 2035?

The market size for NGS-based AMR Detection Market is projected to reach USD 1,666.0 million by 2035.

How much will the NGS-based AMR Detection Market grow between 2025 and 2035?

The NGS-based AMR Detection Market is expected to grow at a CAGR of 7.3% during this period.

What are the key product types in the NGS-based AMR Detection Market?

Key product types include Instruments/Platforms, Reagents and Consumables and Bioinformatics & Software Solutions.

Which application segment will contribute a significant share in the NGS-based AMR Detection Market in 2025?

The Clinical Diagnostics segment is projected to command 56.3% of the market in 2025.

Explore Similar Insights

Future Market Insights

NGS-based AMR Detection Market

Chat With MaRIA

Chat With

MaRIA

Hi There, I am MaRIA, Your Market Research Intelligence Assistant. How may I help you?