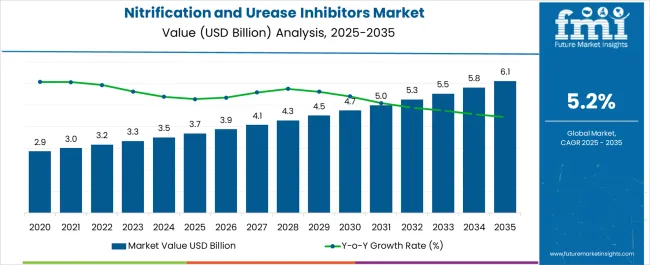
The nitrification and urease inhibitors market, valued at USD 3.7 billion in 2025 and projected to reach USD 6.1 billion by 2035, is growing at a CAGR of 5.2%, creating an absolute dollar opportunity of USD 2.4 billion over the period. In the initial phase from 2021 to 2025, the market expands from USD 2.9 billion to USD 3.7 billion, generating an additional USD 0.8 billion. This early growth is supported by rising emphasis on nitrogen use efficiency, regulatory pressure to reduce fertilizer losses, and wider adoption across cereal and grain cultivation. From 2026 to 2030, the market progresses from USD 3.9 billion to USD 4.7 billion, contributing nearly USD 0.8 billion, or around 33% of the total opportunity. This mid-phase expansion is driven by adoption of enhanced formulations, government subsidy programs, and increasing awareness about reducing greenhouse gas emissions from agriculture.
Between 2031 and 2035, the market grows from USD 5.0 billion to USD 6.1 billion, creating USD 1.1 billion in opportunity, accounting for almost 46% of the total expansion. This stage reflects broader adoption in emerging economies, coupled with increasing integration of inhibitors into precision farming practices.
| Metric | Value |
|---|---|
| Nitrification and Urease Inhibitors Market Estimated Value in (2025 E) | USD 3.7 billion |
| Nitrification and Urease Inhibitors Market Forecast Value in (2035 F) | USD 6.1 billion |
| Forecast CAGR (2025 to 2035) | 5.2% |
The nitrification and urease inhibitors segment holds a significant role within the broader crop protection and fertilizer additives space, accounting for an estimated 28–30% share of the global nitrogen stabilizers market, primarily due to their effectiveness in reducing nitrogen losses and improving soil nutrient efficiency. Within the enhanced efficiency fertilizers category, these inhibitors contribute nearly 22–24%, as their application ensures better nitrogen availability for crops and minimizes leaching or volatilization. In cereal and grain cultivation, nitrification and urease inhibitors represent about 18–20% share, supported by large-scale adoption across corn, wheat, and rice fields where nitrogen retention is crucial for yield maximization. Within the environmental solutions domain, their share stands at around 14–16%, driven by regulatory emphasis on reducing ammonia emissions and groundwater contamination from excess fertilizer use. Growth is supported by rising awareness among farmers, subsidies for efficient fertilizers in developing economies, and R&D in inhibitor formulations offering longer persistence in soils. Multinational suppliers and regional agrochemical firms are expanding their presence by launching customized blends that match soil types and climatic conditions. Despite challenges from cost sensitivity and dependency on weather patterns, nitrification and urease inhibitors are expected to remain a critical part of global nutrient management strategies, enhancing both productivity and compliance.
The Nitrification and Urease Inhibitors market is advancing steadily as sustainable agricultural practices gain prominence to address soil health, nutrient efficiency, and environmental concerns. Increasing awareness of nutrient losses through leaching and volatilization is driving the adoption of inhibitor technologies among farmers and agribusinesses. Fertilizer efficiency regulations and government-supported initiatives to promote reduced environmental impact are further supporting the market’s momentum.
The role of these inhibitors in enhancing nitrogen use efficiency and reducing greenhouse gas emissions is being recognized as a vital factor for modern agriculture. Technological innovations in formulation and application methods are enabling easier integration into existing farming systems.
Demand is further strengthened by the expansion of high-value crops and precision farming practices As agricultural stakeholders seek solutions that optimize yields while complying with environmental guidelines, the use of nitrification and urease inhibitors is expected to see sustained growth, creating opportunities for innovation and global expansion in the coming years.
The nitrification and urease inhibitors market is segmented by method, nutrient, crop type, and geographic regions. By method, nitrification and urease inhibitors market is divided into Fertigation and Foliar. In terms of nutrient, nitrification and urease inhibitors market is classified into Nitrogen, Ammonia, Nitrate, Urea, and Others. Based on crop type, nitrification and urease inhibitors market is segmented into Food crop, Cash crop, Horticulture, Fibre crop, and Others. Regionally, the nitrification and urease inhibitors industry is classified into North America, Latin America, Western Europe, Eastern Europe, Balkan & Baltic Countries, Russia & Belarus, Central Asia, East Asia, South Asia & Pacific, and the Middle East & Africa.
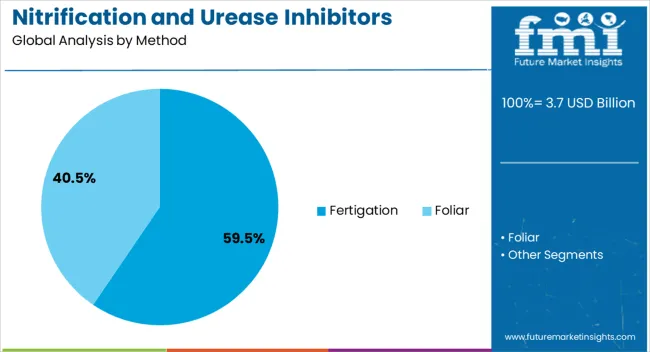
The fertigation method segment is projected to hold 59.50% of the Nitrification and Urease Inhibitors market revenue share in 2025, making it the leading application method. This dominance has been supported by the ability of fertigation to deliver nutrients efficiently through irrigation systems, ensuring uniform distribution and precise timing. Farmers have adopted this method due to its compatibility with modern irrigation infrastructure, resulting in improved nutrient uptake and reduced losses.
The integration of nitrification and urease inhibitors within fertigation systems has allowed for enhanced control over nitrogen release, minimizing leaching and volatilization. This approach is particularly effective in regions with water scarcity where efficient resource utilization is critical.
Its flexibility for different crop types and growing conditions has further reinforced its preference among large-scale and high-value crop producers The capacity to pair fertigation with real-time monitoring and automation technologies is also contributing to its leadership position in the market.
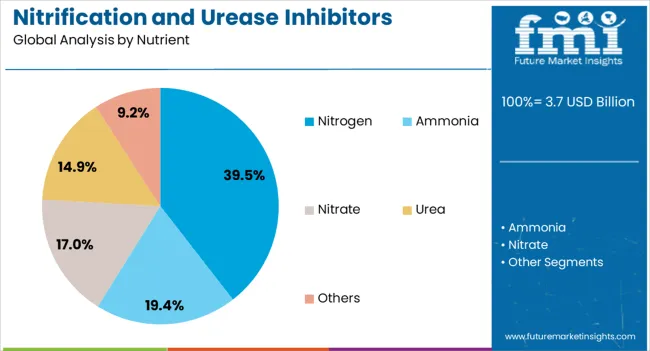
The nitrogen nutrient segment is expected to account for 39.50% of the Nitrification and Urease Inhibitors market revenue share in 2025, maintaining its role as the dominant nutrient type. Growth in this segment has been driven by the widespread use of nitrogen-based fertilizers in agriculture and the necessity to enhance their efficiency. Nitrogen is vital for plant growth, yet it is prone to losses through volatilization and leaching, making inhibitor technologies essential for maximizing its utilization.
Farmers are increasingly adopting nitrogen-focused solutions due to their proven impact on crop yields and soil fertility. The incorporation of inhibitors allows for controlled nitrogen release, reducing the environmental footprint while improving return on investment for growers.
This segment’s prominence is further reinforced by regulatory measures aimed at curbing nitrogen runoff and emissions, which are prompting higher adoption rates across diverse agricultural regions The ability to combine nitrogen efficiency with sustainability goals ensures continued market leadership for this nutrient type.
The food crop segment is projected to command 37.00% of the Nitrification and Urease Inhibitors market revenue share in 2025, emerging as the leading crop type. Its growth has been influenced by the high global demand for staple foods, which necessitates consistent yield optimization. Food crops, including cereals, pulses, and vegetables, have benefited significantly from the use of nitrification and urease inhibitors due to their sensitivity to nutrient losses.
Adoption has been further supported by government and industry programs promoting sustainable nutrient management to ensure food security. The application of these inhibitors in food crops not only enhances yield but also maintains soil fertility over multiple growing seasons.
Rising global population and shifts in dietary patterns toward nutrient-rich crops have intensified the need for efficient fertilization practices As the demand for safe and sustainable food production continues to grow, the food crop segment is expected to sustain its dominance in the overall market.
Nitrification and urease inhibitors are gaining momentum due to nitrogen efficiency needs and regulatory pressure. Their wider applications, innovative blends, and compliance-driven adoption make them central to global fertilizer strategies.
The rising importance of nitrogen efficiency has made nitrification and urease inhibitors a crucial component of modern crop management. Farmers are increasingly using these additives to ensure that nitrogen fertilizers remain available in soil for a longer period, reducing losses through leaching or volatilization. These inhibitors are considered highly valuable in cereal and grain farming, where yield improvement depends heavily on nitrogen stability. Their role has been highlighted by regulatory measures encouraging reduced ammonia emissions and better groundwater protection. By delaying the conversion of urea into ammonia and nitrate, they improve fertilizer efficiency, offering farmers both cost savings and higher productivity across diverse agricultural regions.
Nitrification and urease inhibitors are no longer restricted to cereal cultivation but are now widely adopted across cash crops, horticulture, and forage farming. Their application in rice and maize has gained attention, as nitrogen stabilizers significantly reduce wastage and enhance root zone nutrient absorption. In high-value crops like fruits and vegetables, inhibitors are used to maintain balanced soil fertility and avoid nutrient loss during irrigation. Market expansion is also visible in livestock forage crops, where steady nitrogen availability contributes to consistent biomass output. Such broadening applications make them indispensable for fertilizer companies looking to strengthen portfolios and address rising food security concerns.
Government regulations and policy incentives have created momentum for the adoption of nitrification and urease inhibitors. Many regions have introduced subsidies for enhanced efficiency fertilizers, encouraging farmers to choose nitrogen stabilizers over conventional options. In Europe and North America, stricter nitrogen use efficiency standards are driving demand, while developing economies are adopting support schemes to curb fertilizer-related emissions. These policies are influencing distributors and cooperatives to prioritize inhibitor-based blends in their offerings. Compliance-driven adoption has created a strong link between environmental mandates and on-ground agricultural practices, giving these inhibitors a unique position as both productivity enhancers and regulatory enablers.
The competitive dynamics of the nitrification and urease inhibitors market are shaped by continuous product innovation and strategic partnerships. Leading agrochemical firms are investing in formulations that prolong the persistence of inhibitors in diverse soil conditions, ensuring consistent results across climates. Mergers, acquisitions, and collaborations with fertilizer blenders are expanding distribution reach, making these products more accessible to farmers worldwide. Companies are also focusing on region-specific solutions, tailoring inhibitor blends to local soil chemistry and climatic challenges. Competitive strategies extend to awareness-building programs, where training initiatives are designed to highlight the economic and agronomic advantages of these additives for long-term adoption.
| Country | CAGR |
|---|---|
| China | 7.0% |
| India | 6.5% |
| Germany | 6.0% |
| France | 5.5% |
| UK | 4.9% |
| USA | 4.4% |
| Brazil | 3.9% |
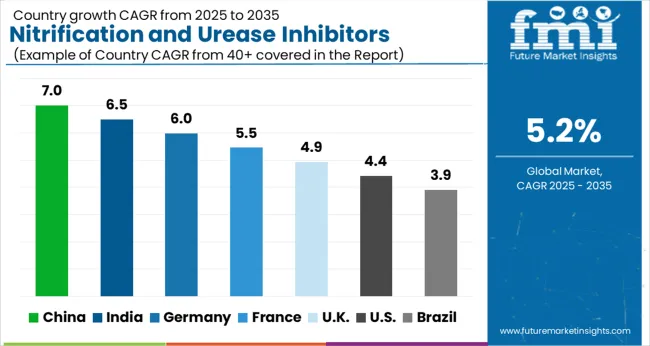
The nitrification and urease inhibitors market is forecasted to expand globally at a CAGR of 5.2% from 2025 to 2035, supported by demand for nitrogen efficiency, crop yield improvement, and compliance-driven fertilizer adoption. China leads with a CAGR of 7.0%, backed by extensive cereal cultivation, government-backed nitrogen efficiency programs, and rising adoption across rice and maize fields. India follows at 6.5%, driven by farmer awareness campaigns, expanding fertilizer distribution, and increasing reliance on nitrogen stabilizers for high-value crops. France stands at 5.5%, supported by balanced adoption in cereals, vineyards, and horticulture segments. The United Kingdom posts 4.9%, reflecting steady uptake encouraged by subsidy-driven adoption and compliance standards. The United States records 4.4%, reflecting slower adoption due to mature fertilizer practices and cost sensitivity but remains significant in advanced product trials and technology-driven blends. This comparative outlook indicates that Asia-Pacific remains the fastest-growing region for nitrogen stabilizers, while Europe demonstrates compliance-led growth, and North America emphasizes innovation and targeted adoption within precision agriculture frameworks.
China is projected to achieve a CAGR of 7.0% for 2025–2035, higher than the approximate 6.2% observed in 2020–2024, well above the global average of 5.2%. This upward shift is linked to large-scale adoption across cereal crops such as rice, maize, and wheat, combined with regulatory emphasis on improving nitrogen use efficiency. Government-supported initiatives for curbing fertilizer loss and enhancing soil fertility have accelerated adoption of stabilizers in agricultural provinces. Expanding food security goals and growing farmer awareness campaigns have further strengthened uptake. The rise in CAGR reflects both compliance-driven and productivity-oriented adoption, positioning China as a global leader in nitrogen stabilizer applications.
India is forecasted to register a CAGR of 6.5% between 2025–2035, compared with nearly 5.8% during 2020–2024, outperforming the global baseline of 5.2%. The rise is attributed to stronger integration of nitrogen stabilizers within both cereal and cash crop segments, particularly maize, sugarcane, and horticulture. Expanding fertilizer distribution networks across rural markets and ongoing government subsidies for efficient fertilizers have supported broader reach. Local manufacturers are developing cost-effective formulations suited to India’s diverse soils, which has widened farmer adoption. The increase in CAGR illustrates India’s transition from limited-use to mainstream application, making it one of the fastest-growing regions for nitrogen stabilizers globally.
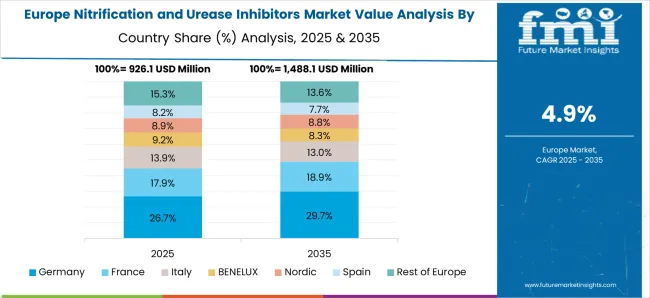
France is expected to record a CAGR of 5.5% during 2025–2035, an improvement from about 4.8% achieved in 2020–2024, slightly above the global average of 5.2%. This growth is linked to regulatory requirements mandating efficient fertilizer usage and nitrogen-loss reduction. Adoption has expanded beyond cereals into vineyards, specialty crops, and horticulture. France’s focus on compliance with EU nitrogen directives and emphasis on environmentally safe farming has driven investments in advanced inhibitor formulations. The rise in CAGR reflects consistent adoption across diversified agricultural sectors, positioning France as a compliance-led but steadily expanding hub for inhibitor use in Europe.
The United Kingdom is projected to post a CAGR of 4.9% for 2025–2035, up from nearly 4.2% in 2020–2024, slightly below the 5.2% global average. This rise reflects a transition toward compliance-driven farming, subsidy-led adoption, and increased integration into precision agriculture. While earlier uptake was slower due to cost sensitivity and limited awareness, post-2024 trends show broader usage in cereals and forage crops. The shift from 4.2% to 4.9% is explained by stronger government initiatives for nitrogen efficiency and wider integration of stabilizers in advanced farm management systems. The steady rise highlights the UK’s move toward targeted, high-efficiency farming practices.
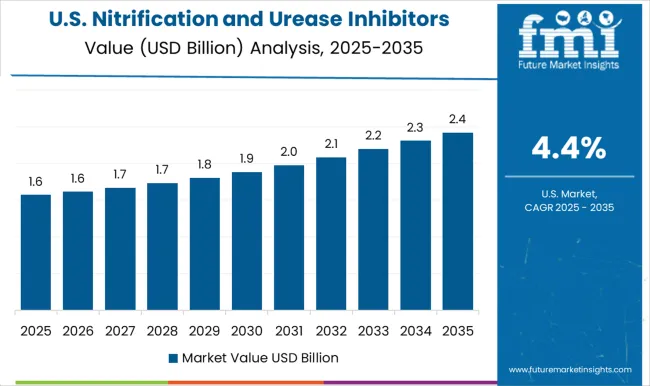
The United States is forecasted to record a CAGR of 4.4% for 2025–2035, compared with about 3.9% during 2020–2024, remaining below the global average of 5.2%. This modest rise reflects limited but consistent adoption in precision farming, with major uptake in maize, soy, and wheat belts. High input costs and established fertilizer practices continue to limit faster penetration, but rising focus on advanced inhibitor blends and trial programs in research-intensive states are boosting demand. The increase from 3.9% to 4.4% demonstrates a gradual shift from experimental use toward wider adoption in large-scale farms, particularly in regions emphasizing nutrient management compliance.
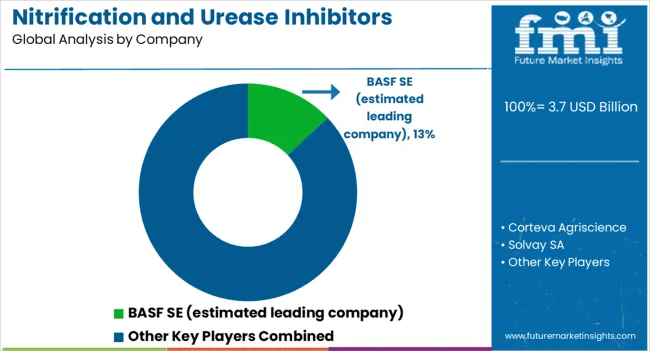
The nitrification and urease inhibitors market is dominated by a mix of multinational agrochemical leaders and specialized fertilizer solution providers. BASF SE is estimated to hold a leading position, with a broad portfolio of nitrogen stabilizer products designed to enhance nutrient use efficiency and reduce nitrogen losses in intensive farming systems. Corteva Agriscience focuses on crop-specific solutions, integrating inhibitors with advanced seed and crop protection technologies to strengthen farmer adoption. Solvay SA emphasizes chemical expertise, offering innovative formulations that extend soil persistence and improve compatibility with diverse fertilizers. Koch Fertilizer / Koch Agronomic Services plays a major role in the USA and global market with its nitrogen efficiency portfolio, supplying large-scale distributors and cooperatives. Compo Expert GmbH strengthens its competitive position in Europe by delivering specialty fertilizers combined with inhibitors tailored to horticulture and high-value crops. J R Simplot Company emphasizes integration of stabilizers into large-scale farming operations, particularly in North America. Helena Agri-Enterprises drives adoption through its extensive distribution network, supporting farmers with advisory services and customized blends.
The competitive landscape is marked by regional players retaining relevance through soil-specific and climate-tailored solutions. Strategies include investment in research for long-acting formulations, partnerships with fertilizer producers, and expansion into emerging markets where efficiency-driven fertilizers are gaining traction. Collectively, these companies compete on product performance, field adaptability, distribution strength, and compliance with evolving agricultural regulations.
| Item | Value |
|---|---|
| Quantitative Units | USD 3.7 Billion |
| Method | Fertigation and Foliar |
| Nutrient | Nitrogen, Ammonia, Nitrate, Urea, and Others |
| Crop Type | Food crop, Cash crop, Horticulture, Fibre crop, and Others |
| Regions Covered | North America, Europe, Asia-Pacific, Latin America, Middle East & Africa |
| Country Covered | United States, Canada, Germany, France, United Kingdom, China, Japan, India, Brazil, South Africa |
| Key Companies Profiled | BASF SE (estimated leading company), Corteva Agriscience, Solvay SA, Koch Fertilizer / Koch Agronomic, Compo Expert GmbH, J R Simplot Company, Helena Agri-Enterprises, and (others / regional players retained) |
| Additional Attributes | Dollar sales, share, adoption across crop types, demand in cereals and horticulture, regional policy incentives, pricing strategies, competitive positioning, distribution networks, and R&D-driven formulations. |
The global nitrification and urease inhibitors market is estimated to be valued at USD 3.7 billion in 2025.
The market size for the nitrification and urease inhibitors market is projected to reach USD 6.1 billion by 2035.
The nitrification and urease inhibitors market is expected to grow at a 5.2% CAGR between 2025 and 2035.
The key product types in nitrification and urease inhibitors market are fertigation and foliar.
In terms of nutrient, nitrogen segment to command 39.5% share in the nitrification and urease inhibitors market in 2025.


Our Research Products

The "Full Research Suite" delivers actionable market intel, deep dives on markets or technologies, so clients act faster, cut risk, and unlock growth.

The Leaderboard benchmarks and ranks top vendors, classifying them as Established Leaders, Leading Challengers, or Disruptors & Challengers.

Locates where complements amplify value and substitutes erode it, forecasting net impact by horizon

We deliver granular, decision-grade intel: market sizing, 5-year forecasts, pricing, adoption, usage, revenue, and operational KPIs—plus competitor tracking, regulation, and value chains—across 60 countries broadly.

Spot the shifts before they hit your P&L. We track inflection points, adoption curves, pricing moves, and ecosystem plays to show where demand is heading, why it is changing, and what to do next across high-growth markets and disruptive tech

Real-time reads of user behavior. We track shifting priorities, perceptions of today’s and next-gen services, and provider experience, then pace how fast tech moves from trial to adoption, blending buyer, consumer, and channel inputs with social signals (#WhySwitch, #UX).

Partner with our analyst team to build a custom report designed around your business priorities. From analysing market trends to assessing competitors or crafting bespoke datasets, we tailor insights to your needs.
Supplier Intelligence
Discovery & Profiling
Capacity & Footprint
Performance & Risk
Compliance & Governance
Commercial Readiness
Who Supplies Whom
Scorecards & Shortlists
Playbooks & Docs
Category Intelligence
Definition & Scope
Demand & Use Cases
Cost Drivers
Market Structure
Supply Chain Map
Trade & Policy
Operating Norms
Deliverables
Buyer Intelligence
Account Basics
Spend & Scope
Procurement Model
Vendor Requirements
Terms & Policies
Entry Strategy
Pain Points & Triggers
Outputs
Pricing Analysis
Benchmarks
Trends
Should-Cost
Indexation
Landed Cost
Commercial Terms
Deliverables
Brand Analysis
Positioning & Value Prop
Share & Presence
Customer Evidence
Go-to-Market
Digital & Reputation
Compliance & Trust
KPIs & Gaps
Outputs
Full Research Suite comprises of:
Market outlook & trends analysis
Interviews & case studies
Strategic recommendations
Vendor profiles & capabilities analysis
5-year forecasts
8 regions and 60+ country-level data splits
Market segment data splits
12 months of continuous data updates
DELIVERED AS:
PDF EXCEL ONLINE
Android Automotive OS (AAOS) Market Size and Share Forecast Outlook 2025 to 2035
Anderson Cascade Impactor Market Size and Share Forecast Outlook 2025 to 2035
Andersen-Tawil Syndrome Treatment Market Trends - Growth & Future Prospects 2025 to 2035
Andro Supplements Market
Candle Filter Cartridges Market Size and Share Forecast Outlook 2025 to 2035
Handheld Electrostatic Meter Market Size and Share Forecast Outlook 2025 to 2035
Hand Towel Automatic Folding Machine Market Size and Share Forecast Outlook 2025 to 2035
Handheld Ultrasound Scanner Market Size and Share Forecast Outlook 2025 to 2035
Handheld Tagging Gun Market Forecast and Outlook 2025 to 2035
Handheld Imaging Systems Market Size and Share Forecast Outlook 2025 to 2035
Sandwich Panel System Market Size and Share Forecast Outlook 2025 to 2035
Hand Tools Market Size and Share Forecast Outlook 2025 to 2035
Land Survey Equipment Market Size and Share Forecast Outlook 2025 to 2035
Handloom Product Market Size and Share Forecast Outlook 2025 to 2035
Band File Sander Belts Market Size and Share Forecast Outlook 2025 to 2035
Handheld XRF Analyzers Market Size and Share Forecast Outlook 2025 to 2035
Sand Abrasion Tester Market Size and Share Forecast Outlook 2025 to 2035
Sand Testing Equipments Market Size and Share Forecast Outlook 2025 to 2035
Landscape Lighting Market Size and Share Forecast Outlook 2025 to 2035
Handheld Police Radar Guns Market Size and Share Forecast Outlook 2025 to 2035

Thank you!
You will receive an email from our Business Development Manager. Please be sure to check your SPAM/JUNK folder too.
Chat With
MaRIA