Hand-held Breast Cancer Detection Market Size and Share Forecast Outlook 2025 to 2035

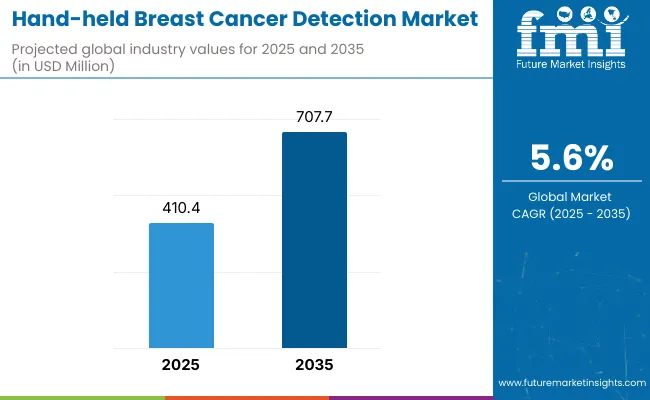
The global Hand-held Breast Cancer Detection Market is projected to reach a valuation of USD 410.4 million by 2025 and USD 707.7 million by 2035. This indicates a decade-long increase of USD 297.3 million between 2025 and 2035. The market is expected to expand at a compound annual growth rate (CAGR) of 5.6%, representing a 1.72X increase over the ten-year period.
Quick Stats for Hand-held Breast Cancer Detection Market

  • Industry Value (2025): USD 410.4 million
  • Forecast Value (2035): USD 707.7 million
  • Forecast CAGR: 5.6%
  • Leading Segment in 2025: Screening Devices (41.5% market share)
  • Key Growth Region: Asia Pacific, North America and Europe
  • Top Key Players: UE LifeSciences, Hologic, Inc., Butterfly Network, Inc., Micrima Ltd, iSono Health, Braster, Shenzhen Bestman Instrument, HCE Ghana Limited, Zhong Jie Electronics Technology

Hand Held Breast Cancer Detection Market

Metric Value
Estimated Value in (2025) USD 410.4 million
Estimated Value in (2035) USD 707.7 million
Forecast CAGR (2025 to 2035) 5.6%

During the first five-year period from 2025 to 2030, the total market value is projected to expand from USD 410.4 million to USD 538.9 million, adding USD 128.5 million which contributes to 43.2% of the total decade growth. Screening Devices will remain dominant holding around 41.0% share of the category by 2030 due to their critical role in early-stage detection and large-scale deployment in hospitals. Diagnostic Devices segment will stabilize around 37.3% by 2030, while Hybrid Devices remain niche but gradually rise toward 22% share.

The second half from 2030 to 2035 contributes USD 168.8 million, equal to 56.8% of the total growth, as the market jumps from USD 538.9 million to USD 707.7 million. This acceleration is powered by widespread adoption of optical and ultrasound-based devices across both developed and emerging markets. By 2035, Screening and Diagnostic Devices together capture a share above 77%, while Hybrid Devices edge higher, reflecting clinical interest in multi-functional platforms. Optical Imaging Devices are likely to rise to around 29.6% share, surpassing microwave/radio-frequency technologies.

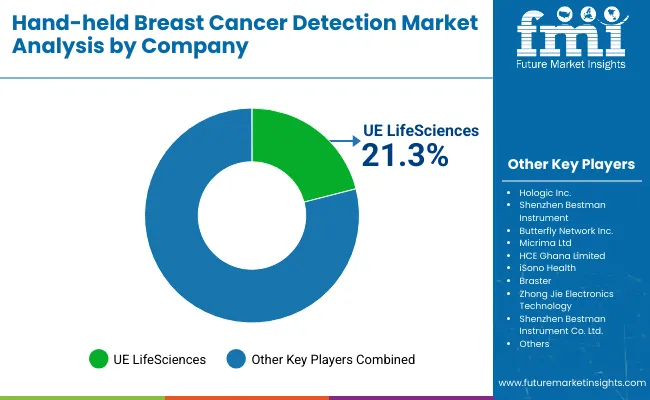
From 2020 to 2024, the overall Hand-held Breast Cancer Detection Market grew from USD 351.6 million to USD 395.7 million. Leading manufacturers such as UE LifeSciences, Hologic, and Butterfly Network, Inc. together account for a significant share of global revenue, with UE LifeSciences alone holding 21.3% share in 2025 through portable ultrasound and tactile imaging devices. Key strategies deployed by these players include expanding access in emerging markets, integrating AI-assisted imaging, and forging collaborations with cancer screening programs to pilot mobile detection initiatives.

In 2025, the Hand-held Breast Cancer Detection Market is expected to reach a value of approximately USD 410.4 million, driven by a shift from basic portable screening tools to digitally integrated, multifunctional hand-held platforms. Growth will be propelled by hospital and specialty cancer clinic investments in early detection, mobile outreach, and compliance with breast cancer screening guidelines. Providers are increasingly adopting optical imaging devices, ultrasound-based probes, and hybrid platforms equipped with digital connectivity, cloud-based diagnostics, and AI decision-support features to enhance diagnostic accuracy, streamline workflows, and extend access to underserved populations.

Why Is This Market Growing?

The Hand-held Breast Cancer Detection Market is seeing strong growth because healthcare systems worldwide face mounting pressure to improve early cancer detection, reduce diagnostic delays, and expand access to underserved populations. Major drivers include rising breast cancer incidence, government-supported screening programs, and the shift toward portable and affordable detection solutions. Innovations such as AI-assisted ultrasound probes, optical imaging devices, and hybrid platforms improve diagnostic accuracy, reduce operator dependency, and support large-scale outreach programs in low-resource settings.

The pandemic amplified focus on community-based and mobile screening models, accelerating adoption of lightweight and digitally connected hand-held devices. As healthcare budgets prioritize preventive care and decentralized diagnostics, manufacturers delivering portable, cost-efficient, and digitally integrated solutions are achieving robust sales. In countries with expanding healthcare infrastructure, particularly in Europe, China, and South Korea, new screening initiatives and technological upgrades are further boosting demand.

Segmental Analysis

The market is segmented by product, procedure, and end-user. Product type include Screening Devices, Diagnostic Devices, and Hybrid Devices, highlighting the core elements driving adoption. Procedure classification covers Infrared Imaging Devices, Ultrasound-based Hand-held Devices, Microwave/Radio-frequency Devices, and Optical Imaging Devices. Based on End User, the segmentation includes Hospitals, Specialty Cancer Clinics, Diagnostic Imaging Centers, and Mobile Screening Units/Outreach Programs. Regionally, the scope spans North America, Latin America, Western and Eastern Europe, East Asia, South Asia and Pacific, and the Middle East and Africa.
Insights into the Product Segment with Screening Devices Leading in Market Share

Hand Held Breast Cancer Detection Market By Product

By Product Market Share (%)
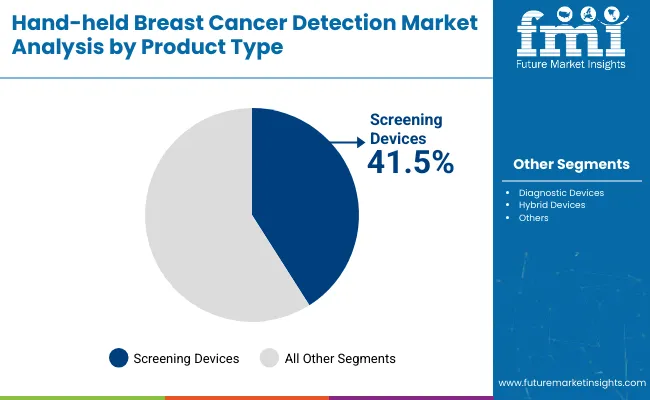
Screening Devices 41.5%
Diagnostic Devices 37.2%
Hybrid Devices 21.3%

Screening devices are expected to retain a dominant position and are projected to contribute 41.5% in 2025, supported by their critical role in large-scale community and hospital-based early detection programs. Their adoption has been driven by the global emphasis on early-stage cancer identification and outreach accessibility, particularly in regions with rising breast cancer incidence.

Preference has been increasingly shown for these devices due to their portability, ease of use, and ability to deliver results without requiring complex infrastructure. Deployments have also been supported by public health initiatives and non-governmental organizations promoting preventive screening. These factors have collectively contributed to the sustained demand for screening devices over the forecast period, even as hybrid and diagnostic platforms expand their footprint in specialty care and advanced diagnostic workflows.
Insights into the Procedure Segment with Ultrasound-based Hand-held Devices Dominating the Demand

Hand Held Breast Cancer Detection Market By Procedure

By Procedure type Market Share (%)
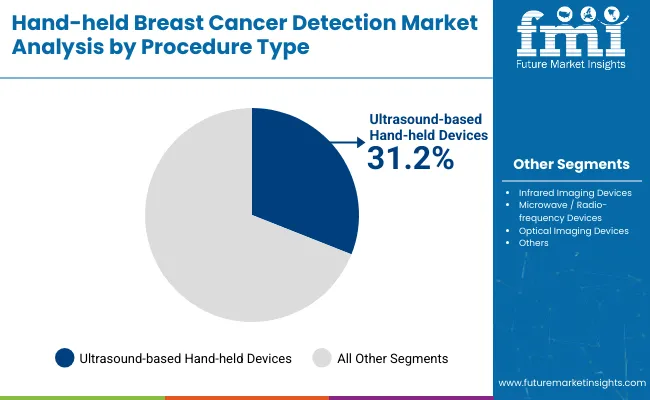
Infrared Imaging Devices 28.5%
Ultrasound-based Hand-held Devices 31.2%
Microwave / Radio-frequency Devices 14.7%
Optical Imaging Devices 25.6%

Ultrasound-based hand-held devices have emerged as the leading procedure type and are projected to hold around 31.2% in 2025 due to their proven clinical reliability and widespread acceptance in breast imaging. Regulatory clearances by the FDA and CE have strengthened adoption, making portable ultrasound probes a trusted choice in both hospital and outreach settings. These devices enable high-resolution imaging at the point of care, improving diagnostic speed and accessibility for patients with limited access to advanced imaging centers.

Additionally, advancements in AI-powered image interpretation and wireless connectivity have enhanced clinical usability, reducing operator dependency and enabling integration into digital diagnostic workflows. With the global emphasis on early detection and minimally invasive approaches, ultrasound-based hand-held devices remain the dominant modality, while optical imaging and infrared systems expand as complementary technologies in the next decade.
Insights into the End User Segment with Highest Installed Base Among Hospitals

Hand Held Breast Cancer Detection Market By End User

End User Market Share (%)
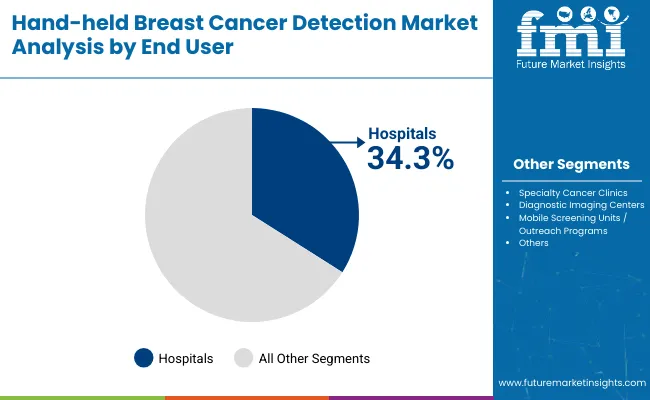
Hospitals 34.3%
Specialty Cancer Clinics 24.5%
Diagnostic Imaging Centers 18.2%
Mobile Screening Units / Outreach Programs 23.0%

Hospitals are expected to remain the largest end user segment, contributing around 34.3% in 2025, driven by their central role in breast cancer diagnosis and treatment pathways. Most diagnostic evaluations and confirmatory procedures are performed in hospital settings, necessitating access to advanced hand-held detection technologies. Demand has been reinforced by mandates for early detection programs and hospital-based screening initiatives supported by public health authorities.

Investments in hospital oncology infrastructure, particularly in breast imaging units and women’s health centers, have resulted in higher procurement of portable ultrasound and optical imaging devices. Procurement has also been influenced by favorable reimbursement frameworks and funding support for cancer screening programs, ensuring integration of hand-held technologies into routine diagnostic workflows in large tertiary and academic hospitals.

What are the Drivers, Restraints, and Key Trends of the Hand-held Breast Cancer Detection Market?

Regulatory Push for Early Breast Cancer Screening

The most significant growth driver in the Hand-held Breast Cancer Detection Market is the global regulatory and policy push toward early detection and population-wide screening. Organizations such as the World Health Organization (WHO) and national cancer control programs emphasize structured breast cancer screening, compelling hospitals, diagnostic centers, and community health programs to invest in affordable and portable technologies.

Hand-held devices, particularly ultrasound-based and optical imaging platforms, align with government-led outreach and NGO initiatives targeting low-resource settings. Regulatory bodies are also fast-tracking approvals for AI-assisted devices to ensure wider accessibility and consistent diagnostic outcomes. As breast cancer incidence continues to rise globally, the need for reliable, point-of-care detection methods is reinforcing procurement and integration of these devices into both hospital workflows and mobile screening units.

High Cost Barriers and Limited Infrastructure Support

Despite their clinical promise, high upfront costs and operational constraints remain key restraints. Advanced hand-held detection devices, especially those integrating AI interpretation, cloud connectivity, and multi-modal imaging, carry price tags that remain challenging for rural and resource-limited healthcare systems. Facilities with restricted budgets often defer adoption, depending instead on traditional mammography access in centralized urban hospitals.

In addition, infrastructure limitations such as inadequate internet connectivity, lack of trained staff, and minimal reimbursement coverage in certain regions slow down deployment. Retrofitting outreach programs to incorporate new portable devices also requires workflow adjustments and physician training, adding to adoption hurdles. These barriers particularly affect developing markets, where the burden of breast cancer is rising but healthcare funding remains constrained.

Convergence of Hand-held Detection with AI and Mobile Health Ecosystems

A rapidly accelerating trend is the convergence of hand-held breast cancer detection with AI diagnostics, digital health platforms, and mobile healthcare ecosystems. Instead of standalone devices, hospitals and screening programs are now adopting integrated systems that combine portable imaging probes with smartphone-based analysis, cloud storage, and tele-oncology consultations. Companies such as UE LifeSciences, Butterfly Network, and iSono Health are pioneering this convergence by embedding advanced analytics, image sharing, and interoperability features that allow seamless use across clinics and outreach programs.

This integration is not only improving diagnostic accuracy but also enabling task-shifting, where trained nurses or community health workers can conduct screenings with remote physician oversight. As health systems worldwide invest in preventive oncology and decentralized care models, hand-held detection devices are becoming strategic enablers, positioned as critical components within a broader ecosystem of digital cancer care and AI-driven diagnostics.
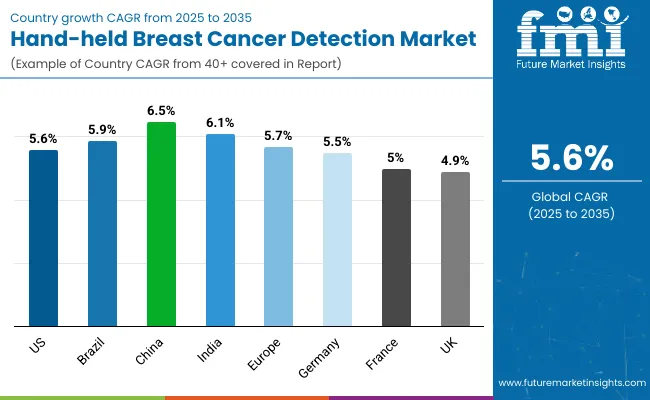
Analysis of Hand-held Breast Cancer Detection Market By Key Countries

Hand Held Breast Cancer Detection Market Country

Countries CAGR
USA 5.6%
Brazil 5.9%
China 6.5%
India 6.1%
Europe 5.7%
Germany 5.5%
France 5.0%
UK 4.9%

Asia Pacific is emerging as the fastest-growing region in the Hand-held Breast Cancer Detection Market, projected to grow at a CAGR of 6.1% between 2025 and 2035. Among its key markets, China is forecast to expand at 6.5% CAGR, driven by large-scale government-backed screening programs, rising incidence of breast cancer, and increased deployment of mobile outreach units in Tier 2 and Tier 3 cities. India is projected at 6.1% CAGR, supported by national health initiatives that are prioritizing preventive oncology, low-cost diagnostics, and digital health integration. The region’s growth is reinforced by rapid healthcare infrastructure expansion, adoption of AI-enabled portable devices, and collaborations with NGOs to extend access to underserved populations.

Europe is expected to grow steadily at a 5.7% CAGR through 2035. Germany will continue to dominate with a 22.3% share by 2035, driven by early adoption of advanced imaging tools in academic hospitals and cancer clinics. France is projected to grow at 5.0% CAGR, benefitting from public hospital investments under cancer control programs, while the UK grows at 4.9% CAGR, supported by NHS modernization efforts to enhance breast cancer survival rates. Broader European market momentum stems from harmonized screening guidelines, structured reimbursement frameworks, and rising uptake of hybrid devices in both specialty clinics and diagnostic centers.

North America remains a mature but innovation-led market, with the USA projected to grow at 5.6% CAGR between 2025 and 2035. Growth is primarily driven by the replacement of legacy detection systems with AI-powered portable imaging probes and hybrid devices designed for early-stage detection. Hospitals and specialty clinics are investing heavily in digital connectivity, cloud-based diagnostics, and patient-centric screening programs. Federal funding for breast cancer prevention and growing adoption of mobile screening vans in underserved regions are fueling continued expansion. Although growth is moderate compared to Asia Pacific, the USA remains the largest single-country market in terms of revenue contribution by 2035.

Sales Outlook for Hand-held Breast Cancer Detection Market in the United States

The Hand-held Breast Cancer Detection Market in the USA is forecast to grow at a 2.3% CAGR, reaching USD 160.5 million by 2035. Growth is driven by federal and state-level initiatives supporting early detection programs and wider adoption of portable ultrasound and optical imaging devices. Hospitals and specialty clinics are replacing older diagnostic pathways with AI-assisted hand-held devices that enable point-of-care screening and improve outreach to underserved populations. Rising breast cancer incidence and demand for non-invasive, patient-friendly tools are strengthening adoption.

  • Hospitals are integrating hand-held ultrasound into women’s health units for faster diagnostics.
  • Specialty cancer clinics are expanding adoption of hybrid devices to enhance accuracy in confirmatory testing.
  • Mobile screening vans in rural states are increasingly equipped with portable optical imaging systems for community outreach.

Growth and Expansion Outlook for Hand-held Breast Cancer Detection Market in the United Kingdom

The Hand-held Breast Cancer Detection Market in the UK is projected to grow at a 4.9% CAGR through 2035, supported by NHS England’s cancer survival initiatives and investment in early detection infrastructure. The “Long Term Plan” and NHS breast screening modernization programs are driving adoption of hand-held technologies for faster and more accessible diagnostics. Growth is reinforced by the rising incidence of breast cancer and demand for cost-efficient tools that complement mammography.

  • NHS hospitals are standardizing portable breast detection devices across regional networks for equity in access.
  • Day clinics are adopting hand-held optical imaging devices to improve throughput in same-day diagnostic settings.
  • Public health bodies are supporting pilot programs deploying hand-held devices for underserved communities.

In-depth Analysis of Hand-held Breast Cancer Detection Market in Germany

The Hand-held Breast Cancer Detection Market in Germany is forecast to grow at a 5.5% CAGR, benefitting from national funding under the Krankenhauszukunftsgesetz (Hospital Future Act) and strong academic hospital networks. German oncology departments are accelerating the use of AI-powered ultrasound probes and hybrid devices, driven by a commitment to structured early detection programs. Hospitals are transitioning from reliance on mammography alone to multi-modal detection pathways integrating portable imaging. Additionally, Germany’s emphasis on ergonomic and patient-centered care is encouraging investment in non-invasive technologies.

  • University hospitals are piloting AI-integrated hybrid devices for precision diagnostics.
  • Regional breast cancer centers are expanding hand-held optical imaging in adjunct to mammography.
  • Community clinics are participating in federal early detection initiatives using low-cost portable systems.

Europe Hand-held Breast Cancer Detection Market Value Analysis By Country

Europe 2025
Germany 22.7%
France 13.5%
Italy 10.2%
BENELUX 6.5%
Nordic Countries 5.0%
Spain 8.7%
Rest of Western Europe 33.3%
Europe 2035
Germany 20.0%
France 13.3%
Italy 11.1%
BENELUX 7.6%
Nordic Countries 6.0%
Spain 9.1%
Rest of Western Europe 32.9%

Market Expansion Outlook for Hand-held Breast Cancer Detection Market in India

The Hand-held Breast Cancer Detection Market in India is expected to grow at a CAGR of 6.1%, making it one of the fastest-growing globally. Growth is fueled by the rapid expansion of tertiary hospitals, cancer centers, and diagnostic networks across Tier 1 and Tier 2 cities. Rising breast cancer incidence and government-backed screening programs under initiatives like Ayushman Bharat are boosting adoption of affordable, portable detection devices. Hospitals are increasingly integrating screening and hybrid devices into outreach programs to extend services into rural and semi-urban areas. Additionally, local manufacturers and global players are collaborating to introduce cost-effective, AI-enabled devices tailored for India’s large patient base.

  • Private multi-specialty hospitals are adopting portable ultrasound devices for early detection.
  • Medical teaching institutes are using hybrid devices in training and research settings.
  • Hospital chains in Tier 2 cities are deploying mobile screening units to address infrastructure gaps.

Sales Outlook for Hand-held Breast Cancer Detection Market in China

The Hand-held Breast Cancer Detection Market in China is projected to grow at a CAGR of 6.5% through 2035, supported by the government’s Healthy China 2030 policy and nationwide cancer screening campaigns. The Ministry of Health has mandated structured breast screening pathways, accelerating adoption of optical imaging and ultrasound-based hand-held devices in Class A hospitals and community clinics. Urban hospitals are adopting AI-integrated platforms, while district hospitals are focusing on low-cost, standalone devices to expand access in underserved regions. Domestic players are scaling up production while integrating digital diagnostic software into portable units.

  • Tertiary hospitals in Tier 1 cities are standardizing AI-powered hybrid devices.
  • Community health centers are rolling out screening devices for preventive oncology.
  • Joint venture hospitals are importing advanced Western systems to align with global standards.

Growth Outlook of Hand-held Breast Cancer Detection Market in Japan

The Hand-held Breast Cancer Detection Market in Japan is projected to reach USD 16.0 million by 2025, expanding at a 3.0% CAGR through 2035. Hybrid devices dominate with 53.8% share in 2025, reflecting Japan’s preference for advanced, multi-functional solutions that combine portability with high diagnostic accuracy. Growth is driven by the Ministry of Health, Labour and Welfare’s efforts to upgrade oncology infrastructure, alongside the rising need for ergonomic, patient-friendly technologies to manage its aging population. Universities and research centers are also actively piloting optical and AI-powered hand-held tools in early-stage clinical workflows.

  • Market in Japan holds 3.9% revenue share of the global market in 2025
  • Specialty cancer clinics are expanding adoption of screening devices for early detection.
  • Long-term care hospitals are introducing portable devices to support aging patient populations.

Opportunity Analysis of South Korea in Hand-held Breast Cancer Detection Market

The Hand-held Breast Cancer Detection Market in South Korea is estimated at USD 11.5 million in 2025, growing at a 6.1% CAGR to reach USD 20.8 million by 2035. Optical imaging devices lead with 40.2% share in 2025, supported by government-led investments in digital healthcare and oncology infrastructure under the Ministry of Health and Welfare’s initiatives. Hospitals and specialty clinics are rapidly adopting AI-enabled optical and ultrasound-based devices to meet demand for early diagnosis. The focus on community-based screening, coupled with South Korea’s advanced telehealth ecosystem, positions hand-held devices as a core tool for preventive cancer care.
  • Market in South Korea holds 2.8% revenue share of the global market in 2025
  • Diagnostic centers are adopting ultrasound-based devices to complement mammography.
  • Community clinics are piloting hybrid solutions integrated with telehealth platforms.

Competition Landscape

Hand Held Breast Cancer Detection Market Company

The Hand-held Breast Cancer Detection Market is moderately fragmented, with global leaders, established innovators, and emerging regional players competing across screening, diagnostic, and hybrid device categories. Industry leader UE LifeSciences holds a significant market share of 21.3%, driven by its flagship iBreastExam device, which has achieved strong adoption in both developed and emerging markets through affordability, portability, and NGO-backed outreach programs. The company is expanding through collaborations with public health agencies and insurers, focusing on scaling access in India, Africa, and underserved USA communities.

Established players such as Hologic, Inc., Butterfly Network, Inc., and Micrima Ltd cater to hospitals and specialty cancer clinics with advanced imaging platforms. Their strategies emphasize AI integration, digital connectivity, and hybrid device development. Butterfly’s ultrasound-on-chip technology, Hologic’s oncology ecosystem, and Micrima’s MARIA® radio-wave imaging system illustrate a shift toward high-accuracy, non-invasive screening solutions tailored for clinical and research environments.

Emerging companies including iSono Health, Braster, Shenzhen Bestman Instrument, HCE Ghana Limited, and Zhong Jie Electronics Technology focus on cost-effective, compact solutions for mobile screening units and community-based programs. Their strengths lie in competitive pricing, portability, and localized customization, making them highly relevant in Asia Pacific, Africa, and Latin America. Many of these firms are leveraging telehealth integration, smartphone-based imaging, and AI-powered diagnostic support to differentiate in low-resource settings.

As the market evolves, competitive differentiation is shifting from conventional portable screening toward multifunctional hybrid devices, AI-enabled detection, and integration with cloud-based diagnostic ecosystems. Players who can balance clinical reliability, affordability, and digital health integration are best positioned to consolidate share in this fast-expanding segment.

Key Developments:

  • In 2024, iSono Health has been awarded New Product Innovation Award for its FDA-approved ATUSA™, the world’s first automated, portable, and wearable 3D breast ultrasound. The device delivers fast, technician-free imaging, enhances patient comfort, and improves workflow efficiency in breast cancer screening.
  • In 2025, iSono Health raised $1.84 million to advance its AI-driven portable 3D breast ultrasound platform. The funding supports R&D, clinical trials, and platform enhancements. The wearable, automated device delivers whole-breast imaging in 2 minutes, enabling rapid, radiation-free, point-of-care screening and cloud-based AI diagnostics.

Scope of the Report

Item Value
Quantitative Units USD 410.4 million
Product type Screening Devices, Diagnostic Devices, and Hybrid Devices
Procedure Infrared Imaging Devices, Ultrasound-based Hand-held Devices, Microwave/Radio-frequency Devices, and Optical Imaging Devices
End User Hospitals, Specialty Cancer Clinics, Diagnostic Imaging Centers, and Mobile Screening Units/Outreach Programs
Regions Covered North America, Latin America, Western & Eastern Europe, East Asia, South Asia & Pacific, Middle East & Africa
Countries Covered USA, Brazil, China, India, Germany, France, UK etc.
Key Companies Profiled UE LifeSciences, Hologic, Inc., Shenzhen Bestman Instrument, Butterfly Network, Inc., Micrima Ltd, HCE Ghana Limited, iSono Health, Braster, Zhong Jie Electronics Technology, Shenzhen Bestman Instrument Co., Ltd., Others
Additional Attributes Dollar sales by application and regions, Ad option trends of Hybrid Devices, Rising demand in Specialty Cancer Clinics, Growing demand across Mobile Screening Programs

Key Segments

By Product Type:

  • Screening Devices
  • Diagnostic Devices
  • Hybrid Devices

By Procedure type:

  • Infrared Imaging Devices
  • Ultrasound-based Hand-held Devices
  • Microwave / Radio-frequency Devices
  • Optical Imaging Devices

By End User:

  • Hospitals
  • Specialty Cancer Clinics
  • Diagnostic Imaging Centers
  • Mobile Screening Value (USD Million) & Volume (Units)s / Outreach Programs

By Region:

  • North America
  • Latin America
  • East Asia
  • South Asia & Pacific
  • Western Europe
  • Eastern Europe
  • Middle East & Africa

Table of Content

  1. Executive Summary
    • Global Market Outlook
    • Demand-side Trends
    • Supply-side Trends
    • Technology Roadmap Analysis
    • Analysis and Recommendations
  2. Market Overview
    • Market Coverage / Taxonomy
    • Market Definition / Scope / Limitations
  3. Market Background
    • Market Dynamics
      • Drivers
      • Restraints
      • Opportunity
      • Trends
    • Scenario Forecast
      • Demand in Optimistic Scenario
      • Demand in Likely Scenario
      • Demand in Conservative Scenario
    • Opportunity Map Analysis
    • Product Life Cycle Analysis
    • Supply Chain Analysis
      • Supply Side Participants and their Roles
        • Producers
        • Mid-Level Participants (Traders/ Agents/ Brokers)
        • Wholesalers and Distributors
      • Value Added and Value Created at Node in the Supply Chain
      • List of Raw Material Suppliers
      • List of Existing and Potential Buyer’s
    • Investment Feasibility Matrix
    • Value Chain Analysis
      • Profit Margin Analysis
      • Wholesalers and Distributors
      • Retailers
    • PESTLE and Porter’s Analysis
    • Regulatory Landscape
      • By Key Regions
      • By Key Countries
    • Regional Parent Market Outlook
    • Production and Consumption Statistics
    • Import and Export Statistics
  4. Global Market Analysis 2020 to 2024 and Forecast, 2025 to 2035
    • Historical Market Size Value (USD Million) & Volume (Units) Analysis, 2020 to 2024
    • Current and Future Market Size Value (USD Million) & Volume (Units) Projections, 2025 to 2035
      • Y-o-Y Growth Trend Analysis
      • Absolute $ Opportunity Analysis
  5. Global Market Analysis 2020 to 2024 and Forecast 2025 to 2035, By Product Type
    • Introduction / Key Findings
    • Historical Market Size Value (USD Million) & Volume (Units) Analysis By Product Type, 2020 to 2024
    • Current and Future Market Size Value (USD Million) & Volume (Units) Analysis and Forecast By Product Type, 2025 to 2035
      • Screening Devices
      • Diagnostic Devices
      • Hybrid Devices
    • Y-o-Y Growth Trend Analysis By Product Type, 2020 to 2024
    • Absolute $ Opportunity Analysis By Product Type, 2025 to 2035
  6. Global Market Analysis 2020 to 2024 and Forecast 2025 to 2035, By Procedure type
    • Introduction / Key Findings
    • Historical Market Size Value (USD Million) & Volume (Units) Analysis By Procedure type, 2020 to 2024
    • Current and Future Market Size Value (USD Million) & Volume (Units) Analysis and Forecast By Procedure type, 2025 to 2035
      • Infrared Imaging Devices
      • Ultrasound-based Hand-held Devices
      • Microwave / Radio-frequency Devices
      • Optical Imaging Devices
    • Y-o-Y Growth Trend Analysis By Procedure type, 2020 to 2024
    • Absolute $ Opportunity Analysis By Procedure type, 2025 to 2035
  7. Global Market Analysis 2020 to 2024 and Forecast 2025 to 2035, By End User
    • Introduction / Key Findings
    • Historical Market Size Value (USD Million) & Volume (Units) Analysis By End User, 2020 to 2024
    • Current and Future Market Size Value (USD Million) & Volume (Units) Analysis and Forecast By End User, 2025 to 2035
      • Hospitals
      • Specialty Cancer Clinics
      • Diagnostic Imaging Centers
      • Mobile Screening Value (USD Million) & Volume (Units)s / Outreach Programs
    • Y-o-Y Growth Trend Analysis By End User, 2020 to 2024
    • Absolute $ Opportunity Analysis By End User, 2025 to 2035
  8. Global Market Analysis 2020 to 2024 and Forecast 2025 to 2035, By Region
    • Introduction
    • Historical Market Size Value (USD Million) & Volume (Units) Analysis By Region, 2020 to 2024
    • Current Market Size Value (USD Million) & Volume (Units) Analysis and Forecast By Region, 2025 to 2035
      • North America
      • Latin America
      • East Asia
      • South Asia & Pacific
      • Western Europe
      • Eastern Europe
      • Middle East & Africa
    • Market Attractiveness Analysis By Region
  9. North America Market Analysis 2020 to 2024 and Forecast 2025 to 2035, By Country
    • Historical Market Size Value (USD Million) & Volume (Units) Trend Analysis By Market Taxonomy, 2020 to 2024
    • Market Size Value (USD Million) & Volume (Units) Forecast By Market Taxonomy, 2025 to 2035
      • By Country
        • USA
        • Canada
        • Mexico
      • By Product Type
      • By Procedure type
      • By End User
    • Market Attractiveness Analysis
      • By Country
      • By Product Type
      • By Procedure type
      • By End User
    • Key Takeaways
  10. Latin America Market Analysis 2020 to 2024 and Forecast 2025 to 2035, By Country
    • Historical Market Size Value (USD Million) & Volume (Units) Trend Analysis By Market Taxonomy, 2020 to 2024
    • Market Size Value (USD Million) & Volume (Units) Forecast By Market Taxonomy, 2025 to 2035
      • By Country
        • Brazil
        • Argentina
        • Rest of Latin America
      • By Product Type
      • By Procedure type
      • By End User
    • Market Attractiveness Analysis
      • By Country
      • By Product Type
      • By Procedure type
      • By End User
    • Key Takeaways
  11. East Asia Market Analysis 2020 to 2024 and Forecast 2025 to 2035, By Country
    • Historical Market Size Value (USD Million) & Volume (Units) Trend Analysis By Market Taxonomy, 2020 to 2024
    • Market Size Value (USD Million) & Volume (Units) Forecast By Market Taxonomy, 2025 to 2035
      • By Country
        • China
        • Japan
        • South Korea
      • By Product Type
      • By Procedure type
      • By End User
    • Market Attractiveness Analysis
      • By Country
      • By Product Type
      • By Procedure type
      • By End User
    • Key Takeaways
  12. South Asia & Pacific Market Analysis 2020 to 2024 and Forecast 2025 to 2035, By Country
    • Historical Market Size Value (USD Million) & Volume (Units) Trend Analysis By Market Taxonomy, 2020 to 2024
    • Market Size Value (USD Million) & Volume (Units) Forecast By Market Taxonomy, 2025 to 2035
      • By Country
        • India
        • ASEAN Countries
        • Australia& New Zealand
        • Rest of South Asia
      • By Product Type
      • By Procedure type
      • By End User
    • Market Attractiveness Analysis
      • By Country
      • By Product Type
      • By Procedure type
      • By End User
    • Key Takeaways
  13. Western Europe Market Analysis 2020 to 2024 and Forecast 2025 to 2035, By Country
    • Historical Market Size Value (USD Million) & Volume (Units) Trend Analysis By Market Taxonomy, 2020 to 2024
    • Market Size Value (USD Million) & Volume (Units) Forecast By Market Taxonomy, 2025 to 2035
      • By Country
        • Germany
        • UK
        • France
        • Italy
        • Spain
        • BENELUX
        • Nordic Countries
        • Rest of Western Europe
      • By Product Type
      • By Procedure type
      • By End User
    • Market Attractiveness Analysis
      • By Country
      • By Product Type
      • By Procedure type
      • By End User
    • Key Takeaways
  14. Eastern Europe Market Analysis 2020 to 2024 and Forecast 2025 to 2035, By Country
    • Historical Market Size Value (USD Million) & Volume (Units) Trend Analysis By Market Taxonomy, 2020 to 2024
    • Market Size Value (USD Million) & Volume (Units) Forecast By Market Taxonomy, 2025 to 2035
      • By Country
        • Russia
        • Hungary
        • Poland
        • Rest of Eastern Europe
      • By Product Type
      • By Procedure type
      • By End User
    • Market Attractiveness Analysis
      • By Country
      • By Product Type
      • By Procedure type
      • By End User
    • Key Takeaways
  15. Middle East & Africa Market Analysis 2020 to 2024 and Forecast 2025 to 2035, By Country
    • Historical Market Size Value (USD Million) & Volume (Units) Trend Analysis By Market Taxonomy, 2020 to 2024
    • Market Size Value (USD Million) & Volume (Units) Forecast By Market Taxonomy, 2025 to 2035
      • By Country
        • Saudi Arabia
        • Türkiye
        • South Africa
        • Other African Union
        • Rest of Middle East & Africa
      • By Product Type
      • By Procedure type
      • By End User
    • Market Attractiveness Analysis
      • By Country
      • By Product Type
      • By Procedure type
      • By End User
    • Key Takeaways
  16. Key Countries Market Analysis
    • USA
      • Pricing Analysis
      • Market Share Analysis, 2024
        • By Product Type
        • By Procedure type
        • By End User
    • Brazil
      • Pricing Analysis
      • Market Share Analysis, 2024
        • By Product Type
        • By Procedure type
        • By End User
    • China
      • Pricing Analysis
      • Market Share Analysis, 2024
        • By Product Type
        • By Procedure type
        • By End User
    • India
      • Pricing Analysis
      • Market Share Analysis, 2024
        • By Product Type
        • By Procedure type
        • By End User
    • Europe
      • Pricing Analysis
      • Market Share Analysis, 2024
        • By Product Type
        • By Procedure type
        • By End User
    • Germany
      • Pricing Analysis
      • Market Share Analysis, 2024
        • By Product Type
        • By Procedure type
        • By End User
    • France
      • Pricing Analysis
      • Market Share Analysis, 2024
        • By Product Type
        • By Procedure type
        • By End User
    • UK
      • Pricing Analysis
      • Market Share Analysis, 2024
        • By Product Type
        • By Procedure type
        • By End User
  17. Market Structure Analysis
    • Competition Dashboard
    • Competition Benchmarking
    • Market Share Analysis of Top Players
      • By Regional
      • By Product Type
      • By Procedure type
      • By End User
  18. Competition Analysis
    • Competition Deep Dive
      • UE LifeSciences
        • Overview
        • Product Portfolio
        • Profitability by Market Segments (Product/Age /Sales Channel/Region)
        • Sales Footprint
        • Strategy Overview
          • Marketing Strategy
          • Product Strategy
          • Channel Strategy
      • Hologic, Inc.
        • Overview
        • Product Portfolio
        • Profitability by Market Segments (Product/Age /Sales Channel/Region)
        • Sales Footprint
        • Strategy Overview
          • Marketing Strategy
          • Product Strategy
          • Channel Strategy
      • Shenzhen Bestman Instrument
        • Overview
        • Product Portfolio
        • Profitability by Market Segments (Product/Age /Sales Channel/Region)
        • Sales Footprint
        • Strategy Overview
          • Marketing Strategy
          • Product Strategy
          • Channel Strategy
      • Butterfly Network, Inc.
        • Overview
        • Product Portfolio
        • Profitability by Market Segments (Product/Age /Sales Channel/Region)
        • Sales Footprint
        • Strategy Overview
          • Marketing Strategy
          • Product Strategy
          • Channel Strategy
      • Micrima Ltd
        • Overview
        • Product Portfolio
        • Profitability by Market Segments (Product/Age /Sales Channel/Region)
        • Sales Footprint
        • Strategy Overview
          • Marketing Strategy
          • Product Strategy
          • Channel Strategy
      • HCE Ghana Limited
        • Overview
        • Product Portfolio
        • Profitability by Market Segments (Product/Age /Sales Channel/Region)
        • Sales Footprint
        • Strategy Overview
          • Marketing Strategy
          • Product Strategy
          • Channel Strategy
      • iSono Health
        • Overview
        • Product Portfolio
        • Profitability by Market Segments (Product/Age /Sales Channel/Region)
        • Sales Footprint
        • Strategy Overview
          • Marketing Strategy
          • Product Strategy
          • Channel Strategy
      • Braster
        • Overview
        • Product Portfolio
        • Profitability by Market Segments (Product/Age /Sales Channel/Region)
        • Sales Footprint
        • Strategy Overview
          • Marketing Strategy
          • Product Strategy
          • Channel Strategy
      • Zhong Jie Electronics Technology
        • Overview
        • Product Portfolio
        • Profitability by Market Segments (Product/Age /Sales Channel/Region)
        • Sales Footprint
        • Strategy Overview
          • Marketing Strategy
          • Product Strategy
          • Channel Strategy
      • Shenzhen Bestman Instrument Co., Ltd.
        • Overview
        • Product Portfolio
        • Profitability by Market Segments (Product/Age /Sales Channel/Region)
        • Sales Footprint
        • Strategy Overview
          • Marketing Strategy
          • Product Strategy
          • Channel Strategy
      • Others
        • Overview
        • Product Portfolio
        • Profitability by Market Segments (Product/Age /Sales Channel/Region)
        • Sales Footprint
        • Strategy Overview
          • Marketing Strategy
          • Product Strategy
          • Channel Strategy
  19. Assumptions & Acronyms Used
  20. Research Methodology

List of Tables

  • Table 1: Global Market Value (USD Million) Forecast by Region, 2020-2035
  • Table 2: Global Market Volume (Units) Forecast by Region, 2020-2035
  • Table 3: Global Market Value (USD Million) Forecast by Product Type, 2020-2035
  • Table 4: Global Market Volume (Units) Forecast by Product Type, 2020-2035
  • Table 5: Global Market Value (USD Million) Forecast by Procedure type, 2020-2035
  • Table 6: Global Market Volume (Units) Forecast by Procedure type, 2020-2035
  • Table 7: Global Market Value (USD Million) Forecast by End User, 2020-2035
  • Table 8: Global Market Volume (Units) Forecast by End User, 2020-2035
  • Table 9: North America Market Value (USD Million) Forecast by Country, 2020-2035
  • Table 10: North America Market Volume (Units) Forecast by Country, 2020-2035
  • Table 11: North America Market Value (USD Million) Forecast by Product Type, 2020-2035
  • Table 12: North America Market Volume (Units) Forecast by Product Type, 2020-2035
  • Table 13: North America Market Value (USD Million) Forecast by Procedure type, 2020-2035
  • Table 14: North America Market Volume (Units) Forecast by Procedure type, 2020-2035
  • Table 15: North America Market Value (USD Million) Forecast by End User, 2020-2035
  • Table 16: North America Market Volume (Units) Forecast by End User, 2020-2035
  • Table 17: Latin America Market Value (USD Million) Forecast by Country, 2020-2035
  • Table 18: Latin America Market Volume (Units) Forecast by Country, 2020-2035
  • Table 19: Latin America Market Value (USD Million) Forecast by Product Type, 2020-2035
  • Table 20: Latin America Market Volume (Units) Forecast by Product Type, 2020-2035
  • Table 21: Latin America Market Value (USD Million) Forecast by Procedure type, 2020-2035
  • Table 22: Latin America Market Volume (Units) Forecast by Procedure type, 2020-2035
  • Table 23: Latin America Market Value (USD Million) Forecast by End User, 2020-2035
  • Table 24: Latin America Market Volume (Units) Forecast by End User, 2020-2035
  • Table 25: East Asia Market Value (USD Million) Forecast by Country, 2020-2035
  • Table 26: East Asia Market Volume (Units) Forecast by Country, 2020-2035
  • Table 27: East Asia Market Value (USD Million) Forecast by Product Type, 2020-2035
  • Table 28: East Asia Market Volume (Units) Forecast by Product Type, 2020-2035
  • Table 29: East Asia Market Value (USD Million) Forecast by Procedure type, 2020-2035
  • Table 30: East Asia Market Volume (Units) Forecast by Procedure type, 2020-2035
  • Table 31: East Asia Market Value (USD Million) Forecast by End User, 2020-2035
  • Table 32: East Asia Market Volume (Units) Forecast by End User, 2020-2035
  • Table 33: South Asia & Pacific Market Value (USD Million) Forecast by Country, 2020-2035
  • Table 34: South Asia & Pacific Market Volume (Units) Forecast by Country, 2020-2035
  • Table 35: South Asia & Pacific Market Value (USD Million) Forecast by Product Type, 2020-2035
  • Table 36: South Asia & Pacific Market Volume (Units) Forecast by Product Type, 2020-2035
  • Table 37: South Asia & Pacific Market Value (USD Million) Forecast by Procedure type, 2020-2035
  • Table 38: South Asia & Pacific Market Volume (Units) Forecast by Procedure type, 2020-2035
  • Table 39: South Asia & Pacific Market Value (USD Million) Forecast by End User, 2020-2035
  • Table 40: South Asia & Pacific Market Volume (Units) Forecast by End User, 2020-2035
  • Table 41: Western Europe Market Value (USD Million) Forecast by Country, 2020-2035
  • Table 42: Western Europe Market Volume (Units) Forecast by Country, 2020-2035
  • Table 43: Western Europe Market Value (USD Million) Forecast by Product Type, 2020-2035
  • Table 44: Western Europe Market Volume (Units) Forecast by Product Type, 2020-2035
  • Table 45: Western Europe Market Value (USD Million) Forecast by Procedure type, 2020-2035
  • Table 46: Western Europe Market Volume (Units) Forecast by Procedure type, 2020-2035
  • Table 47: Western Europe Market Value (USD Million) Forecast by End User, 2020-2035
  • Table 48: Western Europe Market Volume (Units) Forecast by End User, 2020-2035
  • Table 49: Eastern Europe Market Value (USD Million) Forecast by Country, 2020-2035
  • Table 50: Eastern Europe Market Volume (Units) Forecast by Country, 2020-2035
  • Table 51: Eastern Europe Market Value (USD Million) Forecast by Product Type, 2020-2035
  • Table 52: Eastern Europe Market Volume (Units) Forecast by Product Type, 2020-2035
  • Table 53: Eastern Europe Market Value (USD Million) Forecast by Procedure type, 2020-2035
  • Table 54: Eastern Europe Market Volume (Units) Forecast by Procedure type, 2020-2035
  • Table 55: Eastern Europe Market Value (USD Million) Forecast by End User, 2020-2035
  • Table 56: Eastern Europe Market Volume (Units) Forecast by End User, 2020-2035
  • Table 57: Middle East & Africa Market Value (USD Million) Forecast by Country, 2020-2035
  • Table 58: Middle East & Africa Market Volume (Units) Forecast by Country, 2020-2035
  • Table 59: Middle East & Africa Market Value (USD Million) Forecast by Product Type, 2020-2035
  • Table 60: Middle East & Africa Market Volume (Units) Forecast by Product Type, 2020-2035
  • Table 61: Middle East & Africa Market Value (USD Million) Forecast by Procedure type, 2020-2035
  • Table 62: Middle East & Africa Market Volume (Units) Forecast by Procedure type, 2020-2035
  • Table 63: Middle East & Africa Market Value (USD Million) Forecast by End User, 2020-2035
  • Table 64: Middle East & Africa Market Volume (Units) Forecast by End User, 2020-2035

List of Figures

  • Figure 1: Global Market Value (USD Million) by Product Type, 2025-2035
  • Figure 2: Global Market Value (USD Million) by Procedure type, 2025-2035
  • Figure 3: Global Market Value (USD Million) by End User, 2025-2035
  • Figure 4: Global Market Value (USD Million) by Region, 2025-2035
  • Figure 5: Global Market Value (USD Million) Analysis by Region, 2020-2035
  • Figure 6: Global Market Volume (Units) Analysis by Region, 2020-2035
  • Figure 7: Global Market Value Share (%) and BPS Analysis by Region, 2025-2035
  • Figure 8: Global Market Y-o-Y Growth (%) Projections by Region, 2025-2035
  • Figure 9: Global Market Value (USD Million) Analysis by Product Type, 2020-2035
  • Figure 10: Global Market Volume (Units) Analysis by Product Type, 2020-2035
  • Figure 11: Global Market Value Share (%) and BPS Analysis by Product Type, 2025-2035
  • Figure 12: Global Market Y-o-Y Growth (%) Projections by Product Type, 2025-2035
  • Figure 13: Global Market Value (USD Million) Analysis by Procedure type, 2020-2035
  • Figure 14: Global Market Volume (Units) Analysis by Procedure type, 2020-2035
  • Figure 15: Global Market Value Share (%) and BPS Analysis by Procedure type, 2025-2035
  • Figure 16: Global Market Y-o-Y Growth (%) Projections by Procedure type, 2025-2035
  • Figure 17: Global Market Value (USD Million) Analysis by End User, 2020-2035
  • Figure 18: Global Market Volume (Units) Analysis by End User, 2020-2035
  • Figure 19: Global Market Value Share (%) and BPS Analysis by End User, 2025-2035
  • Figure 20: Global Market Y-o-Y Growth (%) Projections by End User, 2025-2035
  • Figure 21: Global Market Attractiveness by Product Type, 2025-2035
  • Figure 22: Global Market Attractiveness by Procedure type, 2025-2035
  • Figure 23: Global Market Attractiveness by End User, 2025-2035
  • Figure 24: Global Market Attractiveness by Region, 2025-2035
  • Figure 25: North America Market Value (USD Million) by Product Type, 2025-2035
  • Figure 26: North America Market Value (USD Million) by Procedure type, 2025-2035
  • Figure 27: North America Market Value (USD Million) by End User, 2025-2035
  • Figure 28: North America Market Value (USD Million) by Country, 2025-2035
  • Figure 29: North America Market Value (USD Million) Analysis by Country, 2020-2035
  • Figure 30: North America Market Volume (Units) Analysis by Country, 2020-2035
  • Figure 31: North America Market Value Share (%) and BPS Analysis by Country, 2025-2035
  • Figure 32: North America Market Y-o-Y Growth (%) Projections by Country, 2025-2035
  • Figure 33: North America Market Value (USD Million) Analysis by Product Type, 2020-2035
  • Figure 34: North America Market Volume (Units) Analysis by Product Type, 2020-2035
  • Figure 35: North America Market Value Share (%) and BPS Analysis by Product Type, 2025-2035
  • Figure 36: North America Market Y-o-Y Growth (%) Projections by Product Type, 2025-2035
  • Figure 37: North America Market Value (USD Million) Analysis by Procedure type, 2020-2035
  • Figure 38: North America Market Volume (Units) Analysis by Procedure type, 2020-2035
  • Figure 39: North America Market Value Share (%) and BPS Analysis by Procedure type, 2025-2035
  • Figure 40: North America Market Y-o-Y Growth (%) Projections by Procedure type, 2025-2035
  • Figure 41: North America Market Value (USD Million) Analysis by End User, 2020-2035
  • Figure 42: North America Market Volume (Units) Analysis by End User, 2020-2035
  • Figure 43: North America Market Value Share (%) and BPS Analysis by End User, 2025-2035
  • Figure 44: North America Market Y-o-Y Growth (%) Projections by End User, 2025-2035
  • Figure 45: North America Market Attractiveness by Product Type, 2025-2035
  • Figure 46: North America Market Attractiveness by Procedure type, 2025-2035
  • Figure 47: North America Market Attractiveness by End User, 2025-2035
  • Figure 48: North America Market Attractiveness by Country, 2025-2035
  • Figure 49: Latin America Market Value (USD Million) by Product Type, 2025-2035
  • Figure 50: Latin America Market Value (USD Million) by Procedure type, 2025-2035
  • Figure 51: Latin America Market Value (USD Million) by End User, 2025-2035
  • Figure 52: Latin America Market Value (USD Million) by Country, 2025-2035
  • Figure 53: Latin America Market Value (USD Million) Analysis by Country, 2020-2035
  • Figure 54: Latin America Market Volume (Units) Analysis by Country, 2020-2035
  • Figure 55: Latin America Market Value Share (%) and BPS Analysis by Country, 2025-2035
  • Figure 56: Latin America Market Y-o-Y Growth (%) Projections by Country, 2025-2035
  • Figure 57: Latin America Market Value (USD Million) Analysis by Product Type, 2020-2035
  • Figure 58: Latin America Market Volume (Units) Analysis by Product Type, 2020-2035
  • Figure 59: Latin America Market Value Share (%) and BPS Analysis by Product Type, 2025-2035
  • Figure 60: Latin America Market Y-o-Y Growth (%) Projections by Product Type, 2025-2035
  • Figure 61: Latin America Market Value (USD Million) Analysis by Procedure type, 2020-2035
  • Figure 62: Latin America Market Volume (Units) Analysis by Procedure type, 2020-2035
  • Figure 63: Latin America Market Value Share (%) and BPS Analysis by Procedure type, 2025-2035
  • Figure 64: Latin America Market Y-o-Y Growth (%) Projections by Procedure type, 2025-2035
  • Figure 65: Latin America Market Value (USD Million) Analysis by End User, 2020-2035
  • Figure 66: Latin America Market Volume (Units) Analysis by End User, 2020-2035
  • Figure 67: Latin America Market Value Share (%) and BPS Analysis by End User, 2025-2035
  • Figure 68: Latin America Market Y-o-Y Growth (%) Projections by End User, 2025-2035
  • Figure 69: Latin America Market Attractiveness by Product Type, 2025-2035
  • Figure 70: Latin America Market Attractiveness by Procedure type, 2025-2035
  • Figure 71: Latin America Market Attractiveness by End User, 2025-2035
  • Figure 72: Latin America Market Attractiveness by Country, 2025-2035
  • Figure 73: East Asia Market Value (USD Million) by Product Type, 2025-2035
  • Figure 74: East Asia Market Value (USD Million) by Procedure type, 2025-2035
  • Figure 75: East Asia Market Value (USD Million) by End User, 2025-2035
  • Figure 76: East Asia Market Value (USD Million) by Country, 2025-2035
  • Figure 77: East Asia Market Value (USD Million) Analysis by Country, 2020-2035
  • Figure 78: East Asia Market Volume (Units) Analysis by Country, 2020-2035
  • Figure 79: East Asia Market Value Share (%) and BPS Analysis by Country, 2025-2035
  • Figure 80: East Asia Market Y-o-Y Growth (%) Projections by Country, 2025-2035
  • Figure 81: East Asia Market Value (USD Million) Analysis by Product Type, 2020-2035
  • Figure 82: East Asia Market Volume (Units) Analysis by Product Type, 2020-2035
  • Figure 83: East Asia Market Value Share (%) and BPS Analysis by Product Type, 2025-2035
  • Figure 84: East Asia Market Y-o-Y Growth (%) Projections by Product Type, 2025-2035
  • Figure 85: East Asia Market Value (USD Million) Analysis by Procedure type, 2020-2035
  • Figure 86: East Asia Market Volume (Units) Analysis by Procedure type, 2020-2035
  • Figure 87: East Asia Market Value Share (%) and BPS Analysis by Procedure type, 2025-2035
  • Figure 88: East Asia Market Y-o-Y Growth (%) Projections by Procedure type, 2025-2035
  • Figure 89: East Asia Market Value (USD Million) Analysis by End User, 2020-2035
  • Figure 90: East Asia Market Volume (Units) Analysis by End User, 2020-2035
  • Figure 91: East Asia Market Value Share (%) and BPS Analysis by End User, 2025-2035
  • Figure 92: East Asia Market Y-o-Y Growth (%) Projections by End User, 2025-2035
  • Figure 93: East Asia Market Attractiveness by Product Type, 2025-2035
  • Figure 94: East Asia Market Attractiveness by Procedure type, 2025-2035
  • Figure 95: East Asia Market Attractiveness by End User, 2025-2035
  • Figure 96: East Asia Market Attractiveness by Country, 2025-2035
  • Figure 97: South Asia & Pacific Market Value (USD Million) by Product Type, 2025-2035
  • Figure 98: South Asia & Pacific Market Value (USD Million) by Procedure type, 2025-2035
  • Figure 99: South Asia & Pacific Market Value (USD Million) by End User, 2025-2035
  • Figure 100: South Asia & Pacific Market Value (USD Million) by Country, 2025-2035
  • Figure 101: South Asia & Pacific Market Value (USD Million) Analysis by Country, 2020-2035
  • Figure 102: South Asia & Pacific Market Volume (Units) Analysis by Country, 2020-2035
  • Figure 103: South Asia & Pacific Market Value Share (%) and BPS Analysis by Country, 2025-2035
  • Figure 104: South Asia & Pacific Market Y-o-Y Growth (%) Projections by Country, 2025-2035
  • Figure 105: South Asia & Pacific Market Value (USD Million) Analysis by Product Type, 2020-2035
  • Figure 106: South Asia & Pacific Market Volume (Units) Analysis by Product Type, 2020-2035
  • Figure 107: South Asia & Pacific Market Value Share (%) and BPS Analysis by Product Type, 2025-2035
  • Figure 108: South Asia & Pacific Market Y-o-Y Growth (%) Projections by Product Type, 2025-2035
  • Figure 109: South Asia & Pacific Market Value (USD Million) Analysis by Procedure type, 2020-2035
  • Figure 110: South Asia & Pacific Market Volume (Units) Analysis by Procedure type, 2020-2035
  • Figure 111: South Asia & Pacific Market Value Share (%) and BPS Analysis by Procedure type, 2025-2035
  • Figure 112: South Asia & Pacific Market Y-o-Y Growth (%) Projections by Procedure type, 2025-2035
  • Figure 113: South Asia & Pacific Market Value (USD Million) Analysis by End User, 2020-2035
  • Figure 114: South Asia & Pacific Market Volume (Units) Analysis by End User, 2020-2035
  • Figure 115: South Asia & Pacific Market Value Share (%) and BPS Analysis by End User, 2025-2035
  • Figure 116: South Asia & Pacific Market Y-o-Y Growth (%) Projections by End User, 2025-2035
  • Figure 117: South Asia & Pacific Market Attractiveness by Product Type, 2025-2035
  • Figure 118: South Asia & Pacific Market Attractiveness by Procedure type, 2025-2035
  • Figure 119: South Asia & Pacific Market Attractiveness by End User, 2025-2035
  • Figure 120: South Asia & Pacific Market Attractiveness by Country, 2025-2035
  • Figure 121: Western Europe Market Value (USD Million) by Product Type, 2025-2035
  • Figure 122: Western Europe Market Value (USD Million) by Procedure type, 2025-2035
  • Figure 123: Western Europe Market Value (USD Million) by End User, 2025-2035
  • Figure 124: Western Europe Market Value (USD Million) by Country, 2025-2035
  • Figure 125: Western Europe Market Value (USD Million) Analysis by Country, 2020-2035
  • Figure 126: Western Europe Market Volume (Units) Analysis by Country, 2020-2035
  • Figure 127: Western Europe Market Value Share (%) and BPS Analysis by Country, 2025-2035
  • Figure 128: Western Europe Market Y-o-Y Growth (%) Projections by Country, 2025-2035
  • Figure 129: Western Europe Market Value (USD Million) Analysis by Product Type, 2020-2035
  • Figure 130: Western Europe Market Volume (Units) Analysis by Product Type, 2020-2035
  • Figure 131: Western Europe Market Value Share (%) and BPS Analysis by Product Type, 2025-2035
  • Figure 132: Western Europe Market Y-o-Y Growth (%) Projections by Product Type, 2025-2035
  • Figure 133: Western Europe Market Value (USD Million) Analysis by Procedure type, 2020-2035
  • Figure 134: Western Europe Market Volume (Units) Analysis by Procedure type, 2020-2035
  • Figure 135: Western Europe Market Value Share (%) and BPS Analysis by Procedure type, 2025-2035
  • Figure 136: Western Europe Market Y-o-Y Growth (%) Projections by Procedure type, 2025-2035
  • Figure 137: Western Europe Market Value (USD Million) Analysis by End User, 2020-2035
  • Figure 138: Western Europe Market Volume (Units) Analysis by End User, 2020-2035
  • Figure 139: Western Europe Market Value Share (%) and BPS Analysis by End User, 2025-2035
  • Figure 140: Western Europe Market Y-o-Y Growth (%) Projections by End User, 2025-2035
  • Figure 141: Western Europe Market Attractiveness by Product Type, 2025-2035
  • Figure 142: Western Europe Market Attractiveness by Procedure type, 2025-2035
  • Figure 143: Western Europe Market Attractiveness by End User, 2025-2035
  • Figure 144: Western Europe Market Attractiveness by Country, 2025-2035
  • Figure 145: Eastern Europe Market Value (USD Million) by Product Type, 2025-2035
  • Figure 146: Eastern Europe Market Value (USD Million) by Procedure type, 2025-2035
  • Figure 147: Eastern Europe Market Value (USD Million) by End User, 2025-2035
  • Figure 148: Eastern Europe Market Value (USD Million) by Country, 2025-2035
  • Figure 149: Eastern Europe Market Value (USD Million) Analysis by Country, 2020-2035
  • Figure 150: Eastern Europe Market Volume (Units) Analysis by Country, 2020-2035
  • Figure 151: Eastern Europe Market Value Share (%) and BPS Analysis by Country, 2025-2035
  • Figure 152: Eastern Europe Market Y-o-Y Growth (%) Projections by Country, 2025-2035
  • Figure 153: Eastern Europe Market Value (USD Million) Analysis by Product Type, 2020-2035
  • Figure 154: Eastern Europe Market Volume (Units) Analysis by Product Type, 2020-2035
  • Figure 155: Eastern Europe Market Value Share (%) and BPS Analysis by Product Type, 2025-2035
  • Figure 156: Eastern Europe Market Y-o-Y Growth (%) Projections by Product Type, 2025-2035
  • Figure 157: Eastern Europe Market Value (USD Million) Analysis by Procedure type, 2020-2035
  • Figure 158: Eastern Europe Market Volume (Units) Analysis by Procedure type, 2020-2035
  • Figure 159: Eastern Europe Market Value Share (%) and BPS Analysis by Procedure type, 2025-2035
  • Figure 160: Eastern Europe Market Y-o-Y Growth (%) Projections by Procedure type, 2025-2035
  • Figure 161: Eastern Europe Market Value (USD Million) Analysis by End User, 2020-2035
  • Figure 162: Eastern Europe Market Volume (Units) Analysis by End User, 2020-2035
  • Figure 163: Eastern Europe Market Value Share (%) and BPS Analysis by End User, 2025-2035
  • Figure 164: Eastern Europe Market Y-o-Y Growth (%) Projections by End User, 2025-2035
  • Figure 165: Eastern Europe Market Attractiveness by Product Type, 2025-2035
  • Figure 166: Eastern Europe Market Attractiveness by Procedure type, 2025-2035
  • Figure 167: Eastern Europe Market Attractiveness by End User, 2025-2035
  • Figure 168: Eastern Europe Market Attractiveness by Country, 2025-2035
  • Figure 169: Middle East & Africa Market Value (USD Million) by Product Type, 2025-2035
  • Figure 170: Middle East & Africa Market Value (USD Million) by Procedure type, 2025-2035
  • Figure 171: Middle East & Africa Market Value (USD Million) by End User, 2025-2035
  • Figure 172: Middle East & Africa Market Value (USD Million) by Country, 2025-2035
  • Figure 173: Middle East & Africa Market Value (USD Million) Analysis by Country, 2020-2035
  • Figure 174: Middle East & Africa Market Volume (Units) Analysis by Country, 2020-2035
  • Figure 175: Middle East & Africa Market Value Share (%) and BPS Analysis by Country, 2025-2035
  • Figure 176: Middle East & Africa Market Y-o-Y Growth (%) Projections by Country, 2025-2035
  • Figure 177: Middle East & Africa Market Value (USD Million) Analysis by Product Type, 2020-2035
  • Figure 178: Middle East & Africa Market Volume (Units) Analysis by Product Type, 2020-2035
  • Figure 179: Middle East & Africa Market Value Share (%) and BPS Analysis by Product Type, 2025-2035
  • Figure 180: Middle East & Africa Market Y-o-Y Growth (%) Projections by Product Type, 2025-2035
  • Figure 181: Middle East & Africa Market Value (USD Million) Analysis by Procedure type, 2020-2035
  • Figure 182: Middle East & Africa Market Volume (Units) Analysis by Procedure type, 2020-2035
  • Figure 183: Middle East & Africa Market Value Share (%) and BPS Analysis by Procedure type, 2025-2035
  • Figure 184: Middle East & Africa Market Y-o-Y Growth (%) Projections by Procedure type, 2025-2035
  • Figure 185: Middle East & Africa Market Value (USD Million) Analysis by End User, 2020-2035
  • Figure 186: Middle East & Africa Market Volume (Units) Analysis by End User, 2020-2035
  • Figure 187: Middle East & Africa Market Value Share (%) and BPS Analysis by End User, 2025-2035
  • Figure 188: Middle East & Africa Market Y-o-Y Growth (%) Projections by End User, 2025-2035
  • Figure 189: Middle East & Africa Market Attractiveness by Product Type, 2025-2035
  • Figure 190: Middle East & Africa Market Attractiveness by Procedure type, 2025-2035
  • Figure 191: Middle East & Africa Market Attractiveness by End User, 2025-2035
  • Figure 192: Middle East & Africa Market Attractiveness by Country, 2025-2035

Frequently Asked Questions

How big is the Hand-held Breast Cancer Detection Market in 2025?

The global Hand-held Breast Cancer Detection Market is estimated to be valued at USD 410.4 million in 2025.

What will be the size of the Hand-held Breast Cancer Detection Market in 2035?

The market size for Hand-held Breast Cancer Detection is projected to reach USD 707.7 million by 2035.

How much will the Hand-held Breast Cancer Detection Market grow between 2025 and 2035?

The Hand-held Breast Cancer Detection Market is expected to grow at a CAGR of 5.6% during this period.

What are the key product types in the Hand-held Breast Cancer Detection Market?

Key product types include Screening Devices, Diagnostic Devices, and Hybrid Devices.

Which end-user segment will contribute a significant share in the Hand-held Breast Cancer Detection Market in 2025?

Hospitals are projected to command 34.3% of the market in 2025, followed closely by specialty cancer clinics and mobile screening units.

Explore Similar Insights

Future Market Insights

Hand-held Breast Cancer Detection Market