Breast Reconstruction Meshes Market Size and Share Forecast Outlook From 2025 to 2035

The breast reconstruction meshes market is expanding steadily, supported by the global rise in breast cancer surgeries and increased awareness of post-mastectomy reconstruction options. Medical journals and hospital group reports have emphasized a growing emphasis on aesthetic and functional outcomes, driving the integration of meshes into reconstructive procedures.

Plastic surgeons and oncology care teams have increasingly adopted mesh materials to improve implant positioning, reduce complication rates, and optimize long-term results. Innovations in mesh fabrication and polymer science have led to the development of safer, more compatible products that reduce foreign body reactions and improve integration with soft tissues.

Furthermore, national health policies and reimbursement reforms in several countries have facilitated patient access to reconstructive surgeries, increasing procedural volumes. Strategic collaborations between mesh manufacturers and reconstructive surgery centers have accelerated clinical adoption of newer mesh formats, particularly in implant-based approaches. As patient preference shifts toward individualized care and less invasive reconstructive techniques, the market is expected to grow, with synthetic and absorbable mesh products leading the shift toward enhanced clinical outcomes and procedural efficiency.
Quick Stats for Breast Reconstruction Meshes Market

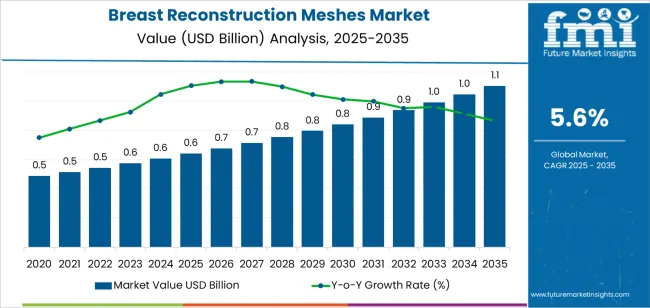
  • Breast Reconstruction Meshes Market Industry Value (2025): USD 0.6 billion
  • Breast Reconstruction Meshes Market Forecast Value (2035): USD 1.1 billion
  • Breast Reconstruction Meshes Market Forecast CAGR: 5.6%
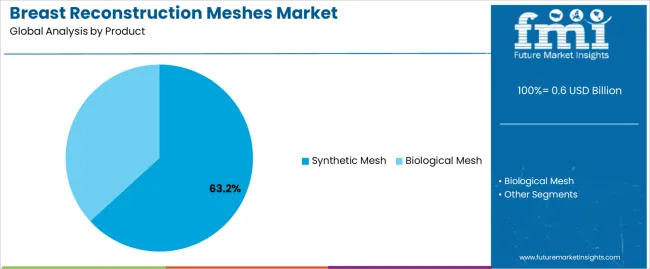
  • Leading Segment in Breast Reconstruction Meshes Market in 2025: Synthetic Mesh (63.2%)
  • Key Growth Region in Breast Reconstruction Meshes Market: North America, Asia-Pacific, Europe
  • Top Key Players in Breast Reconstruction Meshes Market: SERAG-WIESSNER GmbH & Co. KG, Novus Scientific, pfm medical, Allergan Aesthetics, Cook Biotech, MedSkin Solutions Dr. Suwelack AG, Tutogen Medical GmbH, Becton, Dickinson and Company, RTI Surgical, Stryker Corporation, PolyNovo, MTF Biologics, Tissue Regenix, Aziyo Biologics, Advanced Biomedical Concept Srl, Biomedica

Breast Reconstruction Meshes Market Market Value Analysis

Metric Value
Breast Reconstruction Meshes Market Estimated Value in (2025 E) USD 0.6 billion
Breast Reconstruction Meshes Market Forecast Value in (2035 F) USD 1.1 billion
Forecast CAGR (2025 to 2035) 5.6%

Segmental Analysis:

The market is segmented by Product, Nature, Application, and End User and region. By Product, the market is divided into Synthetic Mesh and Biological Mesh. In terms of Nature, the market is classified into Absorbable Mesh, Nonabsorbable Mesh, Resorbable Surgical Mesh, and Non-Resorbable Surgical Mesh. Based on Application, the market is segmented into Implant-Based Reconstruction, Autologous Tissue Reconstruction, Pre-Pectoral Reconstruction, Sub-Pectoral Reconstruction, Revision Surgeries, and Congenital Asymmetry/Deformity Surgery. By End User, the market is divided into Hospitals, Ambulatory Surgical Centers, Specialty Clinics, Comprehensive Cancer Centers, Plastic Surgery Clinics, and Academic & Research Institutes. Regionally, the market is classified into North America, Latin America, Western Europe, Eastern Europe, Balkan & Baltic Countries, Russia & Belarus, Central Asia, East Asia, South Asia & Pacific, and the Middle East & Africa.
Insights into the Product Segment: Synthetic Mesh

Breast Reconstruction Meshes Market Analysis By Product

The Synthetic Mesh segment is projected to account for 63.2% of the breast reconstruction meshes market revenue in 2025, making it the dominant product category. This segment’s growth has been propelled by the high tensile strength, cost efficiency, and widespread availability of synthetic mesh materials.

Healthcare providers have favored synthetic meshes in reconstructive procedures due to their consistent performance in implant stabilization and ability to maintain structural integrity over time. Product development reports have highlighted ongoing innovation in lightweight, macroporous mesh designs that reduce tissue irritation and promote better tissue ingrowth.

Moreover, synthetic meshes have been adopted more broadly in hospital settings where affordability and procedural standardization are prioritized. The segment has also benefited from a well-established safety profile and lower material costs compared to biologic alternatives, making it an attractive choice in both public and private healthcare institutions. These advantages have reinforced the leading role of synthetic mesh in a market that continues to prioritize durable, reproducible reconstructive outcomes.
Insights into the Nature Segment: Absorbable Mesh

Breast Reconstruction Meshes Market Analysis By Nature

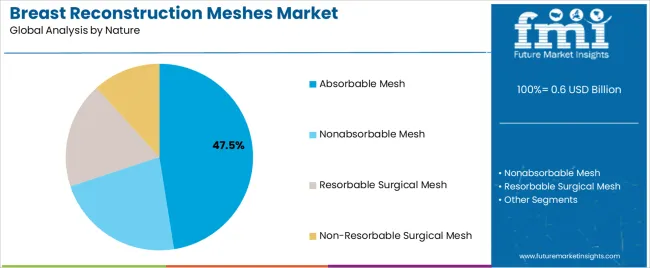
The Absorbable Mesh segment is projected to capture 47.5% of the breast reconstruction meshes market revenue in 2025, reflecting its growing acceptance in clinical practice. Surgeons have increasingly preferred absorbable meshes for their ability to provide temporary reinforcement during the critical phases of wound healing and implant stabilization.

Clinical studies and surgical society recommendations have noted reduced long-term foreign body complications associated with absorbable materials, especially in patients with thinner tissue coverage or those undergoing radiation therapy. The segment’s growth has been further supported by advances in biodegradable polymer technologies that ensure controlled resorption rates and predictable mechanical support.

Absorbable meshes have also gained traction in enhanced recovery protocols, where minimizing long-term implant burden is prioritized. As patient safety and minimally invasive surgical principles become more integral to reconstructive planning, the absorbable mesh segment is expected to expand its clinical footprint, offering an ideal solution in selected patient profiles.
Insights into the Application Segment: Implant-Based Reconstruction

Breast Reconstruction Meshes Market Analysis By Application

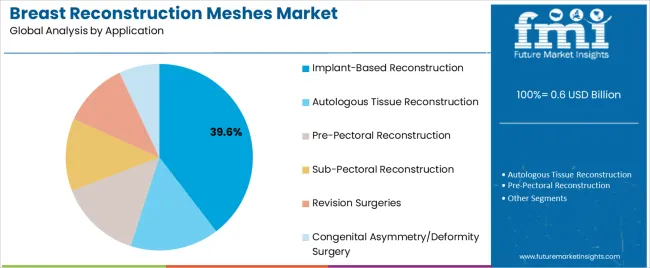
The Implant-Based Reconstruction segment is projected to contribute 39.6% of the breast reconstruction meshes market revenue in 2025, leading among all application segments. Growth of this segment has been driven by the increasing global preference for implant-based procedures, which are typically less invasive and offer shorter recovery times compared to autologous reconstruction.

Hospital data and surgical trends have shown a rise in one- and two-stage implant reconstructions, particularly in post-mastectomy cases, where meshes are utilized to support implant positioning and reduce complications such as capsular contracture. Mesh integration in implant-based reconstructions has enabled improved cosmetic outcomes and expanded surgical options, especially in direct-to-implant procedures.

Additionally, increasing availability of acellular and synthetic mesh options tailored for implant-based techniques has simplified surgical workflows and improved patient satisfaction. The combination of procedural efficiency, surgeon familiarity, and favorable aesthetic outcomes has secured the Implant-Based Reconstruction segment’s position as a key contributor to market revenue and future growth.

Comparison of Historical vs Forecast Outlook for Breast Reconstruction Meshes Sales (2020 to 2024 vs 2025 to 2035)

Global breast reconstruction meshes market attained a CAGR of 5.5% from 2020 to 2025. For the next ten years, from 2025 to 2035, projections are that expenditure on breast reconstruction meshes will attain a 5.6% CAGR through 2035.

There is a growing emphasis on physical appearance in society, which has led to an increase in demand for cosmetic procedures, including breast reconstruction surgery and treatment. Breast reconstruction can help women feel more confident and comfortable with their bodies after a mastectomy or lumpectomy due to breast cancer or other medical conditions.

A major driving factor for the growth of the industry is the increasing importance of physical appearance. Society places a high value on physical beauty, and many people view cosmetic procedures as a way to improve their appearance and boost their self-confidence. Breast reconstruction surgery can help women feel more confident and comfortable with their bodies, which can improve their overall quality of life.

In addition to the increasing importance of physical appearance, advancements in technology and surgical techniques have also contributed to the growth of the breast reconstruction surgery and treatment industry.

Newer techniques, such as nipple-sparing mastectomy and fat grafting, have improved the outcomes of breast reconstruction surgery and made the procedure more accessible to women.

Advances in breast reconstruction technology and techniques have led to significantly improved cosmetic outcomes, with more natural-looking results that can help restore a woman's sense of self and femininity. As women continue to place greater importance on their appearance and body image, the demand for breast reconstruction surgery is expected to grow.

The increasing emphasis on physical appearance in society is driving the growth of the breast reconstruction surgery and treatment industry. Breast reconstruction surgery can help women feel more confident and comfortable with their bodies, which can improve their overall quality of life.

The industry is expected to continue to grow in the coming years due to advancements in technology and surgical techniques, as well as increasing demand for the procedure.

Market Concentration in the Global Breast Reconstruction Meshes Industry

Tier 1 companies in the global breast reconstruction mesh market include prominent names such as Allergan, Johnson & Johnson, and Stryker. They are developing improved mesh materials, increasing product portfolios, and pursuing strategic acquisitions.

They aim to enhance mesh biocompatibility, tissue integration, and surgical results. These corporations additionally make investments in clinical research and work with healthcare experts on product development. In 2025, tier 1 companies are anticipated to acquire a 63.9% market share owing to the above factors.

Tier 2 companies are aiming for scalability by prioritizing cost-effective production, increasing product differentiation, and entering new markets. They use novel technologies and materials to increase mesh performance and compete with Tier 1 companies. These companies also prioritize strategic relationships and cooperation with medical experts and institutions to expand their industry presence.

Tier 2 enterprises hope to increase industry share and growth by investing in research and development and developing distribution networks. The tier 2 companies are likely to garner a 23.2% market share in 2025. A few of the tier 2 companies include SERAG-WIESSNER GmbH & Co. KG, Novus Scientific, PFM medical, Cook Biotech, and MedSkin Solutions Dr. Suwelack AG.

Tier 3 companies in the breast reconstruction mesh industry, like Advanced Biomedical Concept Srl and Biomedica, play critical roles by emphasizing niche markets and specialized products. They frequently propose novel, specialized solutions that address unique patient demands and surgical approaches.

These firms promote competition, innovation, and individualized customer service, all of which contribute to the overall diversity and progress of the industry. They may also function as nimble, adaptive partners in cooperation with larger corporations and research institutes.

Analysis of Top Countries Using and Regulating Breast Reconstruction Meshes

The following table shows the estimated growth rates of the top three markets. The United States, India and the United Kingdom are set to exhibit dominance in breast reconstruction industry, recording CAGRs of 5.4%, 4.5% and 4.4%, respectively, through 2035.

Countries CAGR 2025 to 2035
USA 5.4%
India 4.5%
UK 4.4%
Germany 4.8%
China 5.3%

United States to Retain Dominance in Breast Reconstruction Meshes Market

The industry for breast reconstruction meshes in the United States is projected to exhibit a CAGR of 5.4% during the assessment period. By 2035, breast reconstruction meshes industry size in the country is expected to reach USD 468.7 million.

The United States dominates the breast reconstruction industry due to a high prevalence of breast cancer, advanced medical technologies, supportive healthcare policies, and leading industry players like Johnson & Johnson and Allergan driving innovation and accessibility.

Demand Outlook for Breast Reconstruction Meshes in India

The market for breast reconstruction meshes in the India is projected to exhibit a CAGR of 4.5% during the assessment period. By 2035, breast reconstruction meshes market size in the country is expected to reach USD 27.9 million.

India has been continuously improving its healthcare infrastructure, including the adoption of advanced surgical techniques and medical devices. This enhancement facilitates the use of sophisticated products like breast reconstruction meshes.

Indian manufacturers and healthcare providers are incorporating the latest technologies in mesh production and surgical procedures, ensuring higher success rates and better patient outcomes. Such factors collectively make India a significant player in the breast reconstruction meshes industry.

The United Kingdom to be the Next-door Opportunity for the Manufacturers

The industry for breast reconstruction meshes in the United Kingdom is projected to exhibit a CAGR of 4.4% during the assessment period. By 2035, breast reconstruction meshes market size in the country is expected to reach USD 52.3 million.

The United Kingdom has a significant number of breast cancer cases, increasing the demand for breast reconstruction procedures that often utilize meshes.

The regional healthcare infrastructure, including the National Health Service (NHS), supports advanced surgical techniques and provides widespread access to breast reconstruction options, promoting the use of reconstruction meshes. Such factors collectively position the United Kingdom as a significant player in the breast reconstruction meshes industry.

Breast Reconstruction Meshes Industry Analysis by Top Investment Segments

Synthetic Mesh Dominates the Product Segment

Segment Polypropylene (Form Product)
Value Share (2025) 32.1%

The industry value of synthetic mesh in breast reconstruction meshes is USD 0.6 million, representing a sizable 55.4% market share in 2025.

Synthetic meshes are generally less expensive compared to biological alternatives, making them a preferred choice in many healthcare systems. This cost advantage extends their accessibility and usage in various reconstructive procedures.

Advances in the materials used for synthetic meshes, such as titanium-coated polypropylene (e.g., TiLOOP), have improved their biocompatibility. These meshes show good integration with surrounding tissues and reduced inflammatory responses, which enhances their safety and effectiveness in breast reconstruction

Absorbable Mesh lead the Nature Segment in Breast Reconstruction Meshes Market

Segment Absorbable Mesh (From Nature)
Value Share (2025) 32.8%

The industry value of absorbable mesh in breast reconstruction meshes is USD 188.8 million, representing a sizable 32.8% market share in 2025.

Absorbable meshes integrate well with natural tissue, reducing long-term complications. They tend to have lower rates of infection and other post-surgical complications compared to permanent meshes.

Innovations like the TIGR Matrix provide staged degradation, offering temporary support while gradually being absorbed, leading to better aesthetic outcomes. Advantages as such contribute to the growing preference for absorbable meshes in breast reconstruction surgeries.

Leading Application in Breast Reconstruction Meshes Market

Segment Implant-based reconstruction (Form Application)
Value Share (2025) 24.0%

Implant-based reconstruction is projected to register a CAGR of 4.8% from 2025 to 2035.

Implant-based reconstructions are highly preferred post-mastectomy due to their effectiveness in achieving desired aesthetic outcomes. Innovations in implant materials and techniques, such as the use of synthetic meshes and acellular dermal matrices (ADMs), enhance procedural success and patient satisfaction.

These factors collectively contribute to the leading position of implant-based reconstruction in the breast reconstruction meshes market.

Leading End User in Breast Reconstruction Meshes Market

Segment Hospitals (Form End User)
Value Share (2025) 29.6%

Hospitals is projected to register a CAGR of 4.6% from 2025 to 2035.

Hospitals typically procure and utilize various medical devices and products, including breast reconstruction meshes, to provide reconstructive surgeries for patients who have undergone mastectomies due to breast cancer or other medical reasons.

As leading end-users in the breast reconstruction meshes market, hospitals are responsible for assessing the quality, efficacy, and safety of these products.
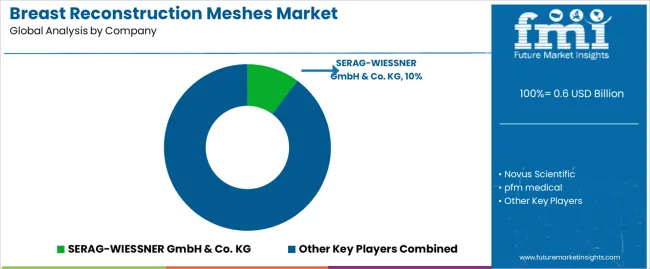
Key Breast Reconstruction Meshes Market Players and Competitive Outlook

Breast Reconstruction Meshes Market Analysis By Company

The breast reconstruction meshes ecosystem encompasses a diverse and dynamic competitive landscape. Leading meshes manufacturing companies are focusing on research and development, sustainable sourcing, and new formulations and biomaterials.

They are also emphasizing environment-friendly practices and product certifications to satisfy the increasing demand for natural and sustainable ingredients.

Manufacturers are also looking to preserve their market position by focusing on product quality, innovation, and matching varied customer preferences. Such mesh producers are working on innovating new biomaterials and combination of therapies which can be used in their products for added benefits.

For instance

  • In January 2025, RTI Surgical, an industry-leading contract development and manufacturing organization (CDMO), serving the regenerative medicine industry, announced that it has signed a definitive agreement to acquire Cook Biotech Incorporated, a leader in advanced tissue-repair products from biomaterials, headquartered in West Lafayette, Indiana.

Leading Breast Reconstruction Meshes Brands by Market Share

  • SERAG-WIESSNER GmbH & Co. KG
  • Novus Scientific
  • PFM medical
  • Allergan Aesthetics
  • Cook Biotech
  • MedSkin Solutions Dr. Suwelack AG
  • Tutogen Medical GmbH
  • Becton, Dickinson and Company
  • RTI Surgical
  • Stryker Corporation
  • PolyNovo
  • MTF Biologics
  • Tissue Regenix
  • Aziyo Biologics
  • Advanced Biomedical Concept Srl
  • Biomedica

Top Investment Segments Studied in the Breast Reconstruction Meshes Market

By Product:

As per product, the industry has been categorized into Synthetic Mesh- (Polypropylene, Polyester (Polyethylene Terephthalate, PET), Polytetrafluoroethylene (PTFE), Polyvinylidene Fluoride (PVDF) and Expanded Polytetrafluoroethylene (ePTFE). Biological Mesh- (Bovine [Bovine Pericardium, Bovine Collagen]), (Porcine [Porcine Skin, Porcine Small Intestine] & Human

By Nature:

This segment is further categorized into absorbable mesh, nonabsorbable mesh, resorbable surgical mesh and non resorbable surgical mesh

By Application:

Different applications include implant-based reconstruction, autologous tissue reconstruction, pre-pectoral reconstruction, sub-pectoral reconstruction, revision surgeries and congenital asymmetry/deformity surgery.

By End User:

The end user segment includes hospitals, ambulatory surgical centers, speciality clinics, comprehensive cancer centers, plastic surgery clinics and academic & research institutes

By Region:

Industry analysis has been carried out in key countries of North America, Latin America, East Asia, South Asia & Pacific, Western Europe, Eastern Europe and Middle East & Africa

Frequently Asked Questions

How big is the breast reconstruction meshes market in 2025?

The global breast reconstruction meshes market is estimated to be valued at USD 0.6 billion in 2025.

What will be the size of breast reconstruction meshes market in 2035?

The market size for the breast reconstruction meshes market is projected to reach USD 1.1 billion by 2035.

How much will be the breast reconstruction meshes market growth between 2025 and 2035?

The breast reconstruction meshes market is expected to grow at a 5.6% CAGR between 2025 and 2035.

What are the key product types in the breast reconstruction meshes market?

The key product types in breast reconstruction meshes market are synthetic mesh, _polypropylene, _polyester (polyethylene terephthalate, pet), _polytetrafluoroethylene (ptfe), _polyvinylidene fluoride (pvdf), _expanded polytetrafluoroethylene (eptfe), biological mesh, _bovine, _bovine pericardium, _bovine collagen, _porcine, _porcine skin, _porcine small intestine and _human.

Which nature segment to contribute significant share in the breast reconstruction meshes market in 2025?

In terms of nature, absorbable mesh segment to command 47.5% share in the breast reconstruction meshes market in 2025.

Table of Content

  1. Executive Summary
    • Global Market Outlook
    • Demand to side Trends
    • Supply to side Trends
    • Technology Roadmap Analysis
    • Analysis and Recommendations
  2. Market Overview
    • Market Coverage / Taxonomy
    • Market Definition / Scope / Limitations
  3. Market Background
    • Market Dynamics
      • Drivers
      • Restraints
      • Opportunity
      • Trends
    • Scenario Forecast
      • Demand in Optimistic Scenario
      • Demand in Likely Scenario
      • Demand in Conservative Scenario
    • Opportunity Map Analysis
    • Product Life Cycle Analysis
    • Supply Chain Analysis
    • Investment Feasibility Matrix
    • Value Chain Analysis
    • PESTLE and Porter’s Analysis
    • Regulatory Landscape
    • Regional Parent Market Outlook
    • Production and Consumption Statistics
    • Import and Export Statistics
  4. Global Market Analysis 2020 to 2024 and Forecast, 2025 to 2035
    • Historical Market Size Value (USD Million) Analysis, 2020 to 2024
    • Current and Future Market Size Value (USD Million) Projections, 2025 to 2035
      • Y to o to Y Growth Trend Analysis
      • Absolute $ Opportunity Analysis
  5. Global Market Pricing Analysis 2020 to 2024 and Forecast 2025 to 2035
  6. Global Market Analysis 2020 to 2024 and Forecast 2025 to 2035, By Product
    • Introduction / Key Findings
    • Historical Market Size Value (USD Million) Analysis By Product , 2020 to 2024
    • Current and Future Market Size Value (USD Million) Analysis and Forecast By Product , 2025 to 2035
      • Synthetic Mesh
        • Polypropylene
        • Polyester (Polyethylene Terephthalate, PET)
        • Polytetrafluoroethylene (PTFE)
        • Polyvinylidene Fluoride (PVDF)
        • Expanded Polytetrafluoroethylene (ePTFE)
      • Biological Mesh
        • Bovine
        • Bovine Pericardium
        • Bovine Collagen
        • Porcine
        • Porcine Skin
    • Y to o to Y Growth Trend Analysis By Product , 2020 to 2024
    • Absolute $ Opportunity Analysis By Product , 2025 to 2035
  7. Global Market Analysis 2020 to 2024 and Forecast 2025 to 2035, By Nature
    • Introduction / Key Findings
    • Historical Market Size Value (USD Million) Analysis By Nature, 2020 to 2024
    • Current and Future Market Size Value (USD Million) Analysis and Forecast By Nature, 2025 to 2035
      • Absorbable Mesh
      • Nonabsorbable Mesh
      • Resorbable Surgical Mesh
      • Non-Resorbable Surgical Mesh
    • Y to o to Y Growth Trend Analysis By Nature, 2020 to 2024
    • Absolute $ Opportunity Analysis By Nature, 2025 to 2035
  8. Global Market Analysis 2020 to 2024 and Forecast 2025 to 2035, By Application
    • Introduction / Key Findings
    • Historical Market Size Value (USD Million) Analysis By Application, 2020 to 2024
    • Current and Future Market Size Value (USD Million) Analysis and Forecast By Application, 2025 to 2035
      • Implant-Based Reconstruction
      • Autologous Tissue Reconstruction
      • Pre-Pectoral Reconstruction
      • Sub-Pectoral Reconstruction
      • Revision Surgeries
      • Congenital Asymmetry/Deformity Surgery
    • Y to o to Y Growth Trend Analysis By Application, 2020 to 2024
    • Absolute $ Opportunity Analysis By Application, 2025 to 2035
  9. Global Market Analysis 2020 to 2024 and Forecast 2025 to 2035, By End User
    • Introduction / Key Findings
    • Historical Market Size Value (USD Million) Analysis By End User, 2020 to 2024
    • Current and Future Market Size Value (USD Million) Analysis and Forecast By End User, 2025 to 2035
      • Hospitals
      • Ambulatory Surgical Centers
      • Specialty Clinics
      • Comprehensive Cancer Centers
      • Plastic Surgery Clinics
      • Academic & Research Institutes
    • Y to o to Y Growth Trend Analysis By End User, 2020 to 2024
    • Absolute $ Opportunity Analysis By End User, 2025 to 2035
  10. Global Market Analysis 2020 to 2024 and Forecast 2025 to 2035, By Region
    • Introduction
    • Historical Market Size Value (USD Million) Analysis By Region, 2020 to 2024
    • Current Market Size Value (USD Million) Analysis and Forecast By Region, 2025 to 2035
      • North America
      • Latin America
      • Western Europe
      • Eastern Europe
      • East Asia
      • South Asia and Pacific
      • Middle East & Africa
    • Market Attractiveness Analysis By Region
  11. North America Market Analysis 2020 to 2024 and Forecast 2025 to 2035, By Country
    • Historical Market Size Value (USD Million) Trend Analysis By Market Taxonomy, 2020 to 2024
    • Market Size Value (USD Million) Forecast By Market Taxonomy, 2025 to 2035
      • By Country
        • USA
        • Canada
        • Mexico
      • By Product
      • By Nature
      • By Application
      • By End User
    • Market Attractiveness Analysis
      • By Country
      • By Product
      • By Nature
      • By Application
      • By End User
    • Key Takeaways
  12. Latin America Market Analysis 2020 to 2024 and Forecast 2025 to 2035, By Country
    • Historical Market Size Value (USD Million) Trend Analysis By Market Taxonomy, 2020 to 2024
    • Market Size Value (USD Million) Forecast By Market Taxonomy, 2025 to 2035
      • By Country
        • Brazil
        • Chile
        • Rest of Latin America
      • By Product
      • By Nature
      • By Application
      • By End User
    • Market Attractiveness Analysis
      • By Country
      • By Product
      • By Nature
      • By Application
      • By End User
    • Key Takeaways
  13. Western Europe Market Analysis 2020 to 2024 and Forecast 2025 to 2035, By Country
    • Historical Market Size Value (USD Million) Trend Analysis By Market Taxonomy, 2020 to 2024
    • Market Size Value (USD Million) Forecast By Market Taxonomy, 2025 to 2035
      • By Country
        • Germany
        • UK
        • Italy
        • Spain
        • France
        • Nordic
        • BENELUX
        • Rest of Western Europe
      • By Product
      • By Nature
      • By Application
      • By End User
    • Market Attractiveness Analysis
      • By Country
      • By Product
      • By Nature
      • By Application
      • By End User
    • Key Takeaways
  14. Eastern Europe Market Analysis 2020 to 2024 and Forecast 2025 to 2035, By Country
    • Historical Market Size Value (USD Million) Trend Analysis By Market Taxonomy, 2020 to 2024
    • Market Size Value (USD Million) Forecast By Market Taxonomy, 2025 to 2035
      • By Country
        • Russia
        • Poland
        • Hungary
        • Balkan & Baltic
        • Rest of Eastern Europe
      • By Product
      • By Nature
      • By Application
      • By End User
    • Market Attractiveness Analysis
      • By Country
      • By Product
      • By Nature
      • By Application
      • By End User
    • Key Takeaways
  15. East Asia Market Analysis 2020 to 2024 and Forecast 2025 to 2035, By Country
    • Historical Market Size Value (USD Million) Trend Analysis By Market Taxonomy, 2020 to 2024
    • Market Size Value (USD Million) Forecast By Market Taxonomy, 2025 to 2035
      • By Country
        • China
        • Japan
        • South Korea
      • By Product
      • By Nature
      • By Application
      • By End User
    • Market Attractiveness Analysis
      • By Country
      • By Product
      • By Nature
      • By Application
      • By End User
    • Key Takeaways
  16. South Asia and Pacific Market Analysis 2020 to 2024 and Forecast 2025 to 2035, By Country
    • Historical Market Size Value (USD Million) Trend Analysis By Market Taxonomy, 2020 to 2024
    • Market Size Value (USD Million) Forecast By Market Taxonomy, 2025 to 2035
      • By Country
        • India
        • ASEAN
        • Australia & New Zealand
        • Rest of South Asia and Pacific
      • By Product
      • By Nature
      • By Application
      • By End User
    • Market Attractiveness Analysis
      • By Country
      • By Product
      • By Nature
      • By Application
      • By End User
    • Key Takeaways
  17. Middle East & Africa Market Analysis 2020 to 2024 and Forecast 2025 to 2035, By Country
    • Historical Market Size Value (USD Million) Trend Analysis By Market Taxonomy, 2020 to 2024
    • Market Size Value (USD Million) Forecast By Market Taxonomy, 2025 to 2035
      • By Country
        • Kingdom of Saudi Arabia
        • Other GCC Countries
        • Turkiye
        • South Africa
        • Other African Union
        • Rest of Middle East & Africa
      • By Product
      • By Nature
      • By Application
      • By End User
    • Market Attractiveness Analysis
      • By Country
      • By Product
      • By Nature
      • By Application
      • By End User
    • Key Takeaways
  18. Key Countries Market Analysis
    • USA
      • Pricing Analysis
      • Market Share Analysis, 2024
        • By Product
        • By Nature
        • By Application
        • By End User
    • Canada
      • Pricing Analysis
      • Market Share Analysis, 2024
        • By Product
        • By Nature
        • By Application
        • By End User
    • Mexico
      • Pricing Analysis
      • Market Share Analysis, 2024
        • By Product
        • By Nature
        • By Application
        • By End User
    • Brazil
      • Pricing Analysis
      • Market Share Analysis, 2024
        • By Product
        • By Nature
        • By Application
        • By End User
    • Chile
      • Pricing Analysis
      • Market Share Analysis, 2024
        • By Product
        • By Nature
        • By Application
        • By End User
    • Germany
      • Pricing Analysis
      • Market Share Analysis, 2024
        • By Product
        • By Nature
        • By Application
        • By End User
    • UK
      • Pricing Analysis
      • Market Share Analysis, 2024
        • By Product
        • By Nature
        • By Application
        • By End User
    • Italy
      • Pricing Analysis
      • Market Share Analysis, 2024
        • By Product
        • By Nature
        • By Application
        • By End User
    • Spain
      • Pricing Analysis
      • Market Share Analysis, 2024
        • By Product
        • By Nature
        • By Application
        • By End User
    • France
      • Pricing Analysis
      • Market Share Analysis, 2024
        • By Product
        • By Nature
        • By Application
        • By End User
    • India
      • Pricing Analysis
      • Market Share Analysis, 2024
        • By Product
        • By Nature
        • By Application
        • By End User
    • ASEAN
      • Pricing Analysis
      • Market Share Analysis, 2024
        • By Product
        • By Nature
        • By Application
        • By End User
    • Australia & New Zealand
      • Pricing Analysis
      • Market Share Analysis, 2024
        • By Product
        • By Nature
        • By Application
        • By End User
    • China
      • Pricing Analysis
      • Market Share Analysis, 2024
        • By Product
        • By Nature
        • By Application
        • By End User
    • Japan
      • Pricing Analysis
      • Market Share Analysis, 2024
        • By Product
        • By Nature
        • By Application
        • By End User
    • South Korea
      • Pricing Analysis
      • Market Share Analysis, 2024
        • By Product
        • By Nature
        • By Application
        • By End User
    • Russia
      • Pricing Analysis
      • Market Share Analysis, 2024
        • By Product
        • By Nature
        • By Application
        • By End User
    • Poland
      • Pricing Analysis
      • Market Share Analysis, 2024
        • By Product
        • By Nature
        • By Application
        • By End User
    • Hungary
      • Pricing Analysis
      • Market Share Analysis, 2024
        • By Product
        • By Nature
        • By Application
        • By End User
    • Kingdom of Saudi Arabia
      • Pricing Analysis
      • Market Share Analysis, 2024
        • By Product
        • By Nature
        • By Application
        • By End User
    • Turkiye
      • Pricing Analysis
      • Market Share Analysis, 2024
        • By Product
        • By Nature
        • By Application
        • By End User
    • South Africa
      • Pricing Analysis
      • Market Share Analysis, 2024
        • By Product
        • By Nature
        • By Application
        • By End User
  19. Market Structure Analysis
    • Competition Dashboard
    • Competition Benchmarking
    • Market Share Analysis of Top Players
      • By Regional
      • By Product
      • By Nature
      • By Application
      • By End User
  20. Competition Analysis
    • Competition Deep Dive
      • SERAG-WIESSNER GmbH & Co. KG
        • Overview
        • Product Portfolio
        • Profitability by Market Segments (Product/Age /Sales Channel/Region)
        • Sales Footprint
        • Strategy Overview
          • Marketing Strategy
          • Product Strategy
          • Channel Strategy
      • Novus Scientific
      • pfm medical
      • Allergan Aesthetics
      • Cook Biotech
      • MedSkin Solutions Dr. Suwelack AG
      • Tutogen Medical GmbH
      • Becton, Dickinson and Company
      • RTI Surgical
      • Stryker Corporation
      • PolyNovo
      • MTF Biologics
      • Tissue Regenix
      • Aziyo Biologics
      • Advanced Biomedical Concept Srl
      • Biomedica
  21. Assumptions & Acronyms Used
  22. Research Methodology

List of Tables

  • Table 1: Global Market Value (USD Million) Forecast by Region, 2020 to 2035
  • Table 2: Global Market Value (USD Million) Forecast by Product , 2020 to 2035
  • Table 3: Global Market Value (USD Million) Forecast by Nature, 2020 to 2035
  • Table 4: Global Market Value (USD Million) Forecast by Application, 2020 to 2035
  • Table 5: Global Market Value (USD Million) Forecast by End User, 2020 to 2035
  • Table 6: North America Market Value (USD Million) Forecast by Country, 2020 to 2035
  • Table 7: North America Market Value (USD Million) Forecast by Product , 2020 to 2035
  • Table 8: North America Market Value (USD Million) Forecast by Nature, 2020 to 2035
  • Table 9: North America Market Value (USD Million) Forecast by Application, 2020 to 2035
  • Table 10: North America Market Value (USD Million) Forecast by End User, 2020 to 2035
  • Table 11: Latin America Market Value (USD Million) Forecast by Country, 2020 to 2035
  • Table 12: Latin America Market Value (USD Million) Forecast by Product , 2020 to 2035
  • Table 13: Latin America Market Value (USD Million) Forecast by Nature, 2020 to 2035
  • Table 14: Latin America Market Value (USD Million) Forecast by Application, 2020 to 2035
  • Table 15: Latin America Market Value (USD Million) Forecast by End User, 2020 to 2035
  • Table 16: Western Europe Market Value (USD Million) Forecast by Country, 2020 to 2035
  • Table 17: Western Europe Market Value (USD Million) Forecast by Product , 2020 to 2035
  • Table 18: Western Europe Market Value (USD Million) Forecast by Nature, 2020 to 2035
  • Table 19: Western Europe Market Value (USD Million) Forecast by Application, 2020 to 2035
  • Table 20: Western Europe Market Value (USD Million) Forecast by End User, 2020 to 2035
  • Table 21: Eastern Europe Market Value (USD Million) Forecast by Country, 2020 to 2035
  • Table 22: Eastern Europe Market Value (USD Million) Forecast by Product , 2020 to 2035
  • Table 23: Eastern Europe Market Value (USD Million) Forecast by Nature, 2020 to 2035
  • Table 24: Eastern Europe Market Value (USD Million) Forecast by Application, 2020 to 2035
  • Table 25: Eastern Europe Market Value (USD Million) Forecast by End User, 2020 to 2035
  • Table 26: East Asia Market Value (USD Million) Forecast by Country, 2020 to 2035
  • Table 27: East Asia Market Value (USD Million) Forecast by Product , 2020 to 2035
  • Table 28: East Asia Market Value (USD Million) Forecast by Nature, 2020 to 2035
  • Table 29: East Asia Market Value (USD Million) Forecast by Application, 2020 to 2035
  • Table 30: East Asia Market Value (USD Million) Forecast by End User, 2020 to 2035
  • Table 31: South Asia and Pacific Market Value (USD Million) Forecast by Country, 2020 to 2035
  • Table 32: South Asia and Pacific Market Value (USD Million) Forecast by Product , 2020 to 2035
  • Table 33: South Asia and Pacific Market Value (USD Million) Forecast by Nature, 2020 to 2035
  • Table 34: South Asia and Pacific Market Value (USD Million) Forecast by Application, 2020 to 2035
  • Table 35: South Asia and Pacific Market Value (USD Million) Forecast by End User, 2020 to 2035
  • Table 36: Middle East & Africa Market Value (USD Million) Forecast by Country, 2020 to 2035
  • Table 37: Middle East & Africa Market Value (USD Million) Forecast by Product , 2020 to 2035
  • Table 38: Middle East & Africa Market Value (USD Million) Forecast by Nature, 2020 to 2035
  • Table 39: Middle East & Africa Market Value (USD Million) Forecast by Application, 2020 to 2035
  • Table 40: Middle East & Africa Market Value (USD Million) Forecast by End User, 2020 to 2035

List of Figures

  • Figure 1: Global Market Pricing Analysis
  • Figure 2: Global Market Value (USD Million) Forecast 2020-2035
  • Figure 3: Global Market Value Share and BPS Analysis by Product , 2025 and 2035
  • Figure 4: Global Market Y to o to Y Growth Comparison by Product , 2025-2035
  • Figure 5: Global Market Attractiveness Analysis by Product
  • Figure 6: Global Market Value Share and BPS Analysis by Nature, 2025 and 2035
  • Figure 7: Global Market Y to o to Y Growth Comparison by Nature, 2025-2035
  • Figure 8: Global Market Attractiveness Analysis by Nature
  • Figure 9: Global Market Value Share and BPS Analysis by Application, 2025 and 2035
  • Figure 10: Global Market Y to o to Y Growth Comparison by Application, 2025-2035
  • Figure 11: Global Market Attractiveness Analysis by Application
  • Figure 12: Global Market Value Share and BPS Analysis by End User, 2025 and 2035
  • Figure 13: Global Market Y to o to Y Growth Comparison by End User, 2025-2035
  • Figure 14: Global Market Attractiveness Analysis by End User
  • Figure 15: Global Market Value (USD Million) Share and BPS Analysis by Region, 2025 and 2035
  • Figure 16: Global Market Y to o to Y Growth Comparison by Region, 2025-2035
  • Figure 17: Global Market Attractiveness Analysis by Region
  • Figure 18: North America Market Incremental Dollar Opportunity, 2025-2035
  • Figure 19: Latin America Market Incremental Dollar Opportunity, 2025-2035
  • Figure 20: Western Europe Market Incremental Dollar Opportunity, 2025-2035
  • Figure 21: Eastern Europe Market Incremental Dollar Opportunity, 2025-2035
  • Figure 22: East Asia Market Incremental Dollar Opportunity, 2025-2035
  • Figure 23: South Asia and Pacific Market Incremental Dollar Opportunity, 2025-2035
  • Figure 24: Middle East & Africa Market Incremental Dollar Opportunity, 2025-2035
  • Figure 25: North America Market Value Share and BPS Analysis by Country, 2025 and 2035
  • Figure 26: North America Market Value Share and BPS Analysis by Product , 2025 and 2035
  • Figure 27: North America Market Y to o to Y Growth Comparison by Product , 2025-2035
  • Figure 28: North America Market Attractiveness Analysis by Product
  • Figure 29: North America Market Value Share and BPS Analysis by Nature, 2025 and 2035
  • Figure 30: North America Market Y to o to Y Growth Comparison by Nature, 2025-2035
  • Figure 31: North America Market Attractiveness Analysis by Nature
  • Figure 32: North America Market Value Share and BPS Analysis by Application, 2025 and 2035
  • Figure 33: North America Market Y to o to Y Growth Comparison by Application, 2025-2035
  • Figure 34: North America Market Attractiveness Analysis by Application
  • Figure 35: North America Market Value Share and BPS Analysis by End User, 2025 and 2035
  • Figure 36: North America Market Y to o to Y Growth Comparison by End User, 2025-2035
  • Figure 37: North America Market Attractiveness Analysis by End User
  • Figure 38: Latin America Market Value Share and BPS Analysis by Country, 2025 and 2035
  • Figure 39: Latin America Market Value Share and BPS Analysis by Product , 2025 and 2035
  • Figure 40: Latin America Market Y to o to Y Growth Comparison by Product , 2025-2035
  • Figure 41: Latin America Market Attractiveness Analysis by Product
  • Figure 42: Latin America Market Value Share and BPS Analysis by Nature, 2025 and 2035
  • Figure 43: Latin America Market Y to o to Y Growth Comparison by Nature, 2025-2035
  • Figure 44: Latin America Market Attractiveness Analysis by Nature
  • Figure 45: Latin America Market Value Share and BPS Analysis by Application, 2025 and 2035
  • Figure 46: Latin America Market Y to o to Y Growth Comparison by Application, 2025-2035
  • Figure 47: Latin America Market Attractiveness Analysis by Application
  • Figure 48: Latin America Market Value Share and BPS Analysis by End User, 2025 and 2035
  • Figure 49: Latin America Market Y to o to Y Growth Comparison by End User, 2025-2035
  • Figure 50: Latin America Market Attractiveness Analysis by End User
  • Figure 51: Western Europe Market Value Share and BPS Analysis by Country, 2025 and 2035
  • Figure 52: Western Europe Market Value Share and BPS Analysis by Product , 2025 and 2035
  • Figure 53: Western Europe Market Y to o to Y Growth Comparison by Product , 2025-2035
  • Figure 54: Western Europe Market Attractiveness Analysis by Product
  • Figure 55: Western Europe Market Value Share and BPS Analysis by Nature, 2025 and 2035
  • Figure 56: Western Europe Market Y to o to Y Growth Comparison by Nature, 2025-2035
  • Figure 57: Western Europe Market Attractiveness Analysis by Nature
  • Figure 58: Western Europe Market Value Share and BPS Analysis by Application, 2025 and 2035
  • Figure 59: Western Europe Market Y to o to Y Growth Comparison by Application, 2025-2035
  • Figure 60: Western Europe Market Attractiveness Analysis by Application
  • Figure 61: Western Europe Market Value Share and BPS Analysis by End User, 2025 and 2035
  • Figure 62: Western Europe Market Y to o to Y Growth Comparison by End User, 2025-2035
  • Figure 63: Western Europe Market Attractiveness Analysis by End User
  • Figure 64: Eastern Europe Market Value Share and BPS Analysis by Country, 2025 and 2035
  • Figure 65: Eastern Europe Market Value Share and BPS Analysis by Product , 2025 and 2035
  • Figure 66: Eastern Europe Market Y to o to Y Growth Comparison by Product , 2025-2035
  • Figure 67: Eastern Europe Market Attractiveness Analysis by Product
  • Figure 68: Eastern Europe Market Value Share and BPS Analysis by Nature, 2025 and 2035
  • Figure 69: Eastern Europe Market Y to o to Y Growth Comparison by Nature, 2025-2035
  • Figure 70: Eastern Europe Market Attractiveness Analysis by Nature
  • Figure 71: Eastern Europe Market Value Share and BPS Analysis by Application, 2025 and 2035
  • Figure 72: Eastern Europe Market Y to o to Y Growth Comparison by Application, 2025-2035
  • Figure 73: Eastern Europe Market Attractiveness Analysis by Application
  • Figure 74: Eastern Europe Market Value Share and BPS Analysis by End User, 2025 and 2035
  • Figure 75: Eastern Europe Market Y to o to Y Growth Comparison by End User, 2025-2035
  • Figure 76: Eastern Europe Market Attractiveness Analysis by End User
  • Figure 77: East Asia Market Value Share and BPS Analysis by Country, 2025 and 2035
  • Figure 78: East Asia Market Value Share and BPS Analysis by Product , 2025 and 2035
  • Figure 79: East Asia Market Y to o to Y Growth Comparison by Product , 2025-2035
  • Figure 80: East Asia Market Attractiveness Analysis by Product
  • Figure 81: East Asia Market Value Share and BPS Analysis by Nature, 2025 and 2035
  • Figure 82: East Asia Market Y to o to Y Growth Comparison by Nature, 2025-2035
  • Figure 83: East Asia Market Attractiveness Analysis by Nature
  • Figure 84: East Asia Market Value Share and BPS Analysis by Application, 2025 and 2035
  • Figure 85: East Asia Market Y to o to Y Growth Comparison by Application, 2025-2035
  • Figure 86: East Asia Market Attractiveness Analysis by Application
  • Figure 87: East Asia Market Value Share and BPS Analysis by End User, 2025 and 2035
  • Figure 88: East Asia Market Y to o to Y Growth Comparison by End User, 2025-2035
  • Figure 89: East Asia Market Attractiveness Analysis by End User
  • Figure 90: South Asia and Pacific Market Value Share and BPS Analysis by Country, 2025 and 2035
  • Figure 91: South Asia and Pacific Market Value Share and BPS Analysis by Product , 2025 and 2035
  • Figure 92: South Asia and Pacific Market Y to o to Y Growth Comparison by Product , 2025-2035
  • Figure 93: South Asia and Pacific Market Attractiveness Analysis by Product
  • Figure 94: South Asia and Pacific Market Value Share and BPS Analysis by Nature, 2025 and 2035
  • Figure 95: South Asia and Pacific Market Y to o to Y Growth Comparison by Nature, 2025-2035
  • Figure 96: South Asia and Pacific Market Attractiveness Analysis by Nature
  • Figure 97: South Asia and Pacific Market Value Share and BPS Analysis by Application, 2025 and 2035
  • Figure 98: South Asia and Pacific Market Y to o to Y Growth Comparison by Application, 2025-2035
  • Figure 99: South Asia and Pacific Market Attractiveness Analysis by Application
  • Figure 100: South Asia and Pacific Market Value Share and BPS Analysis by End User, 2025 and 2035
  • Figure 101: South Asia and Pacific Market Y to o to Y Growth Comparison by End User, 2025-2035
  • Figure 102: South Asia and Pacific Market Attractiveness Analysis by End User
  • Figure 103: Middle East & Africa Market Value Share and BPS Analysis by Country, 2025 and 2035
  • Figure 104: Middle East & Africa Market Value Share and BPS Analysis by Product , 2025 and 2035
  • Figure 105: Middle East & Africa Market Y to o to Y Growth Comparison by Product , 2025-2035
  • Figure 106: Middle East & Africa Market Attractiveness Analysis by Product
  • Figure 107: Middle East & Africa Market Value Share and BPS Analysis by Nature, 2025 and 2035
  • Figure 108: Middle East & Africa Market Y to o to Y Growth Comparison by Nature, 2025-2035
  • Figure 109: Middle East & Africa Market Attractiveness Analysis by Nature
  • Figure 110: Middle East & Africa Market Value Share and BPS Analysis by Application, 2025 and 2035
  • Figure 111: Middle East & Africa Market Y to o to Y Growth Comparison by Application, 2025-2035
  • Figure 112: Middle East & Africa Market Attractiveness Analysis by Application
  • Figure 113: Middle East & Africa Market Value Share and BPS Analysis by End User, 2025 and 2035
  • Figure 114: Middle East & Africa Market Y to o to Y Growth Comparison by End User, 2025-2035
  • Figure 115: Middle East & Africa Market Attractiveness Analysis by End User
  • Figure 116: Global Market - Tier Structure Analysis
  • Figure 117: Global Market - Company Share Analysis
Dashboard
Dashboard
Dashboard
Dashboard
Dashboard
Dashboard

Full Research Suite comprises of:

Market outlook & trends analysis

Market outlook & trends analysis

Interviews & case studies

Interviews & case studies

Strategic recommendations

Strategic recommendations

Vendor profiles & capabilities analysis

Vendor profiles & capabilities analysis

5-year forecasts

5-year forecasts

8 regions and 60+ country-level data splits

8 regions and 60+ country-level data splits

Market segment data splits

Market segment data splits

12 months of continuous data updates

12 months of continuous data updates

DELIVERED AS:

PDF EXCEL ONLINE

Full Research Suite


$5000

$7500

$10000

Buy Report Now
Similar Industry Reports

Similar Industry Reports

Breast MRI Screening Market

Breast MRI Screening Market Size and Share Forecast Outlook 2025 to 2035

Breast Density Assessment Software Market

Breast Density Assessment Software Market Size and Share Forecast Outlook 2025 to 2035

Breast Cancer Grading Tools Market

Breast Cancer Grading Tools Market Size and Share Forecast Outlook 2025 to 2035

Breast Cancer Screening Tests Market

Breast Cancer Screening Tests Market Size and Share Forecast Outlook 2025 to 2035

Breast Cancer Diagnostics Market

Breast Cancer Diagnostics Market Size and Share Forecast Outlook 2025 to 2035

Breast Biopsy Market

Breast Biopsy Market Size and Share Forecast Outlook 2025 to 2035

Breast Lesion Localization Device Market

Breast Lesion Localization Device Market Analysis - Size, Share, and Forecast Outlook 2025 to 2035

Breast Lesion Localization Market

Breast Lesion Localization Market Size and Share Forecast Outlook 2025 to 2035

Breastfeeding Accessories Market

Breastfeeding Accessories Market Size and Share Forecast Outlook 2025 to 2035

Breast Biopsy Devices Market

Breast Biopsy Devices Market Analysis - Innovations & Forecast 2025 to 2035

Breast Pump Market
Breast Pump Market

Breast Pump Market – Trends & Forecast 2025 to 2035

Breast Fillers Market

Breast Fillers Market Analysis - Trends & Forecast 2025 to 2035

Breast Cancer Drug Market

The Breast Cancer Drug Market is segmented by Drug Class, and Distribution Channel from 2025 to 2035

Breast Implants Market Share Analysis

Industry Share & Competitive Positioning in Breast Implants Market

Breast Imaging Market

Breast Imaging Market Analysis - Size, Share & Growth Forecast 2024 to 2034

Breast Localization System Market

Breast Localization System Market

Breast Reconstruction Surgery Market

Breast Reconstruction Surgery Market Analysis - Size, Share, and Forecast 2025 to 2035

Breast Reconstruction Surgery Market Share Analysis

Industry Share & Competitive Positioning in Breast Reconstruction Surgery Market

Smart Breast Imaging Market

Smart Breast Imaging Market Analysis - Size, Share, and Forecast Outlook 2025 to 2035

Europe Breast and Prostate Cancer Diagnostics Market

Breast & Prostate Cancer Diagnostics Market in Europe – Trends & Forecast 2025 to 2035

Future Market Insights

Breast Reconstruction Meshes Market

Chat With MaRIA

Chat With

MaRIA

Hi There, I am MaRIA, Your Market Research Intelligence Assistant. How may I help you?