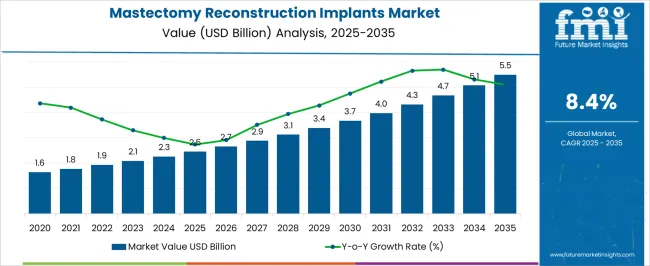
The Mastectomy Reconstruction Implants Market is estimated to be valued at USD 2.5 billion in 2025 and is projected to reach USD 5.5 billion by 2035, registering a compound annual growth rate (CAGR) of 8.4% over the forecast period.
| Metric | Value |
|---|---|
| Mastectomy Reconstruction Implants Market Estimated Value in (2025 E) | USD 2.5 billion |
| Mastectomy Reconstruction Implants Market Forecast Value in (2035 F) | USD 5.5 billion |
| Forecast CAGR (2025 to 2035) | 8.4% |
The mastectomy reconstruction implants market is expanding as rising awareness of breast reconstruction options and advancements in implant technology continue to influence adoption trends. Increasing prevalence of breast cancer, coupled with growing preference for post mastectomy aesthetic restoration, is driving demand.
Improvements in implant design, safety, and integration with acellular dermal matrices are enhancing clinical outcomes and patient satisfaction. Supportive healthcare policies, insurance coverage, and multidisciplinary care approaches are further strengthening market growth.
Additionally, expanding reconstructive surgery expertise across hospitals and specialty centers is creating new opportunities for both patients and manufacturers. The outlook remains favorable as innovation in biomaterials, minimally invasive surgical procedures, and rising acceptance of reconstructive options pave the way for sustainable market growth.
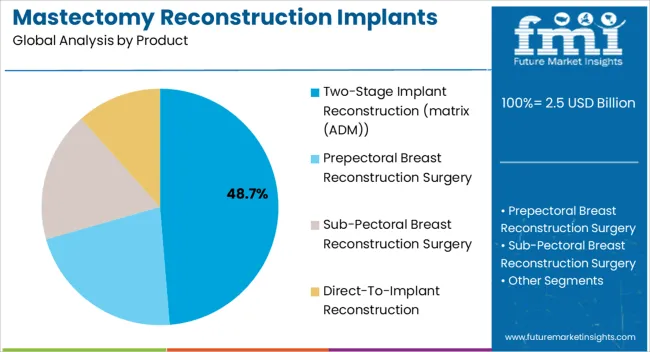
The two stage implant reconstruction with matrix ADM segment is expected to hold 48.70% of total market revenue by 2025, positioning it as the leading product category. Its dominance is supported by the clinical advantage of staged procedures which allow gradual expansion of tissue and improved aesthetic outcomes.
The use of acellular dermal matrices provides structural support, enhances implant coverage, and reduces complication risks, thereby increasing surgeon preference. Patients benefit from more predictable cosmetic results and reduced revision rates.
As healthcare providers prioritize safety, flexibility, and patient satisfaction, this product segment continues to strengthen its share within the overall market.
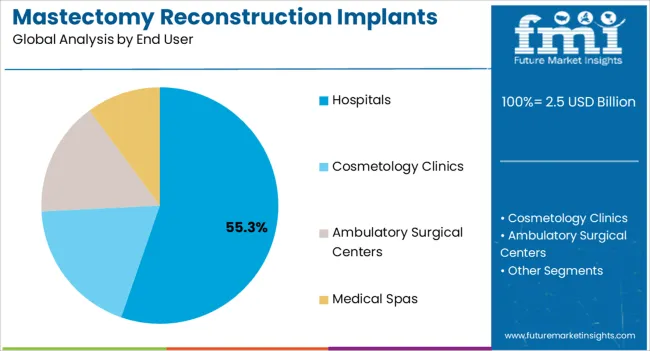
The hospitals segment is projected to account for 55.30% of the market revenue by 2025, establishing it as the dominant end user category. This growth is driven by the availability of advanced surgical infrastructure, skilled reconstructive surgeons, and comprehensive postoperative care services.
Hospitals remain the primary treatment centers for mastectomy patients, with multidisciplinary teams ensuring coordinated care from oncology to reconstructive surgery. Higher patient inflows, access to insurance coverage, and the ability to manage complex reconstructive procedures further reinforce hospital leadership in this market.
As hospitals continue to expand specialized oncology and reconstructive units, their role as the principal end user segment will remain strong.
Sales of the mastectomy reconstruction implants market grew at a CAGR of 6.6% between 2020 and 2025. Mastectomy reconstruction implants market contributes 49.0% revenue share to the global breast reconstruction surgery and treatment market which is valued around USD 2.5 Billion in 2025.
There is a growing demand for breast reconstruction surgeries, and as a result, the demand for mastectomy reconstruction implants is also increasing. This is due to several factors, including rising awareness, improved surgical techniques, and the increasing incidence of breast cancer.
Many healthcare organizations are promoting breast reconstruction surgery and treatment as part of breast cancer care.
There are several manufacturers in the mastectomy reconstruction implants market, and competition is high. As a result, manufacturers are focusing on developing innovative products, improving their distribution networks, and providing excellent customer service to maintain or gain market share. Manufacturers are collaborating with healthcare professionals, research institutions, and other industry players to develop new products and improve existing ones. These collaborations can help manufacturers to stay at the forefront of the market and meet the changing needs of customers.
Considering this, FMI expects the global mastectomy reconstruction implants market to grow at a CAGR of 8.4% through the forecasted years.
Small-sized breast implants are becoming popular among women who desire natural-looking results from their breast reconstruction surgery. These implants can provide a subtle enhancement of breast size and shape without appearing overly artificial. This is driven by the growing awareness of the importance of natural-looking results in the market.
There has been a significant increase in the availability of small-sized breast implants in recent years. This is due to the development of new technologies and materials, as well as advances in surgical techniques. Small-sized breast implants are often used in minimally invasive breast reconstruction procedures, which are becoming increasingly popular.
The trend toward personalized medicine is also reflected in breast reconstruction surgeries. Surgeons are now better able to tailor the procedure to the individual needs of each patient, taking into account factors such as their body shape, breast size, and desired outcome. In many countries, insurance coverage for breast reconstruction surgeries is mandated by law. This has made breast reconstruction more accessible to women who may not have been able to afford the procedure otherwise.
Breast implants are not lifelong, and breast implant surgery carries the risk of complications that may eventually lead to the removal of the breast implants. Commonly observed complications include narrowing of the area around the implant (capsular contracture), additional surgery, and removal of the implant.
The increased risk of serious complications is a significant restraint to the growth of the breast reconstruction surgery and treatment market. Complications such as infection, bleeding, implant rupture or leaks, capsular contracture, and implant malposition can lead to additional surgeries, longer recovery times, and even permanent damage.
In addition to the risk of complications, the cost of breast reconstruction can also be a barrier in the market. The increased risk of serious complications is a significant barrier to the growth of the market. Women considering breast reconstruction surgery should carefully consider the potential risks and benefits and seek advice from a qualified healthcare provider. While mastectomy reconstruction implants are a popular option for breast reconstruction, some patients may opt for other treatments, such as autologous tissue reconstruction, which involves using tissue from the patient's own body to reconstruct the breast.
These factors are expected to hamper the revenue growth of the market over the forecast period.
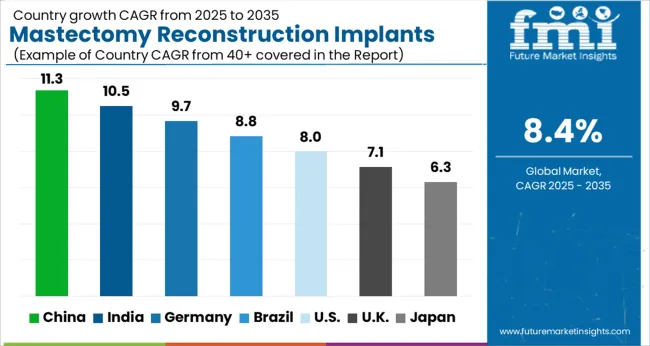
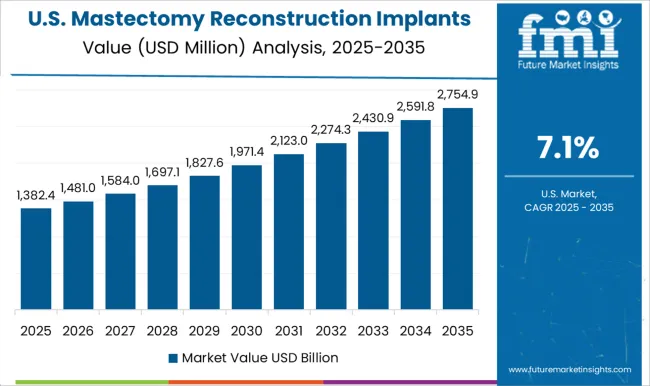
The USA dominated the global market in 2025 with a 94.5% value share in the North American market.
Favorable reimbursement policies are one of the key factors that make the USA the dominating country in the market. The Centers for Medicare & Medicaid Services (CMS) in the USA has established reimbursement policies that make breast reconstruction surgery and the use of mastectomy reconstruction implants more accessible and affordable for patients. Medicare, the federal health insurance program for people over 65 and those with certain disabilities covers breast reconstruction surgery and the use of mastectomy reconstruction implants following a mastectomy for breast cancer. Private insurance plans are also required to provide coverage for breast reconstruction surgery under the Women's Health and Cancer Rights Act of 1998.
Favorable reimbursement policies help to ensure that patients have access to mastectomy reconstruction implants and that healthcare providers can provide these services without financial barriers. This has helped to increase the adoption rate of breast reconstruction surgery and the use of mastectomy reconstruction implants in the USA
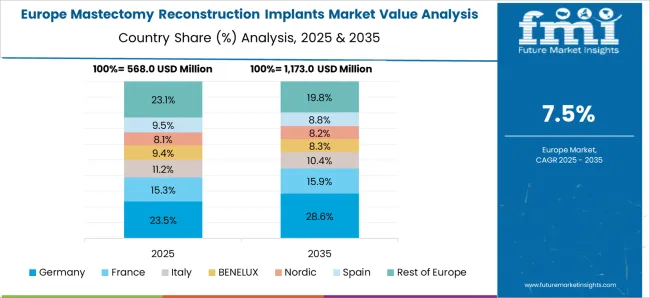
Germany dominated the Western European market for mastectomy reconstruction implants and accounted for around 26.7% of the market share in 2025.
Breast reconstruction surgery has become more common in Germany due to increased awareness and education about the procedure, as well as advancements in surgical techniques and technology.
Germany also has a strong healthcare system with highly trained medical professionals, making it an attractive destination for medical tourism. Many women from other countries travel to Germany for breast reconstruction surgery, further driving demand for mastectomy reconstruction implants in the country.
Brazil held nearly 49.5% of the Latin America market for mastectomy reconstruction implants.
The market in Brazil is expected to grow significantly in the coming years due to several factors. Brazil has a large population of over 211 million people, and breast cancer is the leading cancer among women in the country.
The direct-to-implant reconstruction segment held the major chunk of about 55.0% of the global market in 2025.
The implant is placed immediately after the mastectomy, the overall breast shape can be more easily controlled and optimized. Direct-to-Implant (DTI) reconstruction allows for the immediate placement of the implant, which means the overall breast shape can be more easily controlled and optimized. The surgeon can better adjust the size, shape, and position of the implant during surgery, resulting in a more natural-looking breast. Patients can see the results immediately after surgery, which can help alleviate anxiety and improve their overall satisfaction with the procedure.
The hospitals segment accounted for a revenue share of 42.2% in the global market in 2025.
Mastectomy reconstruction implant surgery is a complex procedure that requires specialized equipment, facilities, and skilled healthcare professionals. Hospitals are well-equipped to handle such surgeries and have dedicated units and teams that specialize in breast reconstruction procedures. Hospitals are the preferred choice for patients undergoing breast reconstruction surgery due to the perceived safety and quality of care provided. Patients often prefer to undergo surgery in a hospital setting where they can receive specialized care and access to advanced medical technology.
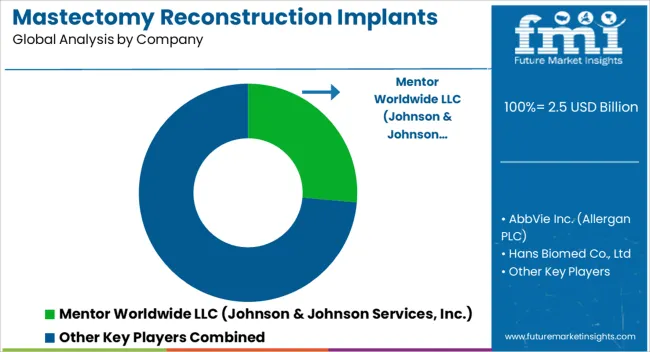
Key players in the market are focused on increase their product portfolio to strengthen their position in the market, and also to expand their footprint in emerging markets. The key strategy adopted by manufacturers to gain competitive edge in the market are the pricing strategies, market strategies, technological advancements, regulatory compliance and approvals of the products to expand their business.
For instance:
Similarly, recent developments have been tracked by the team at Future Market Insights related to companies in the mastectomy reconstruction implants market space, which are available in the full report
| Attribute | Details |
|---|---|
| Forecast Period | 2025 to 2035 |
| Historical Data Available for | 2020 to 2025 |
| Market Analysis | USD Million for Value |
| Key Regions Covered | North America; Latin America; East Asia; South Asia & Pacific; Western Europe; Eastern Europe; Central Asia; Russia & Belarus; Balkan & Baltic Countries; Middle East and Africa (MEA) |
| Key Countries Covered | USA, Canada, Brazil, Mexico, Argentina, China, Japan, South Korea, India, Indonesia, Thailand, Philippines, Malaysia, Vietnam, Australia & New Zealand, Germany, France, Spain Italy, BENELUX, Nordic Countries, UK, Poland, Hungary, Romania, Czech Republic, Central Asia, Russia & Belarus, Balkan & Baltic Countries, GCC Countries, Kingdom of Saudi Arabia, Türkiye, Northern Africa, South Africa, Israel |
| Key Segments Covered | Product, End User, and Region |
| Key Companies Profiled | Mentor Worldwide LLC (Johnson & Johnson Services, Inc.); AbbVie Inc. (Allergan PLC); Hans Biomed Co., Ltd; Galderma SA; GC Aesthetics; POLYTECH Health & Aesthetics GmbH; Sintera Inc; PMT Corporation; Ideal Implant Inc; Groupe Sebbin SAS; Hologic, Inc; Guangzhou Wanhe Plastic Materials Co., Ltd; Establishment Labs S.A; RTI Surgical Holdings Inc.; Nagor Limited |
| Report Coverage | Market Forecast, Competition Intelligence, DROT Analysis, Market Dynamics and Challenges, Strategic Growth Initiatives |
| Customization & Pricing | Available upon Request |
The global mastectomy reconstruction implants market is estimated to be valued at USD 2.5 billion in 2025.
The market size for the mastectomy reconstruction implants market is projected to reach USD 5.5 billion by 2035.
The mastectomy reconstruction implants market is expected to grow at a 8.4% CAGR between 2025 and 2035.
The key product types in mastectomy reconstruction implants market are two-stage implant reconstruction (matrix (adm)), prepectoral breast reconstruction surgery, sub-pectoral breast reconstruction surgery and direct-to-implant reconstruction.
In terms of end user, hospitals segment to command 55.3% share in the mastectomy reconstruction implants market in 2025.


Our Research Products

The "Full Research Suite" delivers actionable market intel, deep dives on markets or technologies, so clients act faster, cut risk, and unlock growth.

The Leaderboard benchmarks and ranks top vendors, classifying them as Established Leaders, Leading Challengers, or Disruptors & Challengers.

Locates where complements amplify value and substitutes erode it, forecasting net impact by horizon

We deliver granular, decision-grade intel: market sizing, 5-year forecasts, pricing, adoption, usage, revenue, and operational KPIs—plus competitor tracking, regulation, and value chains—across 60 countries broadly.

Spot the shifts before they hit your P&L. We track inflection points, adoption curves, pricing moves, and ecosystem plays to show where demand is heading, why it is changing, and what to do next across high-growth markets and disruptive tech

Real-time reads of user behavior. We track shifting priorities, perceptions of today’s and next-gen services, and provider experience, then pace how fast tech moves from trial to adoption, blending buyer, consumer, and channel inputs with social signals (#WhySwitch, #UX).

Partner with our analyst team to build a custom report designed around your business priorities. From analysing market trends to assessing competitors or crafting bespoke datasets, we tailor insights to your needs.
Supplier Intelligence
Discovery & Profiling
Capacity & Footprint
Performance & Risk
Compliance & Governance
Commercial Readiness
Who Supplies Whom
Scorecards & Shortlists
Playbooks & Docs
Category Intelligence
Definition & Scope
Demand & Use Cases
Cost Drivers
Market Structure
Supply Chain Map
Trade & Policy
Operating Norms
Deliverables
Buyer Intelligence
Account Basics
Spend & Scope
Procurement Model
Vendor Requirements
Terms & Policies
Entry Strategy
Pain Points & Triggers
Outputs
Pricing Analysis
Benchmarks
Trends
Should-Cost
Indexation
Landed Cost
Commercial Terms
Deliverables
Brand Analysis
Positioning & Value Prop
Share & Presence
Customer Evidence
Go-to-Market
Digital & Reputation
Compliance & Trust
KPIs & Gaps
Outputs
Full Research Suite comprises of:
Market outlook & trends analysis
Interviews & case studies
Strategic recommendations
Vendor profiles & capabilities analysis
5-year forecasts
8 regions and 60+ country-level data splits
Market segment data splits
12 months of continuous data updates
DELIVERED AS:
PDF EXCEL ONLINE
3D Reconstruction Technology Market Analysis & Forecast by Component, Type, Enterprise Size, Deployment Model, Application, and Region Through 2035
Bio-Implants Market Analysis - Size, Share, and Forecast Outlook for 2025 to 2035
Gel Implants Market Analysis - Trends, Share & Forecast 2025 to 2035
Nose Reconstruction Market Growth & Demand 2025 to 2035
Knee Reconstruction Devices Market Growth – Trends & Forecast 2025 to 2035
Joint Reconstruction Devices Market Size and Share Forecast Outlook 2025 to 2035
Smart Implants Market Size and Share Forecast Outlook 2025 to 2035
Brain Implants Market Size and Share Forecast Outlook 2025 to 2035
Cheek Implants Market
Genome Reconstruction Tools Market Forecast and Outlook 2025 to 2035
Breast Reconstruction Meshes Market Size and Share Forecast Outlook 2025 to 2035
Spinal Implants and Devices Market Size and Share Forecast Outlook 2025 to 2035
Breast Reconstruction Surgery Market Analysis - Size, Share, and Forecast 2025 to 2035
Pelvic Reconstruction Market - Growth & Demand 2025 to 2035
Industry Share & Competitive Positioning in Breast Implants Market
Industry Share & Competitive Positioning in Breast Reconstruction Surgery Market
Ocular Implants Market
Facial Implants Market
Struts Implants Market
Medical Implants Precision Machining Service Market Size and Share Forecast Outlook 2025 to 2035

Thank you!
You will receive an email from our Business Development Manager. Please be sure to check your SPAM/JUNK folder too.
Chat With
MaRIA