Breast Cancer Grading Tools Market Size and Share Forecast Outlook 2025 to 2035

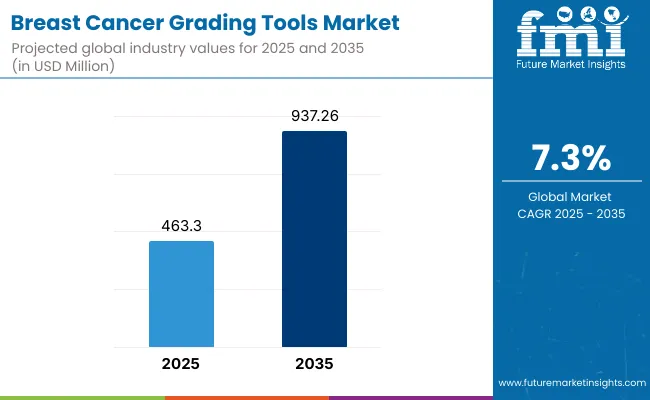
The global Breast Cancer Grading Tools Market is projected to reach a valuation of USD 463.3 million by 2025 and USD 937.26 million by 2035. This indicates a decade-long increase of USD 473.96 million between 2025 and 2035. The market is expected to expand at a compound annual growth rate (CAGR) of 7.3%, representing a 2.0X increase over the ten-year period.
Breast Cancer Grading Tools Market

Metric Value
Global Market Estimated Value (2025E) USD 463.3 million
Global Market Forecast Value (2035F) USD 937.26 million
Forecast CAGR (2025 to 2035) 7.3%

During the first five-year period from 2025 to 2030, the global Breast Cancer Grading Tools Market is projected to expand significantly, reflecting the increasing emphasis on early-stage cancer diagnosis, personalized treatment planning, and integration of molecular diagnostics.

The total market size is expected to grow from approximately USD 463.3 million in 2025 to around USD 659.0 million by 2030, adding USD 195.7 million in market value.The Nottingham Grading System will remain the dominant segment, holding approximately 65.1% share of the market by 2030, supported by its widespread clinical acceptance, standardization across pathology labs, and proven prognostic value.

In the second half of the decade from 2030 to 2035, the global Breast Cancer Grading Tools Market is projected to gain further momentum, with the market value rising from USD 659.0 million in 2030 to approximately USD 937.26 million by 2035.

This growth amounting to USD 278.26 million is fueled by the rising integration of grading tools into precision oncology workflows, expansion of digital pathology platforms, and increased adoption in both developed and emerging healthcare systems.

The demand is expected to surge across multiple end-user environments, including hospitals, diagnostic imaging centers, and cancer research institutes, as these facilities increasingly prioritize standardized grading systems and molecular diagnostics to support personalized treatment strategies and improve patient outcomes.

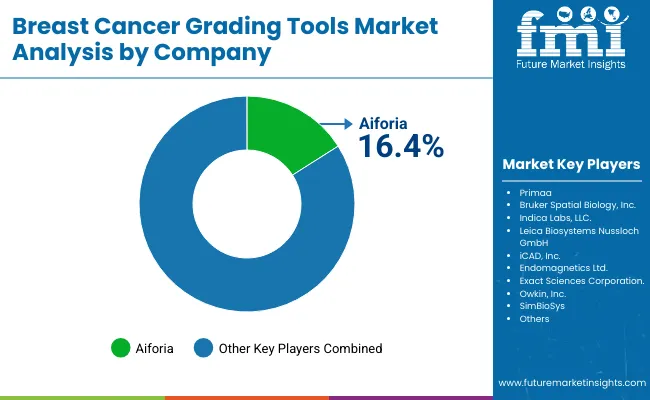
From 2020 to 2024, the global Breast Cancer Grading Tools Market grew from USD 315.6 million to USD 434.6 million. Leading companies such as Aiforia account for approximately 16.4% of the global market share, with the remaining 83.6% distributed among other players.

These market leaders gained early traction through the development of AI-powered digital pathology solutions, integration of molecular grading tools, and focused deployments in academic cancer centers, hospitals, and diagnostic laboratories across North America and Europe.

In 2025, the global Breast Cancer Grading Tools Market is projected to reach a value of approximately USD 463.3 million, driven by a growing shift towards precision oncology and the adoption of advanced histopathological and molecular grading tools. This transition reflects increasing demand for accurate tumor grading to guide personalized treatment decisions and improve patient outcomes.

Market growth will be accelerated by rising investments from healthcare systems and cancer research institutes in digital pathology platforms and AI-enabled diagnostics. Hospitals and cancer treatment centers are increasingly deploying breast cancer grading tools especially the Nottingham Grading System and molecular assays to support early detection, risk stratification, and tailored therapeutic strategies, particularly in regions with high breast cancer prevalence.

Why Is This Market Growing?

The Breast Cancer Grading Tools Market is experiencing rapid growth as healthcare systems worldwide strive to improve the accuracy of breast cancer diagnosis and support personalized treatment planning. Key drivers include the increasing prevalence of breast cancer, rising demand for standardized and precise tumor grading systems, and advances in AI-powered digital pathology platforms.

The global focus on early detection and molecular profiling is accelerating adoption, alongside growing investments in cancer diagnostic infrastructure. Stringent clinical guidelines and the shortage of skilled pathologists are prompting hospitals, diagnostic centers, and research institutes to integrate intelligent grading tools such as the Nottingham Grading System and molecular assays like Oncotype DX and MammaPrint.

Innovations including AI-assisted histopathological image analysis, automated tumor grading, and seamless integration with electronic health records (EHRs) are helping reduce variability in diagnosis, minimize human error, and enhance clinical workflow efficiency. These advancements are particularly critical in high-volume clinical settings such as hospitals and cancer centers, where precise grading directly impacts treatment decisions and patient outcomes.

Segmental Analysis

The market is segmented by tools, tumor grade,cancer type, end user, and region. Tools include Nottingham Grading System, Bloom-Richardson Grading System,andMolecular Grading Tools. Tumor Grade classification covers Grade 1, Grade 2, and Grade 3.Cancer Type includes, Invasive Ductal Carcinoma, Invasive Lobular Carcinoma, Tubular, mucinous, and others.

Based on End User, the segmentation includes Hospitals & Clinics, Diagnostic & Imaging Centers, Cancer Research Institutes & Labs, and others.Regionally, the scope spans North America, Latin America, Western and Eastern Europe, East Asia, South Asia and Pacific, and the Middle East and Africa.
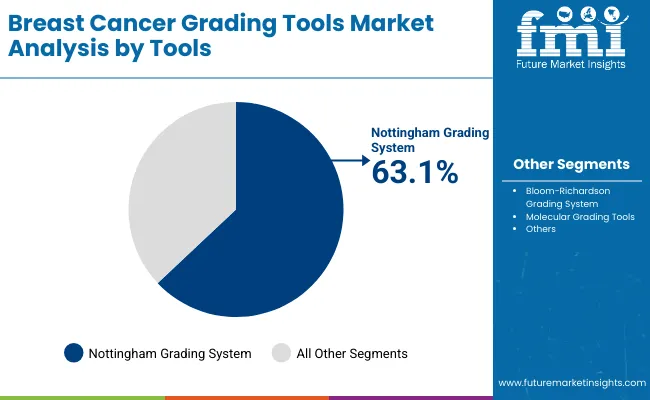
Insights into the Tools Segment with Nottingham Grading System Leading in Market Share

Breast Cancer Grading Tools Market By Tools

The Nottingham Grading System is projected to hold a dominant share of 63.1% in the global Breast Cancer Grading Tools Market in 2025, driven by its standardized methodology, ease of use in routine clinical settings, and long-standing validation across diverse patient populations.

Its widespread adoption is underpinned by the growing demand for reproducible, cost-effective grading solutions that support treatment planning and prognostic assessment. Used extensively in hospitals, cancer centers, and pathology labs, the Nottingham system provides clear classification based on tubule formation, nuclear pleomorphism, and mitotic count ensuring consistent interpretation even in high-throughput environments.

As healthcare systems increasingly prioritize early-stage diagnosis and personalized oncology, the Nottingham system remains a critical tool in frontline diagnostic workflows. Its compatibility with digital pathology platforms and emerging AI-based image analysis tools further enhances diagnostic precision while reducing inter-observer variability.

Moreover, the growing deployment of this system in emerging markets where molecular tools may be cost-prohibitive continues to reinforce its market dominance. Supportive clinical guidelines, low implementation costs, and strong integration within pathology training curricula have solidified the Nottingham Grading System’s position as the gold standard for tumor grading in both developed and developing economies.

Tools Market Share (%)
Nottingham Grading System 63.1%
Bloom-Richardson Grading System 7.2%
Molecular Grading Tools 29.7%

Insights into the Tumor Grade Segment with Grade 2 Dominating in the market.

Breast Cancer Grading Tools Market By Tumor Grade

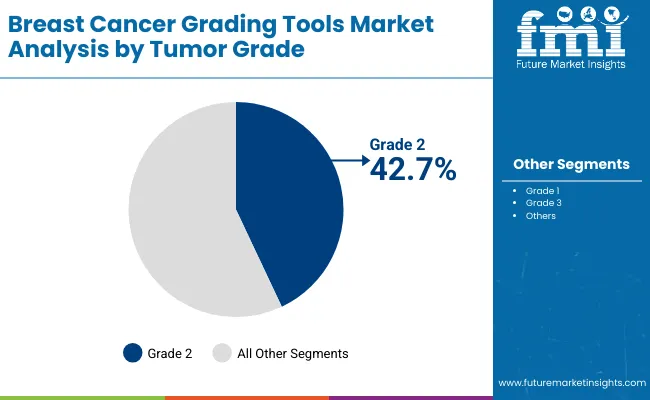
Grade 2 tumors have emerged as the leading application segment and are projected to hold approximately 42.7% of the global Breast Cancer Grading Tools Market in 2025, driven by their high clinical prevalence and critical role in guiding treatment decisions.

Grade 2 tumors are considered intermediate in aggressiveness, making accurate grading essential for determining whether patients require aggressive therapy or can benefit from more conservative approaches. This demand for precise risk stratification has elevated the use of both traditional histological grading systems such as the Nottingham Grading System and molecular tools like Oncotype DX and MammaPrint within this segment.

Tumor Grade Market Share (%)
Grade 1 34.8%
Grade 2 42.7%
Grade 3 22.5%

Insights into the Cancer Type Segment with Invasive Ductal CarcinomaDominating due to the high prevalencein the market.

Breast Cancer Grading Tools Market By Cancer Type

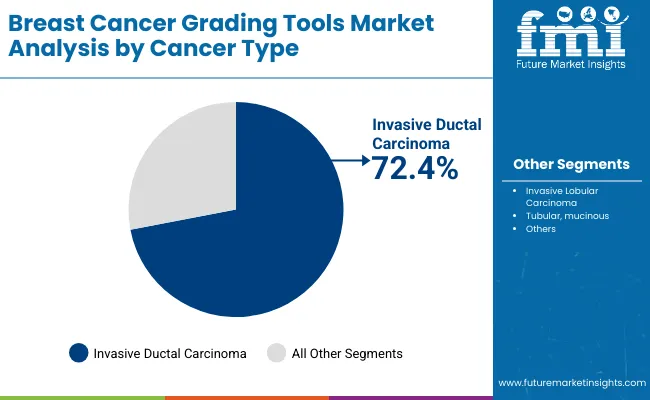
Invasive Ductal Carcinoma (IDC) has emerged as the leading cancer type segment and is projected to hold approximately 72.4% of the global Breast Cancer Grading Tools Market in 2025, driven by its status as the most common form of breast cancer globally.

IDC accounts for the majority of diagnosed breast cancer cases, significantly increasing the demand for accurate histopathological grading to guide therapeutic planning. As the clinical behavior of IDC can vary widely from low-grade, slow-growing tumors to aggressive high-grade variantsgrading tools play a crucial role in risk assessment and treatment selection.

This widespread clinical prevalence has reinforced the adoption of both conventional systems like the Nottingham Grading System and advanced molecular diagnostics such as Oncotype DX, MammaPrint, and Prosigna (PAM50). These tools enable oncologists and pathologists to evaluate tumor aggressiveness, predict recurrence risk, and tailor treatment strategies accordingly.

The segment’s dominance is further supported by international guidelines that emphasize tumor grading as a core component of IDC management. With growing integration of digital pathology and AI-assisted image analysis in hospital settings, IDC-focused grading continues to represent the backbone of diagnostic workflows in breast cancer care securing its leading position in the cancer type segment of the Breast Cancer Grading Tools Market.

Cancer Type Market Share (%)
Invasive Ductal Carcinoma 72.4%
Invasive Lobular Carcinoma 15.9%
Tubular, mucinous 3.8%
Others 7.9%

Insights into the End User Segment with Highest usage Among Hospitals

Breast Cancer Grading Tools Market By End User

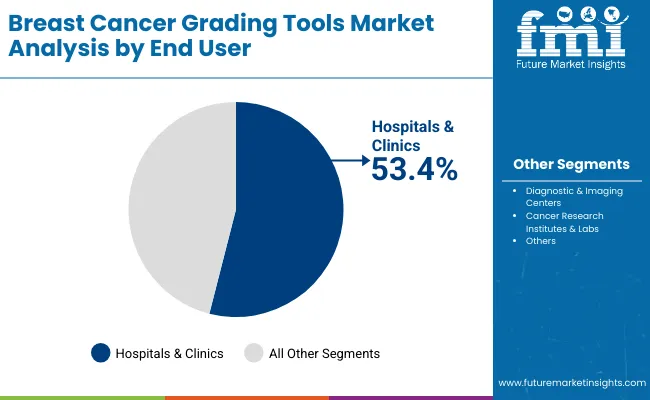
Hospitals & Clinics are expected to remain the largest end user segment, contributing approximately 53.4% to the global Breast Cancer Grading Tools Market in 2025, owing to their central role in cancer diagnosis, treatment planning, and multidisciplinary care coordination.

As primary centers for breast cancer screening and biopsy evaluation, hospitals and clinics are increasingly adopting both traditional histological grading systems such as the Nottingham Grading System and molecular tools like Oncotype DX and MammaPrint to ensure accurate and timely tumor assessment.

The demand is especially strong in oncology departments, surgical units, and pathology labs within hospitals, where the need for standardized, high-throughput, and clinically validated grading solutions is critical. Integration of digital pathology platforms and AI-based grading algorithms into hospital information systems (HIS) and electronic health records (EHRs) has enhanced workflow efficiency and diagnostic precision.

Furthermore, increasing cancer incidence, evolving clinical guidelines, and the growing emphasis on personalized oncology care have driven institutional investments in advanced grading tools.

End User Market Share (%)
Hospitals & Clinics 53.4%
Diagnostic & Imaging Centers 25.8%
Cancer Research Institutes & Labs 12.8%
Others 8.0%

What are the Drivers, Restraints, and Key Trends of the Breast Cancer Grading Tools Market?

Rising Breast Cancer Incidence and Prevalence

Breast cancer remains the most commonly diagnosed cancer among women globally, with alarming increases in incidence and prevalence rates fueling intense demand for accurate diagnostic and grading tools. As the burden of breast cancer grows worldwide, particularly in low- and middle-income countries, healthcare providers increasingly rely on sophisticated grading systems and molecular profiling tools to guide clinical decisions.

Breast cancer is a malignant tumor that originates in breast tissue, primarily in milk ducts or lobules. Globally, it represents the leading cancer diagnosis among women, accounting for significant morbidity and mortality.According to the latest estimates from the International Agency for Research on Cancer (IARC) GLOBOCAN 2022 database, approximately 2.3 million new cases of female breast cancer were diagnosed worldwide in 2022, causing an estimated 670,000 deaths.

In 2022, breast cancer was the most frequent cancer diagnosis in women across 157 of 185 countries. According to The Lancet Oncology 2025, the incidence of breast cancer is expected to rise substantially by 2050. Projections estimate a 38% increase in new cases and a 68% increase in mortality if current trends persist, with disproportionate impacts poised for low- and middle-Human Development Index (HDI) countries.

Early and precise grading of breast cancer plays a crucial role in personalized treatment and prognosis estimation. Advances in grading tools have improved detection sensitivity, classification accuracy, and treatment guidance, which are pivotal in managing the rising caseload.

Limited Awareness and Infrastructure in Emerging Markets

In many emerging economies, public knowledge about breast cancer and its early symptoms remains limited. Cultural stigmas, low health literacy, and insufficient awareness campaigns reduce women's participation in regular screening programs. As a result, breast cancers are often diagnosed at later stages, when grading tools and molecular diagnostics are less frequently employed or become costlier and more complex to use.

Studies highlight that breast cancer awareness programs are still in nascent stages in countries like India, parts of Africa, and Southeast Asia compared to developed nations. Healthcare facilities with the capability to perform advanced histopathological grading and molecular testing are limited in emerging regions.

There is a deficiency of specialized pathology laboratories, trained oncologists, and pathology technicians equipped to handle and interpret complex grading tools such as Nottingham or Oncotype DX. Infrastructure gaps extend to diagnostic imaging facilities critical for biopsy and tumor characterization. This bottleneck reduces the utilization of breast cancer grading tools despite increasing case numbers.

Advanced grading technologies, particularly molecular assays and AI-powered digital pathology systems, are often prohibitively expensive for healthcare systems and patients in emerging markets. Limited insurance coverage and reimbursement policies further restrict their accessibility. Hospitals and diagnostic centers in these regions may prioritize more basic screening and diagnostic methods, curbing the adoption of comprehensive grading tools that are essential for personalized treatment planning

Shift toward Personalized Medicine

Personalized medicine, also termed precision medicine, is revolutionizing oncology by tailoring diagnosis, prognosis, and treatment to individual patients’ genetic, molecular, and clinical profiles. This paradigm shift greatly enhances breast cancer management, driving the demand for advanced breast cancer grading tools that combine traditional histopathology with molecular assays and artificial intelligence (AI)-enabled technologies.

Personalized medicine targets the heterogeneity of breast cancer, a complex disease characterized by diverse molecular subtypes with distinct prognoses and treatment responses. Traditional “one-size-fits-all” approaches are being replaced by strategies that leverage detailed molecular diagnostics and grading systems aligned with tumor biology at the genetic and proteomic level.
  • Genomic Profiling: Enables identification of mutations, gene expression patterns (e.g., hormone receptor status or HER2), and molecular signatures driving cancer growth.
  • Targeted Therapies: Drugs like trastuzumab (HER2 positive) or CDK4/6 inhibitors offer tailored intervention based on molecular alterations.
  • Molecular Assays: Tools such as Oncotype DX, MammaPrint, and Prosigna (PAM50) quantify recurrence risk and predict chemotherapy benefit.
  • AI-Enhanced Pathology: Machine learning algorithms supplement human evaluation by automating grading and detecting molecular markers from digital pathology slides.

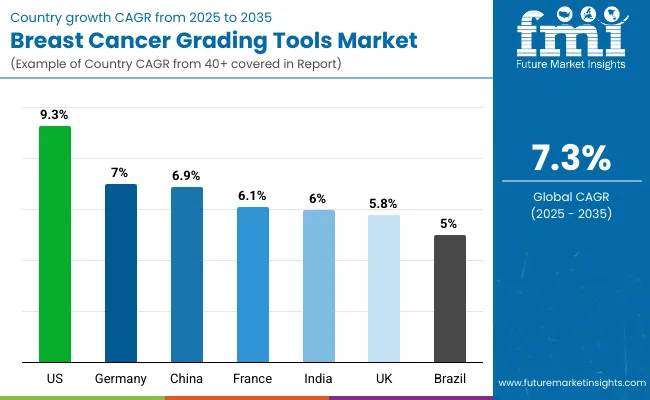
Analysis of Breast Cancer Grading Tools Marketby Key Countries

Breast Cancer Grading Tools Market Country Wise Analysis

Country CAGR
USA 9.3%
Brazil 5.0%
China 6.9%
India 6.0%
Europe 6.2%
Germany 7.0%
France 6.1%
UK. 5.8%

Asia Pacific is emerging as the fastest-growing region in the global Breast Cancer Grading Tools Market, projected to register a robust CAGR of approximately 6.0% between 2025 and 2030. Within the region, India is anticipated to grow at a CAGR of 6.0%, driven by the rising burden of breast cancer, expansion of diagnostic infrastructure, and growing investments in AI-based pathology solutions.

Increased awareness of early detection and government-backed oncology initiatives are further supporting market growth.China is expected to witness a higher CAGR of 6.9%, fueled by large-scale digitization of pathology labs, integration of molecular diagnostics into mainstream oncology workflows, and supportive national healthcare reforms.

The region’s accelerating adoption of precision medicine, combined with growing access to histological and genomic grading tools, is positioning Asia Pacific as a key growth engine for the Breast Cancer Grading Tools Market over the coming years.

Europe is expected to grow steadily at a CAGR of 6.2% through 2035 in the global Breast Cancer Grading Tools Market, supported by the region's strong cancer screening infrastructure and increasing adoption of digital and molecular diagnostic tools. Among the key regional markets, Germany is projected to expand at a CAGR of 6.6%, driven by growing integration of AI in pathology workflows, increasing hospital investments in digital pathology platforms, and continued clinical reliance on standardized grading systems such as the Nottingham Grading System.

France is estimated to grow at a CAGR of 5.8%, fueled by national initiatives aimed at enhancing early cancer detection and rising clinical use of multigene assays like Oncotype DX and MammaPrint. Meanwhile, the UK. market is anticipated to grow at a CAGR of 6.1%, supported by NHS modernization programs focused on precision oncology, digitized pathology reporting, and increased funding for AI-enhanced diagnostic solutions.

North America remains a mature yet innovation-led region in the global Breast Cancer Grading Tools Market, with the USA projected to grow at a strong CAGR of 9.3% between 2025 and 2035. Growth in the USA is largely driven by the increasing adoption of molecular grading tools like Oncotype DX, MammaPrint, and Prosigna (PAM50), which are now standard in many oncology practices for guiding personalized treatment decisions and reducing overtreatment.

The shift toward precision oncology, supported by favorable reimbursement frameworks such as those provided by Medicare, has accelerated clinical integration of genomic assays alongside traditional histopathological grading systems like the Nottingham Grading System.

Additionally, the widespread use of electronic health records (EHRs) and rising investment in AI-enhanced digital pathology platforms are enabling more accurate, scalable, and standardized tumor grading workflows across hospitals and cancer care centers.
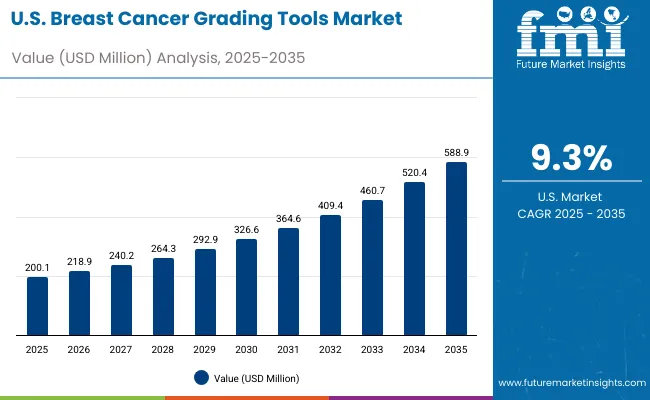
Sales Outlook for Breast Cancer Grading Tools Market in the United States

Usa Breast Cancer Grading Tools Market

The Breast Cancer Grading Tools market in the United States is projected to grow at a CAGR of approximately 9.3% between 2025 and 2035, driven by the increasing prevalence of breast cancer, advancements in digital pathology, and broader integration of genomic testing in clinical oncology.

The growing emphasis on personalized medicine and risk stratification has led to greater adoption of both traditional histological grading systems, such as the Nottingham Grading System, and molecular assays like Oncotype DX and MammaPrint. Hospitals, cancer centers, and diagnostic laboratories are leveraging these tools to enhance treatment decision-making, especially in hormone receptor-positive and early-stage breast cancer cases.

Regulatory support for precision diagnostics and favorable reimbursement policies for molecular tests are further accelerating market growth, as healthcare providers prioritize tools that deliver prognostic insights and guide therapy selection with greater accuracy.

  • Hospitals and cancer centers are integrating advanced breast cancer grading tools, including digital pathology platforms and AI-assisted histological analysis, into routine diagnostic workflows to improve grading accuracy, reduce inter-observer variability, and accelerate time-to-treatment decisions for newly diagnosed patients.
  • Molecular diagnostic laboratories and oncology-focused outpatient clinics are increasingly utilizing genomic grading assays such as Oncotype DX, MammaPrint, and Prosignato inform treatment planning in early-stage, hormone receptor-positive breast cancer cases, helping clinicians personalize chemotherapy decisions and avoid overtreatment.
  • Academic medical centers and research institutes are adopting AI-enabled whole-slide imaging systems and machine learning-based grading algorithms to support clinical trials, biomarker research, and validation of grading standards, contributing to the evolution of precision oncology and regulatory innovation in diagnostic pathology.

Growth and Expansion Outlook for Breast Cancer Grading Tools Market in the United Kingdom

The Breast Cancer Grading Tools market in the United Kingdom is expected to grow at a CAGR of approximately 5.8% through 2035, driven by the NHS’s strategic focus on early cancer detection, precision diagnostics, and digital pathology integration.

National programs under the NHS Long Term Plan, including the expansion of Rapid Diagnostic Centres (RDCs) and investments in genomic medicine, are accelerating the adoption of both histological and molecular grading tools across secondary and tertiary care settings.

The growing demand for personalized oncology treatment particularly for hormone receptor-positive and early-stage breast cancer has led to increased use of tools such as the Nottingham Grading System, Oncotype DX, and MammaPrint. Additionally, the UK’s commitment to reducing cancer diagnostic delays and enhancing clinical workflow efficiency is fostering greater deployment of AI-assisted digital pathology platforms within NHS trusts and academic medical centers.

  • NHS Trust hospitals and regional cancer centers are increasingly adopting standardized histopathological grading protocols such as the Nottingham Grading System alongside AI-powered digital pathology platforms to improve diagnostic consistency, accelerate reporting times, and support multidisciplinary cancer care pathways.
  • Primary care networks and community diagnostic hubs are beginning to integrate molecular grading tools and genomic assays into referral workflows for breast cancer, enabling more informed treatment planning before patients enter secondary care, in line with the NHS’s focus on early diagnosis and personalized medicine.
  • Academic health science networks (AHSNs) and research-led NHS institutions are piloting AI-based image analysis tools and machine learning algorithms to automate tumor grading from whole-slide images, supporting national efforts to expand digital pathology capacity and address workforce shortages in histopathology.

In-depth Analysis of Breast Cancer Grading Tools Market in Germany

The Breast Cancer Grading Tools market in Germany is projected to grow at a CAGR of approximately 7.0% through 2035, supported by Germany’s robust oncology infrastructure, widespread digitization of pathology services, and growing emphasis on precision diagnostics.

Under initiatives like the Hospital Future Act (Krankenhauszukunftsgesetz), significant federal funding has been directed toward modernizing diagnostic capabilities, including the deployment of digital pathology systems and AI-assisted image analysis tools in hospitals and cancer centers.

German healthcare institutions, recognized for their high diagnostic standards, are increasingly adopting advanced grading tools-ranging from standardized histological systems like the Nottingham Grading System to molecular profiling assays such as Oncotype DX and PAM50-to support risk stratification and personalized treatment planning.

The shift toward interoperable, AI-enhanced diagnostics is enabling more accurate tumor grading, reducing variability, and aligning with Germany’s national cancer strategy to improve early detection and outcomes in breast cancer care.
  • University hospitals and leading pathology institutes in Germany are at the forefront of integrating AI-enabled breast cancer grading tools into fully digital diagnostic workflows, combining whole-slide imaging systems with machine learning algorithms to enhance grading accuracy, reduce diagnostic delays, and streamline case reviews across multidisciplinary tumor boards.
  • Comprehensive cancer centers and molecular diagnostics labs are expanding the use of genomic grading assays, such as Oncotype DX and Prosigna (PAM50), to guide personalized treatment planning, particularly for early-stage hormone receptor-positive breast cancer patients, in alignment with German oncology guidelines and evidence-based care models.
  • Medical technology providers and health IT integrators are partnering with hospitals to implement interoperable digital pathology platforms that comply with Germany’s strict data protection regulations (GDPR), enabling secure sharing of tumor grading data across institutions and supporting national initiatives to digitize cancer diagnostics under the Hospital Future Act framework.

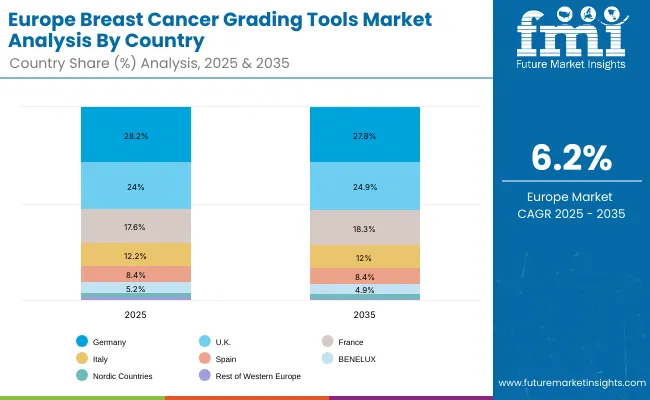
Europe Breast Cancer Grading Tools Market Share Analysis By Country

Europe Breast Cancer Grading Tools Market

Europe Country 2025
Germany 28.2%
UK 24.0%
France 17.6%
Italy 12.2%
Spain 8.4%
Benelux 5.2%
Nordics 2.5%
Rest of Europe 1.9%
Europe Country 2035
Germany 27.8%
UK 24.9%
France 18.3%
Italy 12.0%
Spain 8.4%
Benelux 4.9%
Nordics 2.6%
Rest of Europe 1.1%

Market Expansion Outlook for Breast Cancer Grading Tools Market in India

The Breast Cancer Grading Tools market in India is expected to grow at a strong CAGR of approximately 6.0% through 2035, making it one of the most promising emerging markets globally. Growth is being propelled by the rising incidence of breast cancer, expanding oncology infrastructure, and increasing adoption of digital pathology solutions in both public and private healthcare sectors.

Tertiary care hospitals and cancer institutes in Tier 1 cities are progressively implementing standardized histological grading systems such as the Nottingham Grading System to support consistent diagnosis and treatment planning.

Simultaneously, the growing availability of molecular grading tools like Oncotype DX is improving access to personalized oncology care for selected patient segments. Government initiatives such as the Ayushman Bharat Digital Mission (ABDM), along with rising investments in telepathology and digital health infrastructure, are further enabling adoption of advanced diagnostic technologies across Tier 2 and Tier 3 regions, bridging the urban-rural diagnostic divide and supporting earlier detection of breast cancer.

  • Private multi-specialty hospitals and cancer centers in India are investing in digital pathology systems and AI-powered breast cancer grading tools to improve diagnostic precision and accelerate treatment decision-making, particularly in high-volume oncology departments.
  • Medical colleges and research institutions are incorporating AI-enabled grading technologies into pathology training programs and clinical research initiatives, fostering skill development in digital diagnostics and supporting India’s growing focus on precision oncology.
  • Telemedicine platforms and diagnostic service providers are increasingly deploying molecular grading assays and digital imaging tools to facilitate remote breast cancer diagnosis and personalized treatment planning, expanding access to advanced care in rural and underserved regions.

Sales Outlook for Breast Cancer Grading Tools Market in China

The Breast Cancer Grading Tools market in China is projected to grow at a robust CAGR of approximately 6.9% through 2035, driven by significant investments in digital health infrastructure and precision oncology initiatives under the Healthy China 2030 plan.

As China accelerates modernization of its healthcare system, there is increasing adoption of advanced diagnostic technologies including AI-powered digital pathology and molecular grading assays to enhance early detection and personalized treatment of breast cancer.

The National Health Commission (NHC) supports integration of intelligent clinical tools across tertiary hospitals, telemedicine platforms, and community health centers, enabling improved diagnostic accuracy and streamlined care pathways. Growing awareness of breast cancer screening and expanded access to genomic tests are further propelling market growth across urban and semi-urban regions.
  • Tertiary hospitals in major urban centers across China are rapidly adopting AI-powered digital pathology systems and molecular breast cancer grading tools in oncology departments to enhance diagnostic precision, reduce variability in tumor grading, and support personalized treatment strategies.
  • District- and county-level hospitals are increasingly investing in digital pathology platforms and telepathology solutions as part of national initiatives to expand cancer diagnostic capabilities, enabling pathologists in semi-rural and rural areas to collaborate remotely with specialists through cloud-based image sharing and AI-assisted grading.
  • Public-private partnership hospitals and joint ventures with leading international medical institutions are incorporating FDA- and CE-approved molecular assays such as Oncotype DX and MammaPrint, alongside AI-assisted histopathology tools, to align with global best practices and establish leadership in precision oncology diagnostics.

Growth Outlook of Breast Cancer Grading Tools Market in Japan

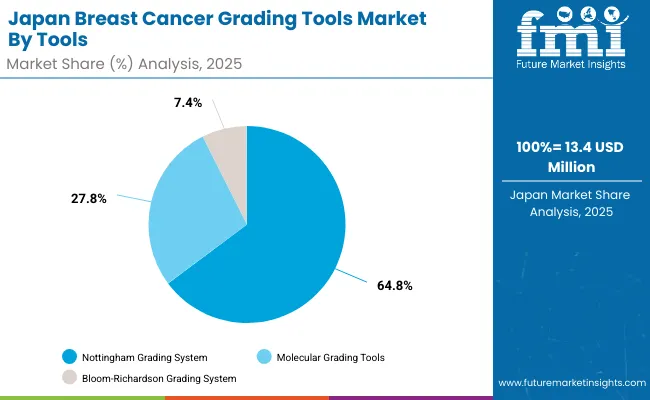
Japan Breast Cancer Grading Tools Market By Tools

The Breast Cancer Grading Tools market in Japan is projected to reach approximately USD 13.4 million in 2025, with digital histopathology and molecular grading tools collectively accounting for a growing share of diagnostic modalities.

This growth is driven by Japan’s emphasis on medical precision, aging population management, and integration of advanced technologies into clinical oncology workflows. National initiatives such as Society 5.0 and the Medical Device Industry Vision 2025 are fostering innovation in digital diagnostics, supporting the adoption of AI-powered grading systems in hospitals, cancer research institutes, and outpatient clinics.

AI-assisted digital pathology platforms and molecular assays like Oncotype DX and Prosigna (PAM50) are increasingly deployed to improve diagnostic accuracy and personalize treatment for Japan’s growing elderly breast cancer patient population. The focus on early detection and tailored therapies aligns with the healthcare system’s strategy to optimize outcomes in an aging society where more than 28% of citizens are aged 65 and older.
  • Market in Japan holds 2.9% revenue share of the global market in 2025
  • Nottingham Grading Systemdominatesby tool segment due to high accuracy and easy to use.
  • Market growth is supported by national healthcare policies addressing workforce shortages and the increasing demand for automated diagnostic solutions in oncology. The Ministry of Health, Labour and Welfare’s initiatives to promote telemedicine, digital pathology, and remote diagnostics-particularly in response to Japan’s rapidly aging population-are accelerating the adoption of AI-powered breast cancer grading tools across hospitals, long-term care facilities, and regional cancer centers.

Opportunity Analysis of South Korea in Breast Cancer Grading Tools Market

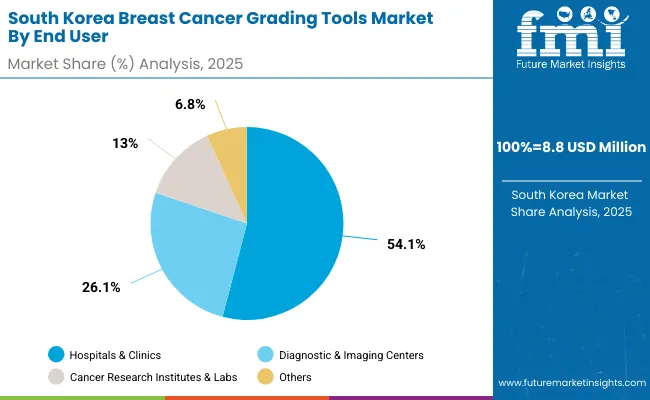
South Korea Breast Cancer Grading Tools Market By End User

The Breast Cancer Grading Tools market in South Korea is projected to reach approximately USD 8.8 million by 2025, with invasive ductal carcinoma accounting for the largest cancer type segment. Growth is driven by the rising prevalence of breast cancer and the country’s strong focus on early detection, precision oncology, and digital healthcare transformation under the Ministry of Health and Welfare (MOHW).

National strategies like the Digital Health Innovation Strategy have been pivotal in accelerating the adoption of AI-powered grading tools and molecular assays across public hospitals, cancer specialty centers, and private clinics.

Hospitals and specialized oncology centers are actively integrating AI-enabled digital pathology and molecular grading tools into breast cancer diagnostic workflows. These technologies not only improve grading accuracy for diverse tumor types but also support personalized treatment planning by reducing interobserver variability and enabling data-driven clinical decisions.
  • Market size for South Korea in 2025 is USD 8.80 million
  • South Korea holds 1.9% of the Global Market.
  • Hospitals & Clinics leads to54.1% due to increasing prevalence of breast cancer in South Korea.

Competition Landscape

Breast Cancer Grading Tools Market By Company

The global breast cancer grading tools market is moderately fragmented, with a mix of established pathology technology leaders, innovative molecular diagnostics firms, and emerging AI-driven digital pathology startups competing across histopathology grading, molecular assays, and integrated diagnostic platforms. The market is increasingly driven by the convergence of AI-powered image analysis, genomic profiling, and interoperability with electronic health records (EHR) and oncology decision support systems.

eading players such as Aiforia dominate the market with robust AI-based digital pathology platforms that enhance tumor grading accuracy and workflow efficiency through deep learning algorithms. Aiforia’s solutions are widely adopted by hospitals, research institutes, and diagnostic labs globally, supported by continuous algorithm refinement, cloud-based analytics, and integration with established pathology workflows. Their leadership position is reinforced by strategic partnerships and regulatory compliance, enabling widespread clinical validation and adoption.

Other key players including Bruker Spatial Biology, Inc., Indica Labs, LLC, and Leica BiosystemsNussloch GmbH provide advanced digital pathology imaging systems and spatial biology tools that facilitate precise grading and biomarker analysis. These companies leverage cutting-edge multiplexing technologies and AI-enabled image interpretation to support personalized oncology care. Leica Biosystems, with its global distribution network and legacy in pathology instruments, remains a trusted partner for many hospital pathology departments.

Mid-sized innovators such as iCAD, Inc., Endomagnetics Ltd., and Exact Sciences Corporation focus on niche molecular grading assays and integrated cancer diagnostic solutions. iCAD’s AI-based image analysis tools, for example, support breast cancer margin assessment and grading, enhancing intraoperative decision-making. Exact Sciences combines molecular assays with digital reporting platforms, facilitating early-stage cancer risk stratification and treatment guidance.

Emerging companies like Owkin, Inc. and SimBioSys are gaining traction by offering AI-powered predictive analytics and virtual tumor models that enable more precise grading and prognostic assessments. These startups emphasize machine learning-driven interpretation of multi-modal data-combining histology, genomics, and clinical information-to improve treatment personalization, targeting research centers and advanced oncology clinics.

As the market evolves, differentiation is shifting from standalone grading tools to comprehensive, AI-augmented diagnostic ecosystems that integrate molecular data, digital histopathology, and clinical decision support. Players are investing heavily in cloud-based platforms, interoperability standards, and user-centric designs that enhance pathologist productivity and enable remote expert consultations. Moreover, alignment with global regulatory frameworks and participation in government cancer control programs are becoming key factors driving market adoption and competitive advantage.

Key Developments:

On September 22 2025, SOPHiA GENETICS, an AI technology company transforming precision medicine, announced an expansion of its collaboration with AstraZeneca (LSE/STO/Nasdaq: AZN) from the World CB & CDx Summit in Boston. The companies aim to improve the diagnosis and treatment of breast and prostate cancer by developing an optimized next generation sequencing (NGS) solution that leverages SOPHiA GENETICS's AI algorithms to detect genetic mutations in the PIK3CA/AKT1/PTEN pathway.

On June 24 2025, Aiforia Technologies Plc launched a new CE-IVD marked clinical AI solution for breast cancer grading. Aiforia Breast Cancer Grading AI solution is a part of the Aiforia Breast Cancer Suite, which also includes CE-IVD marked AI models for breast cancer biomarkers and the Aiforia Clinical Suite Viewer. This complete solution offers a fully digital cockpit for breast cancer diagnostics, supporting the entire diagnostic workflow.

Scope of the Report

Item Value
Market Value 2025 USD 463.3 million
Tools Nottingham Grading System, Bloom-Richardson Grading System, and Molecular Grading Tools
Tumor Grade Grade 1, Grade 2, and Grade 3
Cancer Type Invasive Ductal Carcinoma, Invasive Lobular Carcinoma, Tubular, mucinous, and Others
End User Hospitals & Clinics, Diagnostic & Imaging Centers, Ca ncer Research Institutes & Labs and Others
Regions Covered North America, Latin America, Western & Eastern Europe, East Asia, South Asia & Pacific, Middle East & Africa
Countries Covered USA, Brazil, China, India, Germany, France, UK. etc.
Key Companies Profiled Aiforia, Primaa, Bruker Spatial Biology, Inc., Indica Labs, LLC., Leica Biosystems Nussloch GmbH, iCAD, Inc., Endomagnetics Ltd., Exact Sciences Corporation., Owkin, Inc., and SimBioSys
Additional Attributes Molecular assays such as Oncotype DX, MammaPrint, and Prosigna (PAM50) are widely adopted in the USA, Europe, and Japan for guiding treatment in early-stage hormone receptor-positive breast cancer. These tools reduce over-treatment, support value-based care, and are increasingly reimbursed by public and private payers.

Key Segments

By Tools:

  • Nottingham Grading System
  • Bloom-Richardson Grading System
  • Molecular Grading Tools
    • Oncotype DX
    • MammaPrint
    • Prosigna (PAM50)

By Tumor Grade:

  • Grade 1
  • Grade 2
  • Grade 3

By Cancer Type:

  • Invasive Ductal Carcinoma
  • Invasive Lobular Carcinoma
  • Tubular, mucinous
  • Others (Medullary, Papillary Carcinomas)

By End User:

  • Hospitals & Clinics
  • Diagnostic & Imaging Centers
  • Cancer Research Institutes & Labs
  • Others

By Region:

  • North America
  • Latin America
  • Western Europe
  • Eastern Europe
  • East Asia
  • South Asia
  • MEA

Table of Content

  1. Executive Summary
    • Global Market Outlook
    • Demand-side Trends
    • Supply-side Trends
    • Technology Roadmap Analysis
    • Analysis and Recommendations
  2. Market Overview
    • Market Coverage / Taxonomy
    • Market Definition / Scope / Limitations
  3. Market Background
    • Market Dynamics
      • Drivers
      • Restraints
      • Opportunity
      • Trends
    • Scenario Forecast
      • Demand in Optimistic Scenario
      • Demand in Likely Scenario
      • Demand in Conservative Scenario
    • Opportunity Map Analysis
    • Product Life Cycle Analysis
    • Technological Advancement
    • Investment Feasibility Matrix
    • Breast Cancer Epidemiology, by Region
    • PESTLE and Porter’s Analysis
    • Regulatory Landscape
      • By Key Regions
      • By Key Countries
    • Regional Parent Market Outlook
    • Recent Prouct Launches/Approvals
  4. Global Market Analysis 2020 to 2024 and Forecast, 2025 to 2035
    • Historical Market Size Value (USD Million) & Volume (Units) Analysis, 2020 to 2024
    • Current and Future Market Size Value (USD Million) & Volume (Units) Projections, 2025 to 2035
      • Y-o-Y Growth Trend Analysis
      • Absolute $ Opportunity Analysis
  5. Global Market Analysis 2020 to 2024 and Forecast 2025 to 2035, By Tools
    • Introduction / Key Findings
    • Historical Market Size Value (USD Million) & Volume (Units) Analysis By Tools, 2020 to 2024
    • Current and Future Market Size Value (USD Million) & Volume (Units) Analysis and Forecast By Tools, 2025 to 2035
      • Nottingham Grading System
      • Bloom-Richardson Grading System
      • Molecular Grading Tools
        • Oncotype DX
        • MammaPrint
        • Prosigna (PAM50)
    • Y-o-Y Growth Trend Analysis By Tools, 2020 to 2024
    • Absolute $ Opportunity Analysis By Tools, 2025 to 2035
  6. Global Market Analysis 2020 to 2024 and Forecast 2025 to 2035, By Tumor Grade
    • Introduction / Key Findings
    • Historical Market Size Value (USD Million) & Volume (Units) Analysis By Tumor Grade, 2020 to 2024
    • Current and Future Market Size Value (USD Million) & Volume (Units) Analysis and Forecast By Tumor Grade, 2025 to 2035
      • Grade 1
      • Grade 2
      • Grade 3
    • Y-o-Y Growth Trend Analysis By Tumor Grade, 2020 to 2024
    • Absolute $ Opportunity Analysis By Tumor Grade, 2025 to 2035
  7. Global Market Analysis 2020 to 2024 and Forecast 2025 to 2035, By Cancer Type
    • Introduction / Key Findings
    • Historical Market Size Value (USD Million) & Volume (Units) Analysis By Cancer Type, 2020 to 2024
    • Current and Future Market Size Value (USD Million) & Volume (Units) Analysis and Forecast By Cancer Type, 2025 to 2035
      • Invasive Ductal Carcinoma
      • Invasive Lobular Carcinoma
      • Tubular, mucinous
      • Others (Medullary, Papillary Carcinomas)
  8. Others
    • Y-o-Y Growth Trend Analysis By Cancer Type, 2020 to 2024
    • Absolute $ Opportunity Analysis By Cancer Type, 2025 to 2035
  9. Global Market Analysis 2020 to 2024 and Forecast 2025 to 2035, By End User
    • Introduction / Key Findings
    • Historical Market Size Value (USD Million) & Volume (Units) Analysis By End User, 2020 to 2024
    • Current and Future Market Size Value (USD Million) & Volume (Units) Analysis and Forecast By End User, 2025 to 2035
      • Hospitals & Clinics
      • Diagnostic & Imaging Centers
      • Cancer Research Institutes & Labs
      • Others
    • Y-o-Y Growth Trend Analysis By End User, 2020 to 2024
    • Absolute $ Opportunity Analysis By End User, 2025 to 2035
  10. Global Market Analysis 2020 to 2024 and Forecast 2025 to 2035, By Region
    • Introduction
    • Historical Market Size Value (USD Million) & Volume (Units) Analysis By Region, 2020 to 2024
    • Current Market Size Value (USD Million) & Volume (Units) Analysis and Forecast By Region, 2025 to 2035
      • North America
      • Latin America
      • Western Europe
      • Eastern Europe
      • East Asia
      • South Asia
      • MEA
    • Market Attractiveness Analysis By Region
  11. North America Market Analysis 2020 to 2024 and Forecast 2025 to 2035, By Country
    • Historical Market Size Value (USD Million) & Volume (Units) Trend Analysis By Market Taxonomy, 2020 to 2024
    • Market Size Value (USD Million) & Volume (Units) Forecast By Market Taxonomy, 2025 to 2035
      • By Country
        • USA
        • Canada
        • Mexico
      • By Tools
      • By Tumor Grade
      • By Cancer Type
      • By End User
    • Market Attractiveness Analysis
      • By Country
      • By Tools
      • By Tumor Grade
      • By Cancer Type
      • By End User
    • Key Takeaways
  12. Latin America Market Analysis 2020 to 2024 and Forecast 2025 to 2035, By Country
    • Historical Market Size Value (USD Million) & Volume (Units) Trend Analysis By Market Taxonomy, 2020 to 2024
    • Market Size Value (USD Million) & Volume (Units) Forecast By Market Taxonomy, 2025 to 2035
      • By Country
        • Brazil
        • Argentina
        • Rest of Latin America
      • By Tools
      • By Tumor Grade
      • By Cancer Type
      • By End User
    • Market Attractiveness Analysis
      • By Country
      • By Tools
      • By Tumor Grade
      • By Cancer Type
      • By End User
    • Key Takeaways
  13. Western Europe Market Analysis 2020 to 2024 and Forecast 2025 to 2035, By Country
    • Historical Market Size Value (USD Million) & Volume (Units) Trend Analysis By Market Taxonomy, 2020 to 2024
    • Market Size Value (USD Million) & Volume (Units) Forecast By Market Taxonomy, 2025 to 2035
      • By Country
        • Germany
        • Italy
        • France
        • UK
        • Spain
        • BENELUX
        • Nordic Countries
        • Rest of Western Europe
      • By Tools
      • By Tumor Grade
      • By Cancer Type
      • By End User
    • Market Attractiveness Analysis
      • By Country
      • By Tools
      • By Tumor Grade
      • By Cancer Type
      • By End User
    • Key Takeaways
  14. Eastern Europe Market Analysis 2020 to 2024 and Forecast 2025 to 2035, By Country
    • Historical Market Size Value (USD Million) & Volume (Units) Trend Analysis By Market Taxonomy, 2020 to 2024
    • Market Size Value (USD Million) & Volume (Units) Forecast By Market Taxonomy, 2025 to 2035
      • By Country
        • Russia
        • Hungry
        • Poland
        • Rest of Eastern Europe
      • By Tools
      • By Tumor Grade
      • By Cancer Type
      • By End User
    • Market Attractiveness Analysis
      • By Country
      • By Tools
      • By Tumor Grade
      • By Cancer Type
      • By End User
    • Key Takeaways
  15. East Asia Market Analysis 2020 to 2024 and Forecast 2025 to 2035, By Country
    • Historical Market Size Value (USD Million) & Volume (Units) Trend Analysis By Market Taxonomy, 2020 to 2024
    • Market Size Value (USD Million) & Volume (Units) Forecast By Market Taxonomy, 2025 to 2035
      • By Country
        • China
        • Japan
        • South Korea
      • By Tools
      • By Tumor Grade
      • By Cancer Type
      • By End User
    • Market Attractiveness Analysis
      • By Country
      • By Tools
      • By Tumor Grade
      • By Cancer Type
      • By End User
    • Key Takeaways
  16. South Asia Market Analysis 2020 to 2024 and Forecast 2025 to 2035, By Country
    • Historical Market Size Value (USD Million) & Volume (Units) Trend Analysis By Market Taxonomy, 2020 to 2024
    • Market Size Value (USD Million) & Volume (Units) Forecast By Market Taxonomy, 2025 to 2035
      • By Country
        • India
        • ASEAN Countries
        • Australia & New Zealand
        • Rest of South Asia
      • By Tools
      • By Tumor Grade
      • By Cancer Type
      • By End User
    • Market Attractiveness Analysis
      • By Country
      • By Tools
      • By Tumor Grade
      • By Cancer Type
      • By End User
    • Key Takeaways
  17. MEA Market Analysis 2020 to 2024 and Forecast 2025 to 2035, By Country
    • Historical Market Size Value (USD Million) & Volume (Units) Trend Analysis By Market Taxonomy, 2020 to 2024
    • Market Size Value (USD Million) & Volume (Units) Forecast By Market Taxonomy, 2025 to 2035
      • By Country
        • Saudi Arabia
        • Türkiye
        • South Africa
        • Other African Union
        • Rest of MEA
      • By Tools
      • By Tumor Grade
      • By Cancer Type
      • By End User
    • Market Attractiveness Analysis
      • By Country
      • By Tools
      • By Tumor Grade
      • By Cancer Type
      • By End User
    • Key Takeaways
  18. Key Countries Market Analysis
    • USA
      • Pricing Analysis
      • Market Share Analysis, 2024
        • By Tools
        • By Tumor Grade
        • By Cancer Type
        • By End User
    • Brazil
      • Pricing Analysis
      • Market Share Analysis, 2024
        • By Tools
        • By Tumor Grade
        • By Cancer Type
        • By End User
    • China
      • Pricing Analysis
      • Market Share Analysis, 2024
        • By Tools
        • By Tumor Grade
        • By Cancer Type
        • By End User
    • India
      • Pricing Analysis
      • Market Share Analysis, 2024
        • By Tools
        • By Tumor Grade
        • By Cancer Type
        • By End User
    • Europe
      • Pricing Analysis
      • Market Share Analysis, 2024
        • By Tools
        • By Tumor Grade
        • By Cancer Type
        • By End User
    • Germany
      • Pricing Analysis
      • Market Share Analysis, 2024
        • By Tools
        • By Tumor Grade
        • By Cancer Type
        • By End User
    • France
      • Pricing Analysis
      • Market Share Analysis, 2024
        • By Tools
        • By Tumor Grade
        • By Cancer Type
        • By End User
    • UK
      • Pricing Analysis
      • Market Share Analysis, 2024
        • By Tools
        • By Tumor Grade
        • By Cancer Type
        • By End User
  19. Market Structure Analysis
    • Competition Dashboard
    • Competition Benchmarking
    • Market Share Analysis of Top Players
      • By Regional
      • By Tools
      • By Tumor Grade
      • By Cancer Type
      • By End User
  20. Competition Analysis
    • Competition Deep Dive
      • Aiforia
        • Overview
        • Product Portfolio
        • Profitability by Market Segments (Product/Age /Sales Channel/Region)
        • Sales Footprint
        • Strategy Overview
          • Marketing Strategy
          • Product Strategy
          • Channel Strategy
      • Primaa
        • Overview
        • Product Portfolio
        • Profitability by Market Segments (Product/Age /Sales Channel/Region)
        • Sales Footprint
        • Strategy Overview
          • Marketing Strategy
          • Product Strategy
          • Channel Strategy
      • Bruker Spatial Biology, Inc.
        • Overview
        • Product Portfolio
        • Profitability by Market Segments (Product/Age /Sales Channel/Region)
        • Sales Footprint
        • Strategy Overview
          • Marketing Strategy
          • Product Strategy
          • Channel Strategy
      • Indica Labs, LLC.
        • Overview
        • Product Portfolio
        • Profitability by Market Segments (Product/Age /Sales Channel/Region)
        • Sales Footprint
        • Strategy Overview
          • Marketing Strategy
          • Product Strategy
          • Channel Strategy
      • Leica Biosystems Nussloch GmbH
        • Overview
        • Product Portfolio
        • Profitability by Market Segments (Product/Age /Sales Channel/Region)
        • Sales Footprint
        • Strategy Overview
          • Marketing Strategy
          • Product Strategy
          • Channel Strategy
      • iCAD, Inc.
        • Overview
        • Product Portfolio
        • Profitability by Market Segments (Product/Age /Sales Channel/Region)
        • Sales Footprint
        • Strategy Overview
          • Marketing Strategy
          • Product Strategy
          • Channel Strategy
      • Endomagnetics Ltd.
        • Overview
        • Product Portfolio
        • Profitability by Market Segments (Product/Age /Sales Channel/Region)
        • Sales Footprint
        • Strategy Overview
          • Marketing Strategy
          • Product Strategy
          • Channel Strategy
      • Exact Sciences Corporation.
        • Overview
        • Product Portfolio
        • Profitability by Market Segments (Product/Age /Sales Channel/Region)
        • Sales Footprint
        • Strategy Overview
          • Marketing Strategy
          • Product Strategy
          • Channel Strategy
      • Owkin, Inc.
        • Overview
        • Product Portfolio
        • Profitability by Market Segments (Product/Age /Sales Channel/Region)
        • Sales Footprint
        • Strategy Overview
          • Marketing Strategy
          • Product Strategy
          • Channel Strategy
      • SimBioSys
        • Overview
        • Product Portfolio
        • Profitability by Market Segments (Product/Age /Sales Channel/Region)
        • Sales Footprint
        • Strategy Overview
          • Marketing Strategy
          • Product Strategy
          • Channel Strategy
  21. Assumptions & Acronyms Used
  22. Research Methodology

List of Tables

  • Table 1: Global Market Value (USD Million) Forecast by Region, 2020-2035
  • Table 2: Global Market Volume (Units) Forecast by Region, 2020-2035
  • Table 3: Global Market Value (USD Million) Forecast by Tools, 2020-2035
  • Table 4: Global Market Volume (Units) Forecast by Tools, 2020-2035
  • Table 5: Global Market Value (USD Million) Forecast by Tumor Grade, 2020-2035
  • Table 6: Global Market Volume (Units) Forecast by Tumor Grade, 2020-2035
  • Table 7: Global Market Value (USD Million) Forecast by Cancer Type, 2020-2035
  • Table 8: Global Market Volume (Units) Forecast by Cancer Type, 2020-2035
  • Table 9: Global Market Value (USD Million) Forecast by End User, 2020-2035
  • Table 10: Global Market Volume (Units) Forecast by End User, 2020-2035
  • Table 11: North America Market Value (USD Million) Forecast by Country, 2020-2035
  • Table 12: North America Market Volume (Units) Forecast by Country, 2020-2035
  • Table 13: North America Market Value (USD Million) Forecast by Tools, 2020-2035
  • Table 14: North America Market Volume (Units) Forecast by Tools, 2020-2035
  • Table 15: North America Market Value (USD Million) Forecast by Tumor Grade, 2020-2035
  • Table 16: North America Market Volume (Units) Forecast by Tumor Grade, 2020-2035
  • Table 17: North America Market Value (USD Million) Forecast by Cancer Type, 2020-2035
  • Table 18: North America Market Volume (Units) Forecast by Cancer Type, 2020-2035
  • Table 19: North America Market Value (USD Million) Forecast by End User, 2020-2035
  • Table 20: North America Market Volume (Units) Forecast by End User, 2020-2035
  • Table 21: Latin America Market Value (USD Million) Forecast by Country, 2020-2035
  • Table 22: Latin America Market Volume (Units) Forecast by Country, 2020-2035
  • Table 23: Latin America Market Value (USD Million) Forecast by Tools, 2020-2035
  • Table 24: Latin America Market Volume (Units) Forecast by Tools, 2020-2035
  • Table 25: Latin America Market Value (USD Million) Forecast by Tumor Grade, 2020-2035
  • Table 26: Latin America Market Volume (Units) Forecast by Tumor Grade, 2020-2035
  • Table 27: Latin America Market Value (USD Million) Forecast by Cancer Type, 2020-2035
  • Table 28: Latin America Market Volume (Units) Forecast by Cancer Type, 2020-2035
  • Table 29: Latin America Market Value (USD Million) Forecast by End User, 2020-2035
  • Table 30: Latin America Market Volume (Units) Forecast by End User, 2020-2035
  • Table 31: Western Europe Market Value (USD Million) Forecast by Country, 2020-2035
  • Table 32: Western Europe Market Volume (Units) Forecast by Country, 2020-2035
  • Table 33: Western Europe Market Value (USD Million) Forecast by Tools, 2020-2035
  • Table 34: Western Europe Market Volume (Units) Forecast by Tools, 2020-2035
  • Table 35: Western Europe Market Value (USD Million) Forecast by Tumor Grade, 2020-2035
  • Table 36: Western Europe Market Volume (Units) Forecast by Tumor Grade, 2020-2035
  • Table 37: Western Europe Market Value (USD Million) Forecast by Cancer Type, 2020-2035
  • Table 38: Western Europe Market Volume (Units) Forecast by Cancer Type, 2020-2035
  • Table 39: Western Europe Market Value (USD Million) Forecast by End User, 2020-2035
  • Table 40: Western Europe Market Volume (Units) Forecast by End User, 2020-2035
  • Table 41: Eastern Europe Market Value (USD Million) Forecast by Country, 2020-2035
  • Table 42: Eastern Europe Market Volume (Units) Forecast by Country, 2020-2035
  • Table 43: Eastern Europe Market Value (USD Million) Forecast by Tools, 2020-2035
  • Table 44: Eastern Europe Market Volume (Units) Forecast by Tools, 2020-2035
  • Table 45: Eastern Europe Market Value (USD Million) Forecast by Tumor Grade, 2020-2035
  • Table 46: Eastern Europe Market Volume (Units) Forecast by Tumor Grade, 2020-2035
  • Table 47: Eastern Europe Market Value (USD Million) Forecast by Cancer Type, 2020-2035
  • Table 48: Eastern Europe Market Volume (Units) Forecast by Cancer Type, 2020-2035
  • Table 49: Eastern Europe Market Value (USD Million) Forecast by End User, 2020-2035
  • Table 50: Eastern Europe Market Volume (Units) Forecast by End User, 2020-2035
  • Table 51: East Asia Market Value (USD Million) Forecast by Country, 2020-2035
  • Table 52: East Asia Market Volume (Units) Forecast by Country, 2020-2035
  • Table 53: East Asia Market Value (USD Million) Forecast by Tools, 2020-2035
  • Table 54: East Asia Market Volume (Units) Forecast by Tools, 2020-2035
  • Table 55: East Asia Market Value (USD Million) Forecast by Tumor Grade, 2020-2035
  • Table 56: East Asia Market Volume (Units) Forecast by Tumor Grade, 2020-2035
  • Table 57: East Asia Market Value (USD Million) Forecast by Cancer Type, 2020-2035
  • Table 58: East Asia Market Volume (Units) Forecast by Cancer Type, 2020-2035
  • Table 59: East Asia Market Value (USD Million) Forecast by End User, 2020-2035
  • Table 60: East Asia Market Volume (Units) Forecast by End User, 2020-2035
  • Table 61: South Asia Market Value (USD Million) Forecast by Country, 2020-2035
  • Table 62: South Asia Market Volume (Units) Forecast by Country, 2020-2035
  • Table 63: South Asia Market Value (USD Million) Forecast by Tools, 2020-2035
  • Table 64: South Asia Market Volume (Units) Forecast by Tools, 2020-2035
  • Table 65: South Asia Market Value (USD Million) Forecast by Tumor Grade, 2020-2035
  • Table 66: South Asia Market Volume (Units) Forecast by Tumor Grade, 2020-2035
  • Table 67: South Asia Market Value (USD Million) Forecast by Cancer Type, 2020-2035
  • Table 68: South Asia Market Volume (Units) Forecast by Cancer Type, 2020-2035
  • Table 69: South Asia Market Value (USD Million) Forecast by End User, 2020-2035
  • Table 70: South Asia Market Volume (Units) Forecast by End User, 2020-2035
  • Table 71: MEA Market Value (USD Million) Forecast by Country, 2020-2035
  • Table 72: MEA Market Volume (Units) Forecast by Country, 2020-2035
  • Table 73: MEA Market Value (USD Million) Forecast by Tools, 2020-2035
  • Table 74: MEA Market Volume (Units) Forecast by Tools, 2020-2035
  • Table 75: MEA Market Value (USD Million) Forecast by Tumor Grade, 2020-2035
  • Table 76: MEA Market Volume (Units) Forecast by Tumor Grade, 2020-2035
  • Table 77: MEA Market Value (USD Million) Forecast by Cancer Type, 2020-2035
  • Table 78: MEA Market Volume (Units) Forecast by Cancer Type, 2020-2035
  • Table 79: MEA Market Value (USD Million) Forecast by End User, 2020-2035
  • Table 80: MEA Market Volume (Units) Forecast by End User, 2020-2035

List of Figures

  • Figure 1: Global Market Value (USD Million) by Tools, 2025-2035
  • Figure 2: Global Market Value (USD Million) by Tumor Grade, 2025-2035
  • Figure 3: Global Market Value (USD Million) by Cancer Type, 2025-2035
  • Figure 4: Global Market Value (USD Million) by End User, 2025-2035
  • Figure 5: Global Market Value (USD Million) by Region, 2025-2035
  • Figure 6: Global Market Value (USD Million) Analysis by Region, 2020-2035
  • Figure 7: Global Market Volume (Units) Analysis by Region, 2020-2035
  • Figure 8: Global Market Value Share (%) and BPS Analysis by Region, 2025-2035
  • Figure 9: Global Market Y-o-Y Growth (%) Projections by Region, 2025-2035
  • Figure 10: Global Market Value (USD Million) Analysis by Tools, 2020-2035
  • Figure 11: Global Market Volume (Units) Analysis by Tools, 2020-2035
  • Figure 12: Global Market Value Share (%) and BPS Analysis by Tools, 2025-2035
  • Figure 13: Global Market Y-o-Y Growth (%) Projections by Tools, 2025-2035
  • Figure 14: Global Market Value (USD Million) Analysis by Tumor Grade, 2020-2035
  • Figure 15: Global Market Volume (Units) Analysis by Tumor Grade, 2020-2035
  • Figure 16: Global Market Value Share (%) and BPS Analysis by Tumor Grade, 2025-2035
  • Figure 17: Global Market Y-o-Y Growth (%) Projections by Tumor Grade, 2025-2035
  • Figure 18: Global Market Value (USD Million) Analysis by Cancer Type, 2020-2035
  • Figure 19: Global Market Volume (Units) Analysis by Cancer Type, 2020-2035
  • Figure 20: Global Market Value Share (%) and BPS Analysis by Cancer Type, 2025-2035
  • Figure 21: Global Market Y-o-Y Growth (%) Projections by Cancer Type, 2025-2035
  • Figure 22: Global Market Value (USD Million) Analysis by End User, 2020-2035
  • Figure 23: Global Market Volume (Units) Analysis by End User, 2020-2035
  • Figure 24: Global Market Value Share (%) and BPS Analysis by End User, 2025-2035
  • Figure 25: Global Market Y-o-Y Growth (%) Projections by End User, 2025-2035
  • Figure 26: Global Market Attractiveness by Tools, 2025-2035
  • Figure 27: Global Market Attractiveness by Tumor Grade, 2025-2035
  • Figure 28: Global Market Attractiveness by Cancer Type, 2025-2035
  • Figure 29: Global Market Attractiveness by End User, 2025-2035
  • Figure 30: Global Market Attractiveness by Region, 2025-2035
  • Figure 31: North America Market Value (USD Million) by Tools, 2025-2035
  • Figure 32: North America Market Value (USD Million) by Tumor Grade, 2025-2035
  • Figure 33: North America Market Value (USD Million) by Cancer Type, 2025-2035
  • Figure 34: North America Market Value (USD Million) by End User, 2025-2035
  • Figure 35: North America Market Value (USD Million) by Country, 2025-2035
  • Figure 36: North America Market Value (USD Million) Analysis by Country, 2020-2035
  • Figure 37: North America Market Volume (Units) Analysis by Country, 2020-2035
  • Figure 38: North America Market Value Share (%) and BPS Analysis by Country, 2025-2035
  • Figure 39: North America Market Y-o-Y Growth (%) Projections by Country, 2025-2035
  • Figure 40: North America Market Value (USD Million) Analysis by Tools, 2020-2035
  • Figure 41: North America Market Volume (Units) Analysis by Tools, 2020-2035
  • Figure 42: North America Market Value Share (%) and BPS Analysis by Tools, 2025-2035
  • Figure 43: North America Market Y-o-Y Growth (%) Projections by Tools, 2025-2035
  • Figure 44: North America Market Value (USD Million) Analysis by Tumor Grade, 2020-2035
  • Figure 45: North America Market Volume (Units) Analysis by Tumor Grade, 2020-2035
  • Figure 46: North America Market Value Share (%) and BPS Analysis by Tumor Grade, 2025-2035
  • Figure 47: North America Market Y-o-Y Growth (%) Projections by Tumor Grade, 2025-2035
  • Figure 48: North America Market Value (USD Million) Analysis by Cancer Type, 2020-2035
  • Figure 49: North America Market Volume (Units) Analysis by Cancer Type, 2020-2035
  • Figure 50: North America Market Value Share (%) and BPS Analysis by Cancer Type, 2025-2035
  • Figure 51: North America Market Y-o-Y Growth (%) Projections by Cancer Type, 2025-2035
  • Figure 52: North America Market Value (USD Million) Analysis by End User, 2020-2035
  • Figure 53: North America Market Volume (Units) Analysis by End User, 2020-2035
  • Figure 54: North America Market Value Share (%) and BPS Analysis by End User, 2025-2035
  • Figure 55: North America Market Y-o-Y Growth (%) Projections by End User, 2025-2035
  • Figure 56: North America Market Attractiveness by Tools, 2025-2035
  • Figure 57: North America Market Attractiveness by Tumor Grade, 2025-2035
  • Figure 58: North America Market Attractiveness by Cancer Type, 2025-2035
  • Figure 59: North America Market Attractiveness by End User, 2025-2035
  • Figure 60: North America Market Attractiveness by Country, 2025-2035
  • Figure 61: Latin America Market Value (USD Million) by Tools, 2025-2035
  • Figure 62: Latin America Market Value (USD Million) by Tumor Grade, 2025-2035
  • Figure 63: Latin America Market Value (USD Million) by Cancer Type, 2025-2035
  • Figure 64: Latin America Market Value (USD Million) by End User, 2025-2035
  • Figure 65: Latin America Market Value (USD Million) by Country, 2025-2035
  • Figure 66: Latin America Market Value (USD Million) Analysis by Country, 2020-2035
  • Figure 67: Latin America Market Volume (Units) Analysis by Country, 2020-2035
  • Figure 68: Latin America Market Value Share (%) and BPS Analysis by Country, 2025-2035
  • Figure 69: Latin America Market Y-o-Y Growth (%) Projections by Country, 2025-2035
  • Figure 70: Latin America Market Value (USD Million) Analysis by Tools, 2020-2035
  • Figure 71: Latin America Market Volume (Units) Analysis by Tools, 2020-2035
  • Figure 72: Latin America Market Value Share (%) and BPS Analysis by Tools, 2025-2035
  • Figure 73: Latin America Market Y-o-Y Growth (%) Projections by Tools, 2025-2035
  • Figure 74: Latin America Market Value (USD Million) Analysis by Tumor Grade, 2020-2035
  • Figure 75: Latin America Market Volume (Units) Analysis by Tumor Grade, 2020-2035
  • Figure 76: Latin America Market Value Share (%) and BPS Analysis by Tumor Grade, 2025-2035
  • Figure 77: Latin America Market Y-o-Y Growth (%) Projections by Tumor Grade, 2025-2035
  • Figure 78: Latin America Market Value (USD Million) Analysis by Cancer Type, 2020-2035
  • Figure 79: Latin America Market Volume (Units) Analysis by Cancer Type, 2020-2035
  • Figure 80: Latin America Market Value Share (%) and BPS Analysis by Cancer Type, 2025-2035
  • Figure 81: Latin America Market Y-o-Y Growth (%) Projections by Cancer Type, 2025-2035
  • Figure 82: Latin America Market Value (USD Million) Analysis by End User, 2020-2035
  • Figure 83: Latin America Market Volume (Units) Analysis by End User, 2020-2035
  • Figure 84: Latin America Market Value Share (%) and BPS Analysis by End User, 2025-2035
  • Figure 85: Latin America Market Y-o-Y Growth (%) Projections by End User, 2025-2035
  • Figure 86: Latin America Market Attractiveness by Tools, 2025-2035
  • Figure 87: Latin America Market Attractiveness by Tumor Grade, 2025-2035
  • Figure 88: Latin America Market Attractiveness by Cancer Type, 2025-2035
  • Figure 89: Latin America Market Attractiveness by End User, 2025-2035
  • Figure 90: Latin America Market Attractiveness by Country, 2025-2035
  • Figure 91: Western Europe Market Value (USD Million) by Tools, 2025-2035
  • Figure 92: Western Europe Market Value (USD Million) by Tumor Grade, 2025-2035
  • Figure 93: Western Europe Market Value (USD Million) by Cancer Type, 2025-2035
  • Figure 94: Western Europe Market Value (USD Million) by End User, 2025-2035
  • Figure 95: Western Europe Market Value (USD Million) by Country, 2025-2035
  • Figure 96: Western Europe Market Value (USD Million) Analysis by Country, 2020-2035
  • Figure 97: Western Europe Market Volume (Units) Analysis by Country, 2020-2035
  • Figure 98: Western Europe Market Value Share (%) and BPS Analysis by Country, 2025-2035
  • Figure 99: Western Europe Market Y-o-Y Growth (%) Projections by Country, 2025-2035
  • Figure 100: Western Europe Market Value (USD Million) Analysis by Tools, 2020-2035
  • Figure 101: Western Europe Market Volume (Units) Analysis by Tools, 2020-2035
  • Figure 102: Western Europe Market Value Share (%) and BPS Analysis by Tools, 2025-2035
  • Figure 103: Western Europe Market Y-o-Y Growth (%) Projections by Tools, 2025-2035
  • Figure 104: Western Europe Market Value (USD Million) Analysis by Tumor Grade, 2020-2035
  • Figure 105: Western Europe Market Volume (Units) Analysis by Tumor Grade, 2020-2035
  • Figure 106: Western Europe Market Value Share (%) and BPS Analysis by Tumor Grade, 2025-2035
  • Figure 107: Western Europe Market Y-o-Y Growth (%) Projections by Tumor Grade, 2025-2035
  • Figure 108: Western Europe Market Value (USD Million) Analysis by Cancer Type, 2020-2035
  • Figure 109: Western Europe Market Volume (Units) Analysis by Cancer Type, 2020-2035
  • Figure 110: Western Europe Market Value Share (%) and BPS Analysis by Cancer Type, 2025-2035
  • Figure 111: Western Europe Market Y-o-Y Growth (%) Projections by Cancer Type, 2025-2035
  • Figure 112: Western Europe Market Value (USD Million) Analysis by End User, 2020-2035
  • Figure 113: Western Europe Market Volume (Units) Analysis by End User, 2020-2035
  • Figure 114: Western Europe Market Value Share (%) and BPS Analysis by End User, 2025-2035
  • Figure 115: Western Europe Market Y-o-Y Growth (%) Projections by End User, 2025-2035
  • Figure 116: Western Europe Market Attractiveness by Tools, 2025-2035
  • Figure 117: Western Europe Market Attractiveness by Tumor Grade, 2025-2035
  • Figure 118: Western Europe Market Attractiveness by Cancer Type, 2025-2035
  • Figure 119: Western Europe Market Attractiveness by End User, 2025-2035
  • Figure 120: Western Europe Market Attractiveness by Country, 2025-2035
  • Figure 121: Eastern Europe Market Value (USD Million) by Tools, 2025-2035
  • Figure 122: Eastern Europe Market Value (USD Million) by Tumor Grade, 2025-2035
  • Figure 123: Eastern Europe Market Value (USD Million) by Cancer Type, 2025-2035
  • Figure 124: Eastern Europe Market Value (USD Million) by End User, 2025-2035
  • Figure 125: Eastern Europe Market Value (USD Million) by Country, 2025-2035
  • Figure 126: Eastern Europe Market Value (USD Million) Analysis by Country, 2020-2035
  • Figure 127: Eastern Europe Market Volume (Units) Analysis by Country, 2020-2035
  • Figure 128: Eastern Europe Market Value Share (%) and BPS Analysis by Country, 2025-2035
  • Figure 129: Eastern Europe Market Y-o-Y Growth (%) Projections by Country, 2025-2035
  • Figure 130: Eastern Europe Market Value (USD Million) Analysis by Tools, 2020-2035
  • Figure 131: Eastern Europe Market Volume (Units) Analysis by Tools, 2020-2035
  • Figure 132: Eastern Europe Market Value Share (%) and BPS Analysis by Tools, 2025-2035
  • Figure 133: Eastern Europe Market Y-o-Y Growth (%) Projections by Tools, 2025-2035
  • Figure 134: Eastern Europe Market Value (USD Million) Analysis by Tumor Grade, 2020-2035
  • Figure 135: Eastern Europe Market Volume (Units) Analysis by Tumor Grade, 2020-2035
  • Figure 136: Eastern Europe Market Value Share (%) and BPS Analysis by Tumor Grade, 2025-2035
  • Figure 137: Eastern Europe Market Y-o-Y Growth (%) Projections by Tumor Grade, 2025-2035
  • Figure 138: Eastern Europe Market Value (USD Million) Analysis by Cancer Type, 2020-2035
  • Figure 139: Eastern Europe Market Volume (Units) Analysis by Cancer Type, 2020-2035
  • Figure 140: Eastern Europe Market Value Share (%) and BPS Analysis by Cancer Type, 2025-2035
  • Figure 141: Eastern Europe Market Y-o-Y Growth (%) Projections by Cancer Type, 2025-2035
  • Figure 142: Eastern Europe Market Value (USD Million) Analysis by End User, 2020-2035
  • Figure 143: Eastern Europe Market Volume (Units) Analysis by End User, 2020-2035
  • Figure 144: Eastern Europe Market Value Share (%) and BPS Analysis by End User, 2025-2035
  • Figure 145: Eastern Europe Market Y-o-Y Growth (%) Projections by End User, 2025-2035
  • Figure 146: Eastern Europe Market Attractiveness by Tools, 2025-2035
  • Figure 147: Eastern Europe Market Attractiveness by Tumor Grade, 2025-2035
  • Figure 148: Eastern Europe Market Attractiveness by Cancer Type, 2025-2035
  • Figure 149: Eastern Europe Market Attractiveness by End User, 2025-2035
  • Figure 150: Eastern Europe Market Attractiveness by Country, 2025-2035
  • Figure 151: East Asia Market Value (USD Million) by Tools, 2025-2035
  • Figure 152: East Asia Market Value (USD Million) by Tumor Grade, 2025-2035
  • Figure 153: East Asia Market Value (USD Million) by Cancer Type, 2025-2035
  • Figure 154: East Asia Market Value (USD Million) by End User, 2025-2035
  • Figure 155: East Asia Market Value (USD Million) by Country, 2025-2035
  • Figure 156: East Asia Market Value (USD Million) Analysis by Country, 2020-2035
  • Figure 157: East Asia Market Volume (Units) Analysis by Country, 2020-2035
  • Figure 158: East Asia Market Value Share (%) and BPS Analysis by Country, 2025-2035
  • Figure 159: East Asia Market Y-o-Y Growth (%) Projections by Country, 2025-2035
  • Figure 160: East Asia Market Value (USD Million) Analysis by Tools, 2020-2035
  • Figure 161: East Asia Market Volume (Units) Analysis by Tools, 2020-2035
  • Figure 162: East Asia Market Value Share (%) and BPS Analysis by Tools, 2025-2035
  • Figure 163: East Asia Market Y-o-Y Growth (%) Projections by Tools, 2025-2035
  • Figure 164: East Asia Market Value (USD Million) Analysis by Tumor Grade, 2020-2035
  • Figure 165: East Asia Market Volume (Units) Analysis by Tumor Grade, 2020-2035
  • Figure 166: East Asia Market Value Share (%) and BPS Analysis by Tumor Grade, 2025-2035
  • Figure 167: East Asia Market Y-o-Y Growth (%) Projections by Tumor Grade, 2025-2035
  • Figure 168: East Asia Market Value (USD Million) Analysis by Cancer Type, 2020-2035
  • Figure 169: East Asia Market Volume (Units) Analysis by Cancer Type, 2020-2035
  • Figure 170: East Asia Market Value Share (%) and BPS Analysis by Cancer Type, 2025-2035
  • Figure 171: East Asia Market Y-o-Y Growth (%) Projections by Cancer Type, 2025-2035
  • Figure 172: East Asia Market Value (USD Million) Analysis by End User, 2020-2035
  • Figure 173: East Asia Market Volume (Units) Analysis by End User, 2020-2035
  • Figure 174: East Asia Market Value Share (%) and BPS Analysis by End User, 2025-2035
  • Figure 175: East Asia Market Y-o-Y Growth (%) Projections by End User, 2025-2035
  • Figure 176: East Asia Market Attractiveness by Tools, 2025-2035
  • Figure 177: East Asia Market Attractiveness by Tumor Grade, 2025-2035
  • Figure 178: East Asia Market Attractiveness by Cancer Type, 2025-2035
  • Figure 179: East Asia Market Attractiveness by End User, 2025-2035
  • Figure 180: East Asia Market Attractiveness by Country, 2025-2035
  • Figure 181: South Asia Market Value (USD Million) by Tools, 2025-2035
  • Figure 182: South Asia Market Value (USD Million) by Tumor Grade, 2025-2035
  • Figure 183: South Asia Market Value (USD Million) by Cancer Type, 2025-2035
  • Figure 184: South Asia Market Value (USD Million) by End User, 2025-2035
  • Figure 185: South Asia Market Value (USD Million) by Country, 2025-2035
  • Figure 186: South Asia Market Value (USD Million) Analysis by Country, 2020-2035
  • Figure 187: South Asia Market Volume (Units) Analysis by Country, 2020-2035
  • Figure 188: South Asia Market Value Share (%) and BPS Analysis by Country, 2025-2035
  • Figure 189: South Asia Market Y-o-Y Growth (%) Projections by Country, 2025-2035
  • Figure 190: South Asia Market Value (USD Million) Analysis by Tools, 2020-2035
  • Figure 191: South Asia Market Volume (Units) Analysis by Tools, 2020-2035
  • Figure 192: South Asia Market Value Share (%) and BPS Analysis by Tools, 2025-2035
  • Figure 193: South Asia Market Y-o-Y Growth (%) Projections by Tools, 2025-2035
  • Figure 194: South Asia Market Value (USD Million) Analysis by Tumor Grade, 2020-2035
  • Figure 195: South Asia Market Volume (Units) Analysis by Tumor Grade, 2020-2035
  • Figure 196: South Asia Market Value Share (%) and BPS Analysis by Tumor Grade, 2025-2035
  • Figure 197: South Asia Market Y-o-Y Growth (%) Projections by Tumor Grade, 2025-2035
  • Figure 198: South Asia Market Value (USD Million) Analysis by Cancer Type, 2020-2035
  • Figure 199: South Asia Market Volume (Units) Analysis by Cancer Type, 2020-2035
  • Figure 200: South Asia Market Value Share (%) and BPS Analysis by Cancer Type, 2025-2035
  • Figure 201: South Asia Market Y-o-Y Growth (%) Projections by Cancer Type, 2025-2035
  • Figure 202: South Asia Market Value (USD Million) Analysis by End User, 2020-2035
  • Figure 203: South Asia Market Volume (Units) Analysis by End User, 2020-2035
  • Figure 204: South Asia Market Value Share (%) and BPS Analysis by End User, 2025-2035
  • Figure 205: South Asia Market Y-o-Y Growth (%) Projections by End User, 2025-2035
  • Figure 206: South Asia Market Attractiveness by Tools, 2025-2035
  • Figure 207: South Asia Market Attractiveness by Tumor Grade, 2025-2035
  • Figure 208: South Asia Market Attractiveness by Cancer Type, 2025-2035
  • Figure 209: South Asia Market Attractiveness by End User, 2025-2035
  • Figure 210: South Asia Market Attractiveness by Country, 2025-2035
  • Figure 211: MEA Market Value (USD Million) by Tools, 2025-2035
  • Figure 212: MEA Market Value (USD Million) by Tumor Grade, 2025-2035
  • Figure 213: MEA Market Value (USD Million) by Cancer Type, 2025-2035
  • Figure 214: MEA Market Value (USD Million) by End User, 2025-2035
  • Figure 215: MEA Market Value (USD Million) by Country, 2025-2035
  • Figure 216: MEA Market Value (USD Million) Analysis by Country, 2020-2035
  • Figure 217: MEA Market Volume (Units) Analysis by Country, 2020-2035
  • Figure 218: MEA Market Value Share (%) and BPS Analysis by Country, 2025-2035
  • Figure 219: MEA Market Y-o-Y Growth (%) Projections by Country, 2025-2035
  • Figure 220: MEA Market Value (USD Million) Analysis by Tools, 2020-2035
  • Figure 221: MEA Market Volume (Units) Analysis by Tools, 2020-2035
  • Figure 222: MEA Market Value Share (%) and BPS Analysis by Tools, 2025-2035
  • Figure 223: MEA Market Y-o-Y Growth (%) Projections by Tools, 2025-2035
  • Figure 224: MEA Market Value (USD Million) Analysis by Tumor Grade, 2020-2035
  • Figure 225: MEA Market Volume (Units) Analysis by Tumor Grade, 2020-2035
  • Figure 226: MEA Market Value Share (%) and BPS Analysis by Tumor Grade, 2025-2035
  • Figure 227: MEA Market Y-o-Y Growth (%) Projections by Tumor Grade, 2025-2035
  • Figure 228: MEA Market Value (USD Million) Analysis by Cancer Type, 2020-2035
  • Figure 229: MEA Market Volume (Units) Analysis by Cancer Type, 2020-2035
  • Figure 230: MEA Market Value Share (%) and BPS Analysis by Cancer Type, 2025-2035
  • Figure 231: MEA Market Y-o-Y Growth (%) Projections by Cancer Type, 2025-2035
  • Figure 232: MEA Market Value (USD Million) Analysis by End User, 2020-2035
  • Figure 233: MEA Market Volume (Units) Analysis by End User, 2020-2035
  • Figure 234: MEA Market Value Share (%) and BPS Analysis by End User, 2025-2035
  • Figure 235: MEA Market Y-o-Y Growth (%) Projections by End User, 2025-2035
  • Figure 236: MEA Market Attractiveness by Tools, 2025-2035
  • Figure 237: MEA Market Attractiveness by Tumor Grade, 2025-2035
  • Figure 238: MEA Market Attractiveness by Cancer Type, 2025-2035
  • Figure 239: MEA Market Attractiveness by End User, 2025-2035
  • Figure 240: MEA Market Attractiveness by Country, 2025-2035

Frequently Asked Questions

How big is the breast cancer grading tools market in 2025?

The global breast cancer grading tools market is estimated to be valued at USD 463.3 million in 2025.

What will be the size of the breast cancer grading tools market in 2035?

The market size for breast cancer grading tools is projected to reach USD 937.26 million by 2035.

How much will the breast cancer grading tools market grow between 2025 and 2035?

The breast cancer grading tools market is expected to grow at a CAGR of 7.3% during this period.

What are the key tools in the breast cancer grading tools market?

Key tools include Nottingham Grading System, Bloom-Richardson Grading System, and Molecular Grading Tools.

Which Tumor Grade segment will contribute a significant share in the breast cancer grading tools market in 2025?

The Grade 2 segment is projected to command 42.7% of the market in 2025.

Explore Similar Insights

Future Market Insights

Breast Cancer Grading Tools Market

Chat With

MaRIA

Hi There, I am MaRIA, Your Market Research Intelligence Assistant. How may I help you?