Reports

- Global Locations -

Headquarters

Future Market Insights, Inc.

Christiana Corporate, 200
Continental Drive, Suite 401,
Newark, Delaware - 19713,
United States

T: +1-845-579-5705

Americas

Future Market Insights, Inc.

616 Corporate Way, Suite 2-9018,
Valley Cottage, NY 10989, United States

T: +1-347-918-3531

MEA

Future Market Insights

1602-6 Jumeirah Bay X2 Tower, Plot No: JLT-PH2-X2A,
Jumeirah Lakes Towers, Dubai,
United Arab Emirates

Europe

Future Market Insights

3rd Floor, 207 Regent Street,
W1B 3HH London
United Kingdom

T: + 44 (0) 20 8123 9659
D: +44 (0) 20 3287 4268

Asia Pacific

Future Market Insights

IndiaLand Global Tech Park, Unit UG-1, Behind Grand HighStreet, Phase 1, Hinjawadi, MH, Pune – 411057, India

Breast Lesion Localization Devices Market Outlook (2022 to 2032)

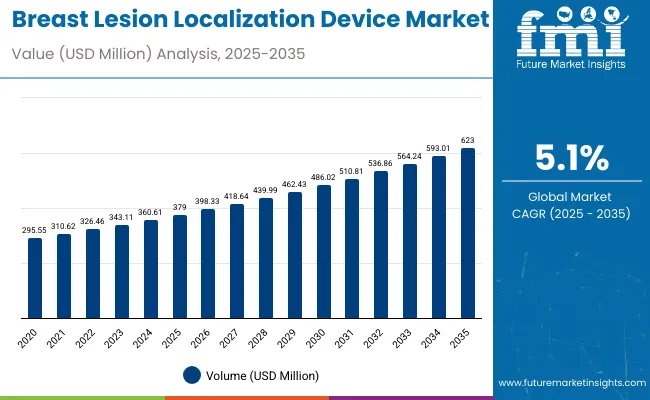
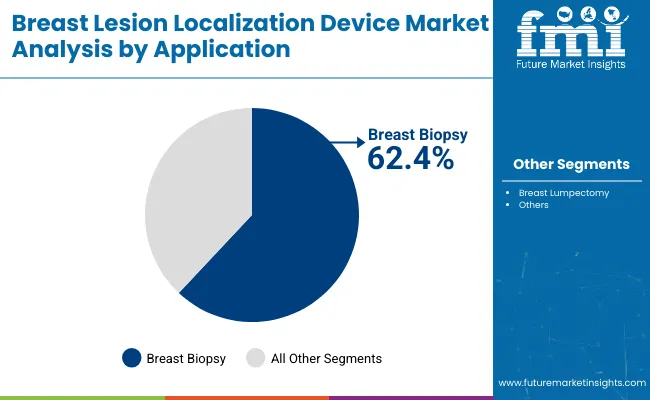
[349 Pages Report] The global demand for breast lesion localization devices market is set to grow by 5.5% from 2022 to 2032, with an estimated market value of around US$ 325.5 Million as of 2022. The breast biopsy segment accounted for the leading share of about 61.3% of the breast lesion localization devices market based on application in 2021.

Market Outlook:

Data Points Market Insights
Breast Lesion Localization Devices Market Value 2021 US$ 309.6 Million
Market Value 2022 US$ 325.5 Million
Market Value 2032 US$ 554.9 Million
CAGR 2022 to 2032 5.5%
Market Share of Top 5 Countries 52.4%

Lifestyle changes, which include behavioral factors, dietary preference, and physical activity, can worsen breast cancer. Women who are overweight have greater insulin levels in their blood. Some malignancies, especially breast cancer, have been associated with higher levels of insulin.

Drinking alcohol, obesity, use of birth control, menopausal hormone treatment, and breast implants are all lifestyle factors that can lead to breast cancer.

According to statistics presented by the American Cancer Society in 2020; alcohol intake proportionally increases the risk of breast cancer. Women who have one alcoholic drink per day have a minor (7-10%) increase in risk compared to those who do not, whereas those who have two to three drinks per day face a 20 percent increase in risk.

An advanced localization approach could make breast surgeries more precise, simpler, and more convenient for radiologists and surgeons. This is creating huge opportunities for players to come into this market and acquire market space with new technologies.

Don't pay for what you don't need

Customize your report by selecting specific countries or regions and save 30%!

Sales Analysis of Breast Lesion Localization Devices Market from 2017 to 2021 Vs Market Outlook for 2022 to 2032

The global market for breast lesion localization devices expanded at a CAGR of 4.7% over the last five years (2017 to 2021), as per Future Market Insights (FMI). The market value for breast lesion localization devices holds nearly 7.7% of the overall ~US$ 4 Billion breast cancer diagnostic market in 2021.

The growing prevalence of breast cancer will drive the demand for breast lesion localization devices in the near future. Breast cancer may spread to other areas of the body most common first detectable site of the spread is the lymph nodes under the arms, there is some lesion in lymph nodes that cannot be felt by touching.

Survival of breast cancer for at least 5 years after diagnosis is 40% in South Africa, 66% in India, and 90% in high-income countries. Early detection and treatment have proven successful in high-income countries in decreasing the risk associated with breast cancer.

Early cancer detection necessitates the use of suitable screening methods to examine the asymptomatic population, which has an average cancer risk, particularly for breast cancer. Increased understanding of cancer's early signs and symptoms among physicians and other healthcare professionals, as well as the general public, is very important. Improvements in healthcare policies in developing countries will boost market growth.

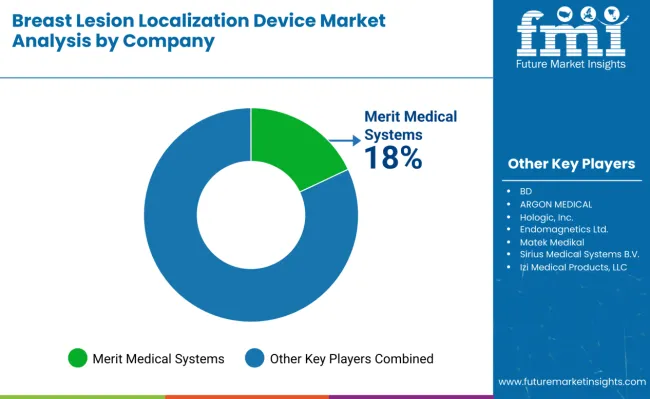
Breast Lesion Localization Device Market

Players in the breast lesion diagnostic market are focusing on collaborating with hospitals and ambulatory surgical centers for direct sales and maintenance of the equipment along with training personnel to increase awareness about new technology.

An increase in the funding for cancer research has driven many cancer research institutes and has led to substantial improvements in patient survival rates and dramatic improvements in the quality of life for patients with cancer.

For Instance, The Consolidated Appropriations Act of 2022 allocated US$6.9 billion to NCI, a US$353 million net increase over FY 2021.

The market is expected to expand at a significant rate over the next ten years at a CAGR growth value close to 5.5% and offers an absolute $ opportunity of US$ 17.2 Million.

The above-mentioned factors are primarily insightful concerning the global sales growth of the breast lesion localization devices market and are anticipated to persistently progress market growth over the forecasted period of 2022 to 2032.

What are the Key Opportunities for Breast Lesion Localization Devices Manufacturers?

Breast lesion localization devices are increasingly used in the detection and mapping of breast cancer. However, only a few players are actively engaged in the manufacturing of breast lesion localization devices to date, implying that there are significant opportunities for other small and large manufacturers to enter the market, as demand for the devices is rapidly increasing.

Breast cancer is the most common cancer in emerging nations and its incidence is surging rapidly among women in metropolitan regions. The importance of early detection in the management and treatment of this condition cannot be overstated. As a result, breast cancer awareness activities are organized to raise awareness and eliminate the stigma associated with breast cancer symptoms and treatment.

For instance, the International Federation of Medical Students' Associations has launched Breast Cancer Awareness Programmes (BCAP) to raise awareness among men and women about cancers of sexual organs.

The presence of a larger patient pool with cancer, along with increasing per capita income will provide lucrative opportunities for market penetration and growth within worldwide economies.

Sabyasachi Ghosh
Sabyasachi Ghosh

Principal Consultant

Talk to Analyst

Find your sweet spots for generating winning opportunities in this market.

What are the Factors Restraining Demand for Breast Lesion Localization Devices?

Factors restraining the demand for breast lesion localization devices include the high cost of devices and a dearth of trained professionals who can carry out critical and advanced processes for the detection of lesions.

Breast cancer surgeries such as breast lumpectomy, breast biopsy, and other procedures are high-cost operations. Due to the high cost of the devices, the cost of their high services, and devices inaccessible for most patients in most countries which is a major restraining factor for the market.

Breast lesion localization devices are the most advanced method of lesion detection. This method requires expertise on the part of the staff and trainees. Many hospitals and healthcare centers lack such skilled professionals to use these devices during diagnosis or surgeries. This is expected to hamper the adoption of these devices, which in turn restrain the market’s growth.

Country-wise Insights

What Makes the USA The Largest Market for Breast Lesion Localization Devices?

High Government Expenditure on Breast Cancer Research to Spur Growth

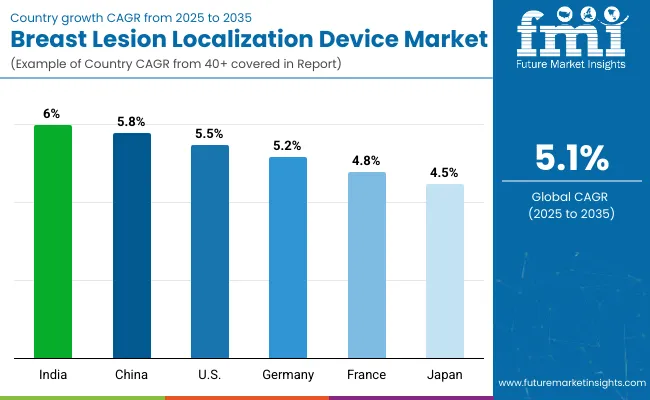
The USA leads North America with a market share of about 82.3% in 2021 and is estimated to show high growth throughout the forecast period. Improving government expenditures on breast cancer research, raising awareness of breast cancer early detection, easy FDA Approval, and increasing usage of devices in cancer centers in the USA is the major factor boosting the market growth in the region.

For instance, in May 2021, MOLLI Surgical Inc. got USA Food and Drug Administration clearance for MOLLI™, a new wire-free localization technology for breast cancer surgery.

Why is the UK Considered a Lucrative Market for Breast Lesion Localization Devices?

High Awareness About Personal Health and Wellness Among People Supporting Sales in the UK

UK is set to exhibit a CAGR of nearly 5.9% in the European breast lesion localization devices market during the forecast period. The population in the UK is more aware of personal health and not only diagnosis but also the screening rate for cancer is high in this region, so the growth rate of the breast lesion localization devices market is seen to be at an upsurge in the region.

UK’s large geriatric population and older adults are more likely to suffer from breast cancer than younger people due to weak immune responses and changing lifestyles. These factors drive the breast lesion localization market.

What Makes China an Emerging Market for Breast Lesion Localization Devices?

Rising Burden of Breast Cancer Patients Makes China a Leading Market

China is the fastest growing with a CAGR of 6.7% in the East Asia market during the forecast period. The rising burden of breast cancer patients in the country reflects its stronghold upon the breast lesion localization devices market.

As per the estimates reported by Statistics 2020, Nearly 416 thousand new breast cancer cases were diagnosed among the Chinese female population in 2020.

Get the data you need at a Fraction of the cost

Personalize your report by choosing insights you need
and save 40%!

Category-wise Insights  

Which Breast Lesion Localization Devices Technique Is Most Sought-after?

Cost-effectiveness of Wire Localization Makes it Sought-After Technique

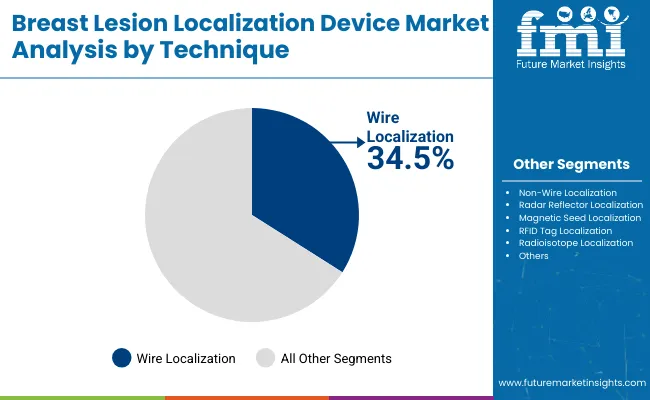
The wire localization segment held the dominant share of 41.9% in 2021, owing to its cost-effectiveness, and ease for surgeons and radiologists to use it while processing also wire localization devices have plenty of options that can easily be connected to radiology imaging devices with guided wire. These all factors are driving the demand for the breast localization devices market.

Which is the Chief Application of Breast Lesion Localization Devices?

Application in Breast Biopsy to Spur Sales Prospects

Breast biopsy demand is estimated to grow at a CAGR of 4.9% throughout the forecast period of 2022 to 2032. The segment accounted for 61.3% of overall sales in the market in 2021. The metrics are valued as per the patient flow for the breast biopsy and increasing awareness for early diagnosis of a breast lesion with biopsy. This makes the biopsy segment grow with great market space.

Who Is the Leading End User In Breast Lesion Localization Devices Market?

Demand from Hospitals to Continue Supporting Growth

Hospitals as end users lead the breast lesion localization devices market with about 42.3% market share in 2021. Hospitals have a huge amount of footfall for diagnosis and surgeries of breast cancer also companies are focusing on unique strategies of training surgeons and radiologists in hospitals for more patient reach this is gaining traction.

Competitive Landscape

Key players are focused on the development and launch of novel detection devices for breast cancers. Established players within the industry are targeting specific female groups and going after strategic mergers and acquisitions to strengthen their position in the cancer devices market.

  • In Jan 2020, Merit Medical Systems launched The TEMNO Elite Biopsy System, offering reliability with new features designed to provide superior soft tissue samples and total procedure control. An added patient-safety option minimizes the risk of complications, particularly during lung biopsies.
  • In Dec 2021, BD (Becton, Dickinson, and Company), a leading global medical technology company, announced today it has acquired Tissuemed, Ltd., a privately held firm headquartered in Leeds, England

Similarly, recent developments related to companies manufacturing breast lesion localization device techniques have been tracked by the team at Future Market Insights, which are available in the full report.

Report Scope as per Breast lesion localization devices Industry Analysis

Attribute Details
Forecast Period 2022 to 2032
Historical Data Available for 2017 to 2021
Market Analysis US$ Million for Value and Volume in Units
Key Regions Covered North America, Latin America, Europe, South Asia, East Asia, Oceania, and Middle East & Africa
Key Countries Covered USA, Canada, Brazil, Mexico, Argentina, Germany, UK, France, Italy, Spain, Russia, BENELUX, Nordic countries and Russia, China, Japan, South Korea, India, Thailand, Indonesia, Malaysia, Australia, New Zealand, GCC Countries, Turkey, and South Africa
Key Market Segments Covered Technique, Application, End User, and Region
Key Companies Profiled
  • Merit Medical Systems
  • BD
  • ARGON MEDICAL
  • Hologic, Inc.
  • Endomagnetics Ltd.
  • MatekMedikal
  • Sirius Medical Systems B.V.
  • Izi Medical Products, LLC
  • Molli Surgical Inc
  • Elucent Medical
  • Intramedical Imaging
  • Isoaid
  • Vigeosrl
  • Medax Medical Devices
  • MDL SRL
  • BPB Medica
  • Sterylab S.R.L.
  • Tsunami Medical Srl
  • Laurane® Medical LLC
  • Biomedical Srl
Pricing Available upon Request

Key Market Segments Covered in Breast Lesion Localization Devices Industry Research

By Technique:

  • Wire Localization
  • Non-Wire Localization
  • Radar Reflector Localization
  • Magnetic seed Localization
  • RFID Tag Localization
  • Radioisotope Localization

By Application:

  • Breast Biopsy
  • Breast Lumpectomy

By End User:

  • Hospitals
  • Ambulatory Surgical Centres
  • Specialty Clinics

By Region:

  • North America
  • Latin America
  • Europe
  • South Asia
  • East Asia
  • Oceania
  • Middle East and Africa (MEA)

Frequently Asked Questions

How much is the breast lesion localization devices market currently worth?

The global Breast lesion localization devices market is worth US$ 309.6 Million at present (2021) and is set to expand 1.7X over the next ten years.

What is the sales forecast for breast lesion localization devices through 2032?

The Breast lesion localization devices market is expected to reach US$ 554.9 Million by the end of 2032, with sales revenue expected to register a 5.5% CAGR.

What are the key trends shaping the breast lesion localization devices industry?

The shift from invasive to minimally-invasive surgical procedures, acquisitions and collaborations by key players, growing approval for the devices and the addition of innovative techniques in the portfolio through partnerships are some of the key trends being witnessed in this marketplace.

Which are the top 5 countries driving demand for breast lesion localization devices?

The USA, UK, India, Germany and Japan are expected to drive demand for breast lesion localization devices.

What is the North America breast lesion localization devices market outlook?

North America is one of the key markets for breast lesion localization devices, with the USA expected to account for over 82.3% of the North American market in 2021.

At what percentage will the demand for breast lesion localization devices grow in Europe?

Demand for breast lesion localization devices in Europe is expected to register a growth of 5.7%over the next ten years.

Who are the key producers of breast lesion localization devices?

The USA, UK and Germany are the key producers of breast lesion localization devices.

Who are the key exporters in the breast lesion localization devices market?

Merit Medical Systems, BD, ARGON MEDICAL, Hologic, Inc., Endomagnetics Ltd. are the key exporters of the breast lesion localization devices market.

Table of Content

1. Executive Summary | Breast Lesion Localization Device Market

    1.1. Global Market Outlook

    1.2. Demand Side Trends

    1.3. Supply Side Trends

    1.4. Analysis and Recommendations

2. Market Overview

    2.1. Market Coverage / Taxonomy

    2.2. Market Definition / Scope / Limitations

    2.3. Inclusions and Exclusions

3. Key Market Trends

    3.1. Key Trends Impacting the Market

    3.2. Product Innovation / Development Trends

4. Key Success Factors

    4.1. Product USPs

    4.2. Recent product approval and launches

    4.3. Key Promotional Strategies by Market Players

    4.4. Product Adoption/ Usage Analysis by Region

    4.5. Regulatory Scenario

    4.6. Reimbursement Scenario

    4.7. Disease Epidemiology

    4.8. PESTEL Analysis

    4.9. Portal Analysis

5. Market Background

    5.1. Macro-Economic Factors

        5.1.1. Global GDP Growth Outlook

        5.1.2. Global Healthcare Expenditure

        5.1.3. Aging Population

        5.1.4. Infrastructure Investment

    5.2. Forecast Factors - Relevance & Impact

        5.2.1. Rising Cancer Awareness

        5.2.2. Rising prevalence of Breast cancer

        5.2.3. Growing Investment in healthcare expenditure

        5.2.4. Product Innovation and Development

        5.2.5. Cost Impact

        5.2.6. Rising Demand in Emerging Economies

        5.2.7. Strategic Mergers and Acquisitions Among Local

    5.3. Value Chain

        5.3.1. Raw Technique Suppliers

        5.3.2. Product Manufacturers

        5.3.3. End Users

    5.4. Market Dynamics

        5.4.1. Drivers

        5.4.2. Restraints

        5.4.3. Opportunity Analysis

6. COVID19 Crisis Analysis

    6.1. Current COVID-19 Statistics and Probable Future Impact

    6.2. Current GDP Projection and Probable Impact

    6.3. COVID-19 and Impact Analysis

    6.4. 2021 Market Scenario

    6.5. Recovery Scenario - Short-term, Midterm, and Long-Term Impact

7. Global Market - Pricing Analysis

    7.1. Regional Pricing Analysis By Technique

    7.2. Global Average Pricing Analysis Benchmark

8. Global Market Demand (in Volume or Size in Unit) Analysis 2017 to 2021 and Forecast, 2022 to 2032

    8.1. Historical Market Volume (Unit) Analysis, 2017 to 2021

    8.2. Current and Future Market Volume (Unit) Projections, 2022 to 2032

        8.2.1. Y-o-Y Growth Trend Analysis

9. Global Market Demand (in Value or Size in US$ Million) Analysis 2017 to 2021 and Forecast, 2022 to 2032

    9.1. Historical Market Value (US$ Million) Analysis, 2017 to 2021

    9.2. Current and Future Market Value (US$ Million) Projections, 2022 to 2032

        9.2.1. Y-o-Y Growth Trend Analysis

        9.2.2. Absolute $ Opportunity Analysis

10. Global Market Analysis 2017 to 2021 and Forecast 2022 to 2032, By Technique 

    10.1. Introduction / Key Findings

    10.2. Historical Market Size (US$ Million) Analysis By Technique, 2017 to 2021

    10.3. Current and Future Market Size (US$ Million) Analysis and Forecast By Technique, 2022 to 2032

            10.3.1.1. Wire Localization

            10.3.1.2. Non-Wires Localization

            10.3.1.3. Radar Reflector Localization

            10.3.1.4. Magnetic Seed Localization

            10.3.1.5. RFID Tag Localization

            10.3.1.6. Radioisotope Localization

    10.4. Market Attractiveness Analysis By Technique

11. Global Market Analysis 2017 to 2021 and Forecast 2022 to 2032, By Application

    11.1. Introduction / Key Findings

    11.2. Historical Market Size (US$ Million) Analysis, By Application, 2017 to 2021

    11.3. Current and Future Market Size (US$ Million) Analysis and Forecast By Application, 2022 to 2032

        11.3.1. Breast Biopsy

        11.3.2. Breast Lumpectomy

    11.4. Market Attractiveness Analysis By Application

12. Global Market Analysis 2017 to 2021 and Forecast 2022 to 2032, By End User 

    12.1. Introduction / Key Findings

    12.2. Historical Market Size (US$ Million) Analysis, By End User, 2017 to 2021

    12.3. Current and Future Market Size (US$ Million) Analysis Forecast By End User, 2022 to 2032

        12.3.1. Specialty Clinics

        12.3.2. Hospitals

        12.3.3. Ambulatory Surgical Centers

    12.4. Market Attractiveness Analysis By End User

13. Global Market Analysis 2017 to 2021 and Forecast 2022 to 2032, by Region

    13.1. Introduction

    13.2. Historical Market Size (US$ Million) Analysis By Region, 2017 to 2021

    13.3. Current Market Size (US$ Million) Analysis and Forecast By Region, 2022 to 2032

        13.3.1. North America

        13.3.2. Latin America

        13.3.3. Europe

        13.3.4. East Asia

        13.3.5. South Asia

        13.3.6. Oceania

        13.3.7. Middle East and Africa (MEA)

    13.4. Market Attractiveness Analysis By Region

14. North America Market Analysis 2017 to 2021 and Forecast 2022 to 2032

    14.1. Introduction

    14.2. Pricing Analysis

    14.3. Historical Market Size (US$ Million) Analysis Trend Analysis By Market Taxonomy, 2017 to 2021

    14.4. Market Size (US$ Million) Analysis Forecast By Market Taxonomy, 2022 to 2032

        14.4.1. By Country

            14.4.1.1. United States of America

            14.4.1.2. Canada

        14.4.2. By Technique

        14.4.3. By Application

        14.4.4. By End User

    14.5. Market Attractiveness Analysis

        14.5.1. By Country

        14.5.2. By Technique

        14.5.3. By Application

        14.5.4. By End User

    14.6. Market Trends

    14.7. Key Market Participants - Intensity Mapping

    14.8. Drivers and Restraints - Impact Analysis

    14.9. Country-Level Analysis & Forecast

        14.9.1. USA Market Analysis

            14.9.1.1. .Introduction

            14.9.1.2. Market Analysis and Forecast by Market Taxonomy

                14.9.1.2.1. By Technique

                14.9.1.2.2. By Application

                14.9.1.2.3. By End User

        14.9.2. Canada Market Analysis

            14.9.2.1. Introduction

            14.9.2.2. Market Analysis and Forecast by Market Taxonomy

                14.9.2.2.1. By Technique

                14.9.2.2.2. By Application

                14.9.2.2.3. By End User

15. Latin America Market Analysis 2017 to 2021 and Forecast 2022 to 2032

    15.1. Introduction

    15.2. Pricing Analysis

    15.3. Historical Market Size (US$ Million) Analysis Trend Analysis By Market Taxonomy, 2017 to 2021

    15.4. Market Size (US$ Million) Analysis Forecast By Market Taxonomy, 2022 to 2032

        15.4.1. By Country

            15.4.1.1. Mexico

            15.4.1.2. Brazil

            15.4.1.3. Argentina

            15.4.1.4. Rest of Latin America

        15.4.2. By Technique

        15.4.3. By Application

        15.4.4. By End User

    15.5. Market Attractiveness Analysis

        15.5.1. By Country

        15.5.2. By Technique

        15.5.3. By Application

        15.5.4. By End User

    15.6. Market Trends

    15.7. Key Market Participants - Intensity Mapping

    15.8. Drivers and Restraints - Impact Analysis

    15.9. Country-Level Analysis & Forecast

        15.9.1. Mexico Market Analysis

            15.9.1.1. Introduction

            15.9.1.2. Market Analysis and Forecast by Market Taxonomy

                15.9.1.2.1. By Technique

                15.9.1.2.2. By Application

        15.9.2. Brazil Market Analysis

            15.9.2.1. Introduction

            15.9.2.2. Market Analysis and Forecast by Market Taxonomy

                15.9.2.2.1. By Technique

                15.9.2.2.2. By Application

                15.9.2.2.3. By End User

        15.9.3. Argentina Market Analysis

            15.9.3.1. Introduction

            15.9.3.2. Market Analysis and Forecast by Market Taxonomy

                15.9.3.2.1. By Technique

                15.9.3.2.2. By Application

                15.9.3.2.3. By End User

16. Europe Market Analysis 2017 to 2021 and Forecast 2022 to 2032

    16.1. Introduction

    16.2. Pricing Analysis

    16.3. Historical Market Size (US$ Million) Analysis Trend Analysis By Market Taxonomy, 2017 to 2021

    16.4. Market Size (US$ Million) Analysis Forecast By Market Taxonomy, 2022 to 2032

        16.4.1. By Country

            16.4.1.1. Germany

            16.4.1.2. Italy

            16.4.1.3. France

            16.4.1.4. United Kingdom

            16.4.1.5. Spain

            16.4.1.6. BENELUX

            16.4.1.7. Nordic Countries & Russia

            16.4.1.8. Rest of Europe

        16.4.2. By Technique

        16.4.3. By Application

        16.4.4. By End User

    16.5. Market Attractiveness Analysis

        16.5.1. By Country

        16.5.2. By Technique

        16.5.3. By Material

        16.5.4. By End User

    16.6. Market Trends

    16.7. Key Market Participants - Intensity Mapping

    16.8. Drivers and Restraints - Impact Analysis

    16.9. Country-Level Analysis & Forecast

        16.9.1. Germany Market Analysis

            16.9.1.1. Introduction

            16.9.1.2. Market Analysis and Forecast by Market Taxonomy

                16.9.1.2.1. By Technique

                16.9.1.2.2. By Application

                16.9.1.2.3. By End User

        16.9.2. Italy Market Analysis

            16.9.2.1. Introduction

            16.9.2.2. Market Analysis and Forecast by Market Taxonomy

                16.9.2.2.1. By Technique

                16.9.2.2.2. By Application

                16.9.2.2.3. By End User

        16.9.3. France Market Analysis

            16.9.3.1. Introduction

            16.9.3.2. Market Analysis and Forecast by Market Taxonomy

                16.9.3.2.1. By Technique

                16.9.3.2.2. By Application

                16.9.3.2.3. By End User

        16.9.4. UK Market Analysis

            16.9.4.1. Introduction

            16.9.4.2. Market Analysis and Forecast by Market Taxonomy

                16.9.4.2.1. By Technique

                16.9.4.2.2. By Application

                16.9.4.2.3. By End User

        16.9.5. Spain Market Analysis

            16.9.5.1. Introduction

            16.9.5.2. Market Analysis and Forecast by Market Taxonomy

                16.9.5.2.1. By Technique

                16.9.5.2.2. By Application

                16.9.5.2.3. By End User

        16.9.6. BENELUX Market Analysis

            16.9.6.1. Introduction

            16.9.6.2. Market Analysis and Forecast by Market Taxonomy

                16.9.6.2.1. By Technique

                16.9.6.2.2. By Application

                16.9.6.2.3. By End User

        16.9.7. Nordic Countries & Russia Market Analysis

            16.9.7.1. Introduction

            16.9.7.2. Market Analysis and Forecast by Market Taxonomy

                16.9.7.2.1. By Technique

                16.9.7.2.2. By Application

                16.9.7.2.3. By End User

17. East Asia Market Analysis 2017 to 2021 and Forecast 2022 to 2032

    17.1. Introduction

    17.2. Pricing Analysis

    17.3. Historical Market Size (US$ Million) Analysis Trend Analysis By Market Taxonomy, 2017 to 2021

    17.4. Market Size (US$ Million) Analysis Forecast By Market Taxonomy, 2022 to 2032

        17.4.1. By Country

            17.4.1.1. China

            17.4.1.2. Japan

            17.4.1.3. South Korea

        17.4.2. By Technique

        17.4.3. By Application

        17.4.4. By End User

    17.5. Market Attractiveness Analysis

        17.5.1. By Country

        17.5.2. By Technique

        17.5.3. By Application

        17.5.4. By End User

    17.6. Market Trends

    17.7. Key Market Participants - Intensity Mapping

    17.8. Drivers and Restraints - Impact Analysis

    17.9. Country-Level Analysis & Forecast

        17.9.1. China Market Analysis

            17.9.1.1. Introduction

            17.9.1.2. Market Analysis and Forecast by Market Taxonomy

                17.9.1.2.1. By Technique

                17.9.1.2.2. By Application

                17.9.1.2.3. By End User

        17.9.2. Japan Market Analysis

            17.9.2.1. Introduction

            17.9.2.2. Market Analysis and Forecast by Market Taxonomy

                17.9.2.2.1. By Technique

                17.9.2.2.2. By Application

                17.9.2.2.3. By End User

        17.9.3. South Korea Market Analysis

            17.9.3.1. Introduction

            17.9.3.2. Market Analysis and Forecast by Market Taxonomy

                17.9.3.2.1. By Technique

                17.9.3.2.2. By Application

                17.9.3.2.3. By Application

                17.9.3.2.4. By End User

18. South Asia Market Analysis 2017 to 2021 and Forecast 2022 to 2032

    18.1. Introduction

    18.2. Pricing Analysis

    18.3. Historical Market Size (US$ Million) Analysis Trend Analysis By Market Taxonomy, 2017 to 2021

    18.4. Market Size (US$ Million) Analysis Forecast By Market Taxonomy, 2022 to 2032

        18.4.1. By Country

            18.4.1.1. India

            18.4.1.2. Indonesia

            18.4.1.3. Malaysia

            18.4.1.4. Thailand

            18.4.1.5. Rest of South Asia

        18.4.2. By Technique

        18.4.3. By Application

        18.4.4. By End User

    18.5. Market Attractiveness Analysis

        18.5.1. By Country

        18.5.2. By Technique

        18.5.3. By Application

        18.5.4. By End User

    18.6. Market Trends

    18.7. Key Market Participants - Intensity Mapping

    18.8. Drivers and Restraints - Impact Analysis

    18.9. Country-Level Analysis & Forecast

        18.9.1. India Market Analysis

            18.9.1.1. Introduction

            18.9.1.2. Market Analysis and Forecast by Market Taxonomy

                18.9.1.2.1. By Technique

                18.9.1.2.2. By Application

                18.9.1.2.3. By End User

        18.9.2. Indonesia Market Analysis

            18.9.2.1. Introduction

            18.9.2.2. Market Analysis and Forecast by Market Taxonomy

                18.9.2.2.1. By Technique

                18.9.2.2.2. By Application

                18.9.2.2.3. By End User

        18.9.3. Malaysia Market Analysis

            18.9.3.1. Introduction

            18.9.3.2. Market Analysis and Forecast by Market Taxonomy

                18.9.3.2.1. By Technique

                18.9.3.2.2. By Application

                18.9.3.2.3. By End User

        18.9.4. Thailand Market Analysis

            18.9.4.1. Introduction

            18.9.4.2. Market Analysis and Forecast by Market Taxonomy

                18.9.4.2.1. By Technique

                18.9.4.2.2. By Application

                18.9.4.2.3. By End User

        18.9.5. Rest of South Asia Market Analysis

            18.9.5.1. Introduction

            18.9.5.2. Market Analysis and Forecast by Market Taxonomy

                18.9.5.2.1. By Technique

                18.9.5.2.2. By Application

                18.9.5.2.3. By End User

19. Oceania Market 2017 to 2021 and Forecast 2022 to 2032

    19.1. Introduction

    19.2. Pricing Analysis

    19.3. Historical Market Size (US$ Million) Analysis Trend Analysis By Market Taxonomy, 2017 to 2021

    19.4. Market Size (US$ Million) Analysis Forecast By Market Taxonomy, 2022 to 2032

        19.4.1. By Country

            19.4.1.1. Australia

            19.4.1.2. New Zealand

        19.4.2. By Technique

        19.4.3. By Application

        19.4.4. By End User

    19.5. Market Attractiveness Analysis

        19.5.1. By Country

        19.5.2. By Technique

        19.5.3. By Application

        19.5.4. By End User

    19.6. Key Market Participants - Intensity Mapping

    19.7. Drivers and Restraints - Impact Analysis

    19.8. Country-Level Analysis & Forecast

        19.8.1. Australia Market Analysis

            19.8.1.1. Introduction

            19.8.1.2. Market Analysis and Forecast by Market Taxonomy

                19.8.1.2.1. By Technique

                19.8.1.2.2. By Application

                19.8.1.2.3. By End User

        19.8.2. New Zealand Market Analysis

            19.8.2.1. Introduction

            19.8.2.2. Market Analysis and Forecast by Market Taxonomy

                19.8.2.2.1. By Technique

                19.8.2.2.2. By Application

                19.8.2.2.3. By End User

20. Middle East and Africa (MEA) Market Analysis 2017 to 2021 and Forecast 2022 to 2032

    20.1. Introduction

    20.2. Pricing Analysis

    20.3. Historical Market Size (US$ Million) Analysis Trend Analysis By Market Taxonomy, 2017 to 2021

    20.4. Market Size (US$ Million) Analysis Forecast By Market Taxonomy, 2022 to 2032

        20.4.1. By Country

            20.4.1.1. GCC Countries

            20.4.1.2. Turkey

            20.4.1.3. South Africa

            20.4.1.4. Rest of Middle East and Africa

        20.4.2. By Technique

        20.4.3. By Application

        20.4.4. By End User

    20.5. Market Attractiveness Analysis

        20.5.1. By Country

        20.5.2. By Technique

        20.5.3. By Application

        20.5.4. By End User

    20.6. Market Trends

    20.7. Key Market Participants - Intensity Mapping

    20.8. Drivers and Restraints - Impact Analysis

    20.9. Country-Level Analysis & Forecast

        20.9.1. GCC Countries Market Analysis

            20.9.1.1. Introduction

            20.9.1.2. Market Analysis and Forecast by Market Taxonomy

                20.9.1.2.1. By Technique

                20.9.1.2.2. By Application

                20.9.1.2.3. By End User

        20.9.2. Turkey Market Analysis

            20.9.2.1. Introduction

            20.9.2.2. Market Analysis and Forecast by Market Taxonomy

                20.9.2.2.1. By Technique

                20.9.2.2.2. By Application

                20.9.2.2.3. By End User

        20.9.3. South Africa Market Analysis

            20.9.3.1. Introduction

            20.9.3.2. Market Analysis and Forecast by Market Taxonomy

                20.9.3.2.1. By Technique

                20.9.3.2.2. By Application

                20.9.3.2.3. By End User

        20.9.4. Rest of MEA Market Analysis

            20.9.4.1. Introduction

            20.9.4.2. Market Analysis and Forecast by Market Taxonomy

                20.9.4.2.1. By Technique

                20.9.4.2.2. By Application

                20.9.4.2.3. By End User

21. Market Structure Analysis

    21.1. Market Analysis by Tier of Companies

    21.2. Market Share Analysis of Top Players

    21.3. Market Presence Analysis

22. Competition Analysis

    22.1. Competition Dashboard

    22.2. Competition Benchmarking

    22.3. Competition Deep Dive

        22.3.1. Hologic, Inc.

            22.3.1.1. Overview

            22.3.1.2. Product Portfolio

            22.3.1.3. Profitability by Market Segments (Product/Channel/Region)

            22.3.1.4. Sales Footprint

            22.3.1.5. Strategy Overview

        22.3.2. Becton, Dickinson, and Company

            22.3.2.1. Overview

            22.3.2.2. Product Portfolio

            22.3.2.3. Profitability by Market Segments (Product/Channel/Region)

            22.3.2.4. Sales Footprint

            22.3.2.5. Strategy Overview

        22.3.3. Merit Medical Systems

            22.3.3.1. Overview

            22.3.3.2. Product Portfolio

            22.3.3.3. Profitability by Market Segments (Product/Channel/Region)

            22.3.3.4. Sales Footprint

            22.3.3.5. Strategy Overview

        22.3.4. Laurane Medical LLC

            22.3.4.1. Overview

            22.3.4.2. Product Portfolio

            22.3.4.3. Profitability by Market Segments (Product/Channel/Region)

            22.3.4.4. Sales Footprint

            22.3.4.5. Strategy Overview

        22.3.5. Intramedical Imaging,

            22.3.5.1. Overview

            22.3.5.2. Product Portfolio

            22.3.5.3. Profitability by Market Segments (Product/Channel/Region)

            22.3.5.4. Sales Footprint

            22.3.5.5. Strategy Overview

        22.3.6. Mermaid Medical Group

            22.3.6.1. Overview

            22.3.6.2. Product Portfolio

            22.3.6.3. Profitability by Market Segments (Product/Channel/Region)

            22.3.6.4. Sales Footprint

            22.3.6.5. Strategy Overview

        22.3.7. Izi Medical Products, LLC

            22.3.7.1. Overview

            22.3.7.2. Product Portfolio

            22.3.7.3. Profitability by Market Segments (Product/Channel/Region)

            22.3.7.4. Sales Footprint

            22.3.7.5. Strategy Overview

        22.3.8. MatekMedikal

            22.3.8.1. Overview

            22.3.8.2. Product Portfolio

            22.3.8.3. Profitability by Market Segments (Product/Channel/Region)

            22.3.8.4. Sales Footprint

            22.3.8.5. Strategy Overview

        22.3.9. Tsunami Medical Srl

            22.3.9.1. Overview

            22.3.9.2. Product Portfolio

            22.3.9.3. Profitability by Market Segments (Product/Channel/Region)

            22.3.9.4. Sales Footprint

            22.3.9.5. Strategy Overview

        22.3.10. BPB Medica

            22.3.10.1. Overview

            22.3.10.2. Product Portfolio

            22.3.10.3. Profitability by Market Segments (Product/Channel/Region)

            22.3.10.4. Sales Footprint

            22.3.10.5. Strategy Overview

        22.3.11. Sirius Medical Systems B.V.

            22.3.11.1. Overview

            22.3.11.2. Product Portfolio

            22.3.11.3. Profitability by Market Segments (Product/Channel/Region)

            22.3.11.4. Sales Footprint

            22.3.11.5. Strategy Overview

        22.3.12. Molli Surgical Inc

            22.3.12.1. Overview

            22.3.12.2. Product Portfolio

            22.3.12.3. Profitability by Market Segments (Product/Channel/Region)

            22.3.12.4. Sales Footprint

            22.3.12.5. Strategy Overview

        22.3.13. Sterylab S.R.L.

            22.3.13.1. Overview

            22.3.13.2. Product Portfolio

            22.3.13.3. Profitability by Market Segments (Product/Channel/Region)

            22.3.13.4. Sales Footprint

            22.3.13.5. Strategy Overview

        22.3.14. MDL SRL

            22.3.14.1. Overview

            22.3.14.2. Product Portfolio

            22.3.14.3. Profitability by Market Segments (Product/Channel/Region)

            22.3.14.4. Sales Footprint

            22.3.14.5. Strategy Overview

        22.3.15. Biomedical Srl

            22.3.15.1. Overview

            22.3.15.2. Product Portfolio

            22.3.15.3. Profitability by Market Segments (Product/Channel/Region)

            22.3.15.4. Sales Footprint

            22.3.15.5. Strategy Overview

        22.3.16. Elucent Medical

            22.3.16.1. Overview

            22.3.16.2. Product Portfolio

            22.3.16.3. Profitability by Market Segments (Product/Channel/Region)

            22.3.16.4. Sales Footprint

            22.3.16.5. Strategy Overview

        22.3.17. Vigeosrl

            22.3.17.1. Overview

            22.3.17.2. Product Portfolio

            22.3.17.3. Profitability by Market Segments (Product/Channel/Region)

            22.3.17.4. Sales Footprint

            22.3.17.5. Strategy Overview

        22.3.18. Medax Medical Devices

            22.3.18.1. Overview

            22.3.18.2. Product Portfolio

            22.3.18.3. Profitability by Market Segments (Product/Channel/Region)

            22.3.18.4. Sales Footprint

            22.3.18.5. Strategy Overview

        22.3.19. Isoaid

            22.3.19.1. Overview

            22.3.19.2. Product Portfolio

            22.3.19.3. Profitability by Market Segments (Product/Channel/Region)

            22.3.19.4. Sales Footprint

            22.3.19.5. Strategy Overview

        22.3.20. Tsunami Medical Srl

            22.3.20.1. Overview

            22.3.20.2. Product Portfolio

            22.3.20.3. Profitability by Market Segments (Product/Channel/Region)

            22.3.20.4. Sales Footprint

            22.3.20.5. Strategy Overview

23. Assumptions and Acronyms Used

24. Research Methodology

Don't pay for what you don't need

Customize your report by selecting specific countries or regions and save 30%!

List of Tables

Table 01: Global Market Volume (Units) Analysis and Opportunity Assessment 2017 to 2032, By Technique

Table 02: Global Market Volume (US$ Million) Analysis 2017 to 2021 and Forecast 2022 to 2032, By Technique

Table 03: Global Market Size (US$ Million) Analysis 2017 to 2021 and Forecast 2022 to 2032, By Technique

Table 04: Global Market Size (US$ Million) Analysis 2017 to 2021 and Forecast 2022 to 2032, By Application

Table 05: Global Market Size (US$ Million) Analysis 2017 to 2021 and Forecast 2022 to 2032, By End User

Table 06: Global Market Value (US$ Million) Analysis- and Opportunity Assessment 2017 to 2032, By Region

Table 07: North America Market Size (US$ Million) Analysis 2017 to 2021 and Forecast 2022 to 2032, By Country

Table 08: North America Market Volume (US$ Million) Analysis 2017 to 2021 and Forecast 2022 to 2032, By Technique

Table 09: North America Market Size (US$ Million) Analysis 2017 to 2021 and Forecast 2022 to 2032, By Technique

Table 10: North America Market Size (US$ Million) Analysis 2017 to 2021 and Forecast 2022 to 2032, By Application

Table 11: North America Market Size (US$ Million) Analysis 2017 to 2021 and Forecast 2022 to 2032, By End User

Table 12: Latin America Market Size (US$ Million) Analysis 2017 to 2021 and Forecast 2022 to 2032, By Country

Table 13: Latin America Market Volume (US$ Million) Analysis 2017 to 2021 and Forecast 2022 to 2032, By Technique

Table 14: Latin America Market Size (US$ Million) Analysis 2017 to 2021 and Forecast 2022 to 2032, By Technique

Table 15: Latin America Market Size (US$ Million) Analysis 2017 to 2021 and Forecast 2022 to 2032, By Application

Table 16: Latin America Market Size (US$ Million) Analysis 2017 to 2021 and Forecast 2022 to 2032, By End User

Table 17: Europe Market Size (US$ Million) Analysis 2017 to 2021 and Forecast 2022 to 2032, By Country

Table 18: Europe Market Volume (Units) Analysis 2017 to 2021 and Forecast 2022 to 2032, By Technique

Table 19: Europe Market Size (US$ Million) Analysis 2017 to 2021 and Forecast 2022 to 2032, By Technique

Table 20: Europe Market Size (US$ Million) Analysis 2017 to 2021 and Forecast 2022 to 2032, By Application

Table 21: Europe Market Size (US$ Million) Analysis 2017 to 2021 and Forecast 2022 to 2032, By End User

Table 22: South Asia Market Size (US$ Million) Analysis 2017 to 2021 and Forecast 2022 to 2032, By Country

Table 23: South Asia Market Volume (US$ Million) Analysis 2017 to 2021 and Forecast 2022 to 2032, By Technique

Table 24: South Asia Market Size (US$ Million) Analysis 2017 to 2021 and Forecast 2022 to 2032, By Technique

Table 25: South Asia Market Size (US$ Million) Analysis 2017 to 2021 and Forecast 2022 to 2032, By Application

Table 26: South Asia Market Size (US$ Million) Analysis 2017 to 2021 and Forecast 2022 to 2032, By End User

Table 27: East Asia Market Size (US$ Million) Analysis 2017 to 2021 and Forecast 2022 to 2032, By Country

Table 28: East Asia Market Volume (US$ Million) Analysis 2017 to 2021 and Forecast 2022 to 2032, By Technique

Table 29: East Asia Market Size (US$ Million) Analysis 2017 to 2021 and Forecast 2022 to 2032, By Technique

Table 30: East Asia Market Size (US$ Million) Analysis 2017 to 2021 and Forecast 2022 to 2032, By Application

Table 31: East Asia Market Size (US$ Million) Analysis 2017 to 2021 and Forecast 2022 to 2032, By End User

Table 32: Oceania Market Size (US$ Million) Analysis 2017 to 2021 and Forecast 2022 to 2032, By Country

Table 33: Oceania Market Volume (US$ Million) Analysis 2017 to 2021 and Forecast 2022 to 2032, By Technique

Table 34: Oceania Market Size (US$ Million) Analysis 2017 to 2021 and Forecast 2022 to 2032, By Technique

Table 35: Oceania Market Size (US$ Million) Analysis 2017 to 2021 and Forecast 2022 to 2032, By Application

Table 36: Oceania Market Size (US$ Million) Analysis 2017 to 2021 and Forecast 2022 to 2032, By End User

Table 37: MEA Market Size (US$ Million) Analysis 2017 to 2021 and Forecast 2022 to 2032, By Country

Table 38: MEA Market Volume (US$ Million) Analysis 2017 to 2021 and Forecast 2022 to 2032, By Technique

Table 39: MEA Market Size (US$ Million) Analysis 2017 to 2021 and Forecast 2022 to 2032, By Technique

Table 40: MEA Market Size (US$ Million) Analysis 2017 to 2021 and Forecast 2022 to 2032, By Application

Table 41: MEA Market Size (US$ Million) Analysis 2017 to 2021 and Forecast 2022 to 2032, By End User
Sabyasachi Ghosh
Sabyasachi Ghosh

Principal Consultant

Talk to Analyst

Find your sweet spots for generating winning opportunities in this market.

List of Charts

Figure 01: Global Market Volume (in Units) Analysis, 2017 to 2021

Figure 02: Global Market Volume Forecast (in Units), 2021 to 2031

Figure 03: Global Market Size (US$ Million) Analysis, 2017 to 2021

Figure 04: Global Market Size (US$ Million) & Y-o-Y Growth (%) Analysis, 2022 to 2032

Figure 05: Global Market Absolute $ Opportunity, 2022 to 2032

Figure 06: Global Average Pricing Analysis Benchmark USD (Unit) (2021)

Figure 07: Global Pricing Analysis per Unit (US$), in 2021

Figure 08: Global Breast Lesion Localization Devices, Pricing Forecast per unit (US$), in 2032

Figure 09: Global Market Share Analysis (%), By Technique, 2022 & 2032

Figure 10: Global Market Y-o-Y Analysis (%), By Technique, 2022 to 2032

Figure 11: Global Market Attractiveness Analysis By Technique, 2022 to 2032

Figure 12: Global Market Share Analysis (%), By Application, 2022 & 2032

Figure 13: Global Market Y-o-Y Analysis (%), By Application, 2022 to 2032

Figure 14: Global Market Attractiveness Analysis by Application, 2022 to 2032

Figure 15: Global Market Share Analysis (%), By End User, 2022 & 2032

Figure 16: Global Market Y-o-Y Analysis (%), By End User, 2022 to 2032

Figure 17: Global Market Attractiveness Analysis by End User, 2022 to 2032

Figure 18: Global Market Share Analysis (%), By Region, 2022 & 2032

Figure 19: Global Market Y-o-Y Analysis (%), By Region, 2022 to 2032

Figure 20: Global Market Attractiveness Analysis by Region, 2022 to 2032

Figure 21: North America Market Value Share, By Technique (2022 E)

Figure 22: North America Market Value Share, By Application (2022 E)

Figure 23: North America Market Value Share, By End User (2022 E)

Figure 24: North America Market Value Share, By Country (2022 E)

Figure 25: North America Market Size (US$ Million) Analysis, 2017 to 2021

Figure 26: North America Market Size (US$ Million) & Y-o-Y Growth (%) Analysis, 2022 to 2032

Figure 27: North America Market Attractiveness Analysis By Technique, 2022 to 2032

Figure 28: North America Market Attractiveness Analysis by Application, 2022 to 2032

Figure 29: North America Market Attractiveness Analysis by End User, 2022 to 2032

Figure 30: North America Market Attractiveness Analysis by Country, 2022 to 2032

Figure 31: USA Market Value Proportion Analysis, 2022

Figure 32: USA Market Share Analysis(%) By Technique, 2022 & 2032

Figure 33: USA Market Share Analysis(%) By Application, 2022 & 2032

Figure 34: USA Market Share Analysis (%) by End User, 2022 & 2032

Figure 35: Global Vs USA Growth Comparison

Figure 36: Canada Market Value Proportion Analysis, 2022

Figure 37: Canada Market Share Analysis(%) By Technique, 2022 & 2032

Figure 38: Canada Market Share Analysis(%) By Application, 2022 & 2032

Figure 39: Canada Market Share Analysis (%) by End User, 2022 & 2032

Figure 40: Global Vs Canada Growth Comparison

Figure 41: Latin America Market Value Share, By Technique (2022 E)

Figure 42: Latin America Market Value Share, By Application (2022 E)

Figure 43: Latin America Market Value Share, By End User (2022 E)

Figure 44: Latin America Market Value Share, By Country (2022 E)

Figure 45: Latin America Market Size (US$ Million) Analysis, 2017 to 2021

Figure 46: Latin America Market Size (US$ Million) & Y-o-Y Growth (%) Analysis, 2022 to 2032

Figure 47: Latin America Market Attractiveness Analysis By Technique, 2022 to 2032

Figure 48: Latin America Market Attractiveness Analysis by Application, 2022 to 2032

Figure 49: Latin America Market Attractiveness Analysis by End User, 2022 to 2032

Figure 50: Latin America Market Attractiveness Analysis by Country, 2022 to 2032

Figure 51: Brazil Market Value Proportion Analysis, 2022

Figure 52: Brazil Market Share Analysis(%) By Technique, 2022 & 2032

Figure 53: Brazil Market Share Analysis(%) By Application, 2022 & 2032

Figure 54: Brazil Market Share Analysis (%) by End User, 2022 & 2032

Figure 55: Global Vs Brazil Growth Comparison

Figure 56: Mexico Market Value Proportion Analysis, 2022

Figure 57: Mexico Market Share Analysis(%) By Technique, 2022 & 2032

Figure 58: Mexico Market Share Analysis(%) By Application, 2022 & 2032

Figure 59: Mexico Market Share Analysis (%) by End User, 2022 & 2032

Figure 60: Global Vs Mexico Growth Comparison

Figure 61: Argentina Market Value Proportion Analysis, 2022

Figure 62: Argentina Market Share Analysis(%) By Technique, 2022 & 2032

Figure 63: Argentina Market Share Analysis(%) By Application, 2022 & 2032

Figure 64: Argentina Market Share Analysis (%) by End User, 2022 & 2032

Figure 65: Global Vs Argentina Growth Comparison

Figure 66: Europe Market Value Share, By Technique (2022 E)

Figure 67: Europe Market Value Share, By Application (2022 E)

Figure 68: Europe Market Value Share, By End User (2022 E)

Figure 69: Europe Market Value Share, By Country (2022 E)

Figure 70: Europe Market Size (US$ Million) Analysis, 2017 to 2021

Figure 71: Europe Market Size (US$ Million) & Y-o-Y Growth (%) Analysis, 2022 to 2032

Figure 72: Europe Market Attractiveness Analysis by Technique, 2022 to 2032

Figure 73: Europe and Europe Market Attractiveness Analysis by Application, 2022 to 2032

Figure 74: Europe Market Attractiveness Analysis by End User, 2022 to 2032

Figure 75: Europe Market Attractiveness Analysis by Country, 2022 to 2032

Figure 76: UK Market Value Proportion Analysis, 2022

Figure 77: UK Market Share Analysis(%) By Technique, 2022 & 2032

Figure 78: UK Market Share Analysis(%) By Application, 2022 & 2032

Figure 79: UK Market Share Analysis (%) by End User, 2022 & 2032

Figure 80: Global Vs UK Growth Comparison

Figure 81: Germany Market Value Proportion Analysis, 2022

Figure 82: Germany Market Share Analysis(%) By Technique, 2022 & 2032

Figure 83: Germany Market Share Analysis(%) By Application, 2022 & 2032

Figure 84: Germany Market Share Analysis (%) by End User, 2022 & 2032

Figure 85: Global Vs Germany Growth Comparison

Figure 86: Italy Market Value Proportion Analysis, 2022

Figure 87: Italy Market Share Analysis(%) By Technique, 2022 & 2032

Figure 88: Italy Market Share Analysis(%) By Application, 2022 & 2032

Figure 89: Italy Market Share Analysis (%) by End User, 2022 & 2032

Figure 90: Global Vs Italy Growth Comparison

Figure 91: France Market Value Proportion Analysis, 2022

Figure 92: France Market Share Analysis(%) By Technique, 2022 & 2032

Figure 93: France Market Share Analysis(%) By Application, 2022 & 2032

Figure 94: France Market Share Analysis (%) by End User, 2022 & 2032

Figure 95: Global Vs France Growth Comparison

Figure 96: Spain Market Value Proportion Analysis, 2022

Figure 97: Spain Market Share Analysis(%) By Technique, 2022 & 2032

Figure 98: Spain Market Share Analysis(%) By Application, 2022 & 2032

Figure 99: Spain Market Share Analysis (%) by End User, 2022 & 2032

Figure 100: Global Vs Spain Growth Comparison

Figure 101: Nordic & Russia Market Value Proportion Analysis, 2022

Figure 102: Nordic & Russia Market Share Analysis(%) By Technique, 2022 & 2032

Figure 103: Nordic & Russia Market Share Analysis(%) By Application, 2022 & 2032

Figure 104: Nordic & Russia Market Share Analysis (%) by End User, 2022 & 2032

Figure 105: Global Vs Nordic & Russia Growth Comparison

Figure 106: BENULUX Market Value Proportion Analysis, 2022

Figure 107: BENULUX Market Share Analysis(%) By Technique, 2022 & 2032

Figure 108: BENULUX Market Share Analysis(%) By Application, 2022 & 2032

Figure 109: BENULUX Market Share Analysis (%) by End User, 2022 & 2032

Figure 110: Global Vs BENULUX Growth Comparison

Figure 111: South Asia Market Value Share, By Technique (2022 E)

Figure 112: South Asia Market Value Share, By Application (2022 E)

Figure 113: South Asia Market Value Share, By End User (2022 E)

Figure 114: South Asia Market Value Share, By Country (2022 E)

Figure 115: South Asia Market Size (US$ Million) Analysis, 2017 to 2021

Figure 116: South Asia Market Size (US$ Million) & Y-o-Y Growth (%) Analysis, 2022 to 2032

Figure 117: South Asia Market Attractiveness Analysis By Technique, 2022 to 2032

Figure 118: South Asia Market Attractiveness Analysis by Application, 2022 to 2032

Figure 119: South Asia Market Attractiveness Analysis by End User, 2022 to 2032

Figure 120: South Asia Market Attractiveness Analysis by Country, 2022 to 2032

Figure 121: India Market Value Proportion Analysis, 2022

Figure 122: India Market Share Analysis(%) By Technique, 2022 & 2032

Figure 123: India Market Share Analysis(%) By Application, 2022 & 2032

Figure 124: India. Market Share Analysis (%) by End User, 2022 & 2032

Figure 125: Global Vs India Growth Comparison

Figure 126: Malaysia Market Value Proportion Analysis, 2022

Figure 127: Malaysia Market Share Analysis(%) By Technique, 2022 & 2032

Figure 128: Malaysia Market Share Analysis(%) By Application, 2022 & 2032

Figure 129: Malaysia Market Share Analysis (%) by End User, 2022 & 2032

Figure 130: Global Vs Malaysia Growth Comparison

Figure 131: Thailand Market Value Proportion Analysis, 2022

Figure 132: Thailand Market Share Analysis(%) By Technique, 2022 & 2032

Figure 133: Thailand Market Share Analysis(%) By Application, 2022 & 2032

Figure 134: Thailand Market Share Analysis (%) by End User, 2022 & 2032

Figure 135: Global Vs Thailand Growth Comparison

Figure 136: Indonesia Market Value Proportion Analysis, 2022

Figure 137: Indonesia Market Share Analysis(%) By Technique, 2022 & 2032

Figure 138: Indonesia Market Share Analysis(%) By Application, 2022 & 2032

Figure 139: Indonesia Market Share Analysis (%) by End User, 2022 & 2032

Figure 140: Global Vs Indonesia Growth Comparison

Figure 141: East Asia Market Value Share, By Technique (2022 E)

Figure 142: East Asia Market Value Share, By Application (2022 E)

Figure 143: East Asia Market Value Share, By End User (2022 E)

Figure 144: East Asia Market Value Share, By Country (2022 E)

Figure 145: East Asia Market Size (US$ Million) Analysis, 2017 to 2021

Figure 146: East Asia Market Size (US$ Million) & Y-o-Y Growth (%) Analysis, 2022 to 2032

Figure 147: East Asia Market Attractiveness Analysis By Technique, 2022 to 2032

Figure 148: East Asia Market Attractiveness Analysis by Application, 2022 to 2032

Figure 149: East Asia Market Attractiveness Analysis by End User, 2022 to 2032

Figure 150: East Asia Market Attractiveness Analysis by Country, 2022 to 2032

Figure 151: China Market Value Proportion Analysis, 2022

Figure 152: China Market Share Analysis(%) By Technique, 2022 & 2032

Figure 153: China Market Share Analysis(%) By Application, 2022 & 2032

Figure 154:China. Market Share Analysis (%) by End User, 2022 & 2032

Figure 155: Global Vs China Growth Comparison

Figure 156: Japan Market Value Proportion Analysis, 2022

Figure 157: Japan Market Share Analysis(%) By Technique, 2022 & 2032

Figure 158: Japan Market Share Analysis(%) By Application, 2022 & 2032

Figure 159: Japan. Market Share Analysis (%) by End User, 2022 & 2032

Figure 160: Global Vs Japan Growth Comparison

Figure 161: South Korea Market Value Proportion Analysis, 2022

Figure 162: South Korea Market Share Analysis(%) By Technique, 2022 & 2032

Figure 163: South Korea Market Share Analysis(%) By Application, 2022 & 2032

Figure 164: South Korea. Market Share Analysis (%) by End User, 2022 & 2032

Figure 165: Global Vs South Korea Growth Comparison

Figure 166: Oceania Market Value Share, By Technique (2022 E)

Figure 167: Oceania Market Value Share, By Application (2022 E)

Figure 168: Oceania Market Value Share, By End User (2022 E)

Figure 169: Oceania Market Value Share, By Country (2022 E)

Figure 170: Oceania Market Size (US$ Million) Analysis, 2017 to 2021

Figure 171: Oceania Market Size (US$ Million) & Y-o-Y Growth (%) Analysis, 2022 to 2032

Figure 172: Oceania Market Attractiveness Analysis By Technique, 2022 to 2032

Figure 173: Oceania Market Attractiveness Analysis by Application, 2022 to 2032

Figure 174: Oceania Market Attractiveness Analysis by End User, 2022 to 2032

Figure 175: Oceania Market Attractiveness Analysis by Country, 2022 to 2032

Figure 176: Australia Market Value Proportion Analysis, 2022

Figure 177: Australia Market Share Analysis(%) By Technique, 2022 & 2032

Figure 178: Australia Market Share Analysis(%) By Application, 2022 & 2032

Figure 179: Australia. Market Share Analysis (%) by End User, 2022 & 2032

Figure 180: Global Vs Australia Growth Comparison

Figure 181: New Zealand Market Value Proportion Analysis, 2022

Figure 182: New Zealand Market Share Analysis(%) By Technique, 2022 & 2032

Figure 183: New Zealand Market Share Analysis(%) By Application, 2022 & 2032

Figure 184: New Zealand Market Share Analysis (%) by End User, 2022 & 2032

Figure 185: Global Vs New Zealand Growth Comparison

Figure 186: MEA Market Value Share, By Technique (2022 E)

Figure 187: MEA Market Value Share, By Application (2022 E)

Figure 188: MEA Market Value Share, By End User (2022 E)

Figure 189: MEA Market Value Share, By Country (2022 E)

Figure 190: MEA Market Size (US$ Million) Analysis, 2017 to 2021

Figure 191: MEA Market Size (US$ Million) & Y-o-Y Growth (%) Analysis, 2022 to 2032

Figure 192: MEA Market Attractiveness Analysis By Technique, 2022 to 2032

Figure 193: MEA Market Attractiveness Analysis by Application, 2022 to 2032

Figure 194: MEA Market Attractiveness Analysis by End User, 2022 to 2032

Figure 195: MEA Market Attractiveness Analysis by Country, 2022 to 2032

Figure 196: Turkey Market Value Proportion Analysis, 2022

Figure 197: Turkey Market Share Analysis(%) By Technique, 2022 & 2032

Figure 198: Turkey Market Share Analysis(%) By Application, 2022 & 2032

Figure 199: Turkey. Market Share Analysis (%) by End User, 2022 & 2032

Figure 200: Global Vs Turkey Growth Comparison

Figure 201: GCC Countries Market Value Proportion Analysis, 2022

Figure 202: GCC Countries Market Share Analysis(%) By Technique, 2022 & 2032

Figure 203: GCC Countries Market Share Analysis(%) By Application, 2022 & 2032

Figure 204: GCC Countries. Market Share Analysis (%) by End User, 2022 & 2032

Figure 205: Global Vs GCC Countries Growth Comparison

Figure 206: South Africa Market Value Proportion Analysis, 2022

Figure 207: South Africa Market Share Analysis(%) By Technique, 2022 & 2032

Figure 208: South Africa Market Share Analysis(%) By Application, 2022 & 2032

Figure 209: South Africa. Market Share Analysis (%) by End User, 2022 & 2032

Figure 210: Global Vs South Africa Growth Comparison

Recommendations

Healthcare

Breast Pump Market

Published : November 2023

Healthcare

Cancer Diagnostics Market

Published : August 2023

Healthcare

Gamma Probe Devices Market

Published : February 2023

Healthcare

Cancer Supportive Care Products Market

Published : July 2020

Explore Healthcare Insights

View Reports

Breast Lesion Localization Device Market