The global non-magnetic connectors market is projected to reach USD 13,561.0 million by 2035, recording an absolute increase of USD 7,337.5 million over the forecast period. The market is valued at USD 6,223.5 million in 2025 and is set to rise at a CAGR of 8.1% during the assessment period. The market size is expected to grow by nearly 2.18X during the same period, supported by increasing adoption of MRI-compatible medical devices and growing demand for precision instrumentation in aerospace applications. High manufacturing costs and technical complexity requirements may constrain market expansion in price-sensitive segments.
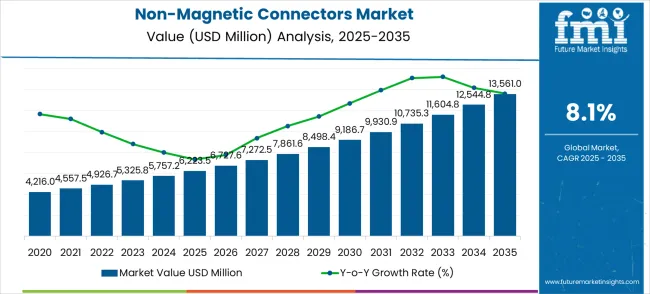
Between 2025 and 2030, the non-magnetic connectors market is projected to expand from USD 6,223.5 million to USD 9,213.8 million, resulting in a value increase of USD 2,990.3 million, which represents 40.8% of the total forecast growth for the decade. This phase of growth will be shaped by rising demand for advanced medical imaging equipment, product innovation in miniaturized connector designs and high-frequency applications, and expanding healthcare infrastructure and aerospace manufacturing capabilities. Companies are establishing competitive positions through investment in specialized materials research, advanced manufacturing processes, and strategic market expansion across medical device manufacturing, aerospace systems integration, and emerging industrial automation sectors.
From 2030 to 2035, the market is forecast to grow from USD 9,213.8 million to USD 13,561.0 million, adding another USD 4,347.2 million, which constitutes 59.2% of the ten-year expansion. This period is expected to be characterized by expansion of next-generation MRI systems, including 7T and 11.7T ultra-high field scanners and specialized surgical robotics platforms tailored for specific medical procedures, strategic collaborations between connector manufacturers and medical device OEMs, and increased focus on biocompatible materials with enhanced signal integrity specifications. The growing emphasis on minimally invasive surgical procedures and precision aerospace instrumentation will drive demand for ultra-miniature non-magnetic connectors across diverse medical and industrial applications.
| Metric | Value |
|---|---|
| Market Value (2025) | USD 6,223.5 million |
| Market Forecast Value (2035) | USD 13,561.0 million |
| Forecast CAGR (2025-2035) | 8.1% |
The non-magnetic connectors market is expanding due to enhanced medical imaging precision and reduced electromagnetic interference in critical applications. The rising adoption of advanced MRI systems drives demand for specialized connectors that maintain signal integrity while preventing magnetic artifacts during diagnostic procedures. Healthcare infrastructure modernization, particularly in emerging markets, presents substantial opportunities for manufacturers serving hospitals that are upgrading to digital imaging platforms. Aerospace applications benefit from connectors that eliminate magnetic interference in navigation and communication systems, supporting both commercial aviation growth and defense modernization programs. Industrial automation increasingly requires non-magnetic solutions for precision manufacturing environments where electromagnetic compatibility ensures operational reliability. Growth is constrained by complex manufacturing processes that increase production costs and limit supplier base expansion.
The market is set to reach USD 13,561.0 million by 2035 (8.1% CAGR), underpinned by MRI-safe connectivity, avionics EMC requirements, and ultra-miniaturized RF interconnects. From the 2025 base of USD 6,223.5 million, five routes collectively unlock approximately USD 7.1–7.5 billion in incremental opportunities through 2035.
Pathway A – MRI & Diagnostic Imaging Upgrade Wave Connector platforms for 3T→7T/11.7T MRI, coil arrays, patient interfaces, and push-on QMA quick-turn cabling in radiology suites. Largest pool: USD 2.4–2.8 billion.
Pathway B – Surgical Robotics & Minimally Invasive Platforms Biocompatible, sterilization-proof, non-magnetic micro-RF/power connectors for robotic arms, endoscopic tools, and cath-lab systems. Expected pool: USD 1.0–1.2 billion.
Pathway C – Aerospace/Defense Avionics & Space Systems EMI-immune interconnects for navigation, comms, EW, and satellite payloads; ruggedized QMA/SMP with high vibe/thermal endurance. Incremental pool: USD 1.5–1.8 billion.
Pathway D – Ultra-Miniature & High-Frequency Interconnects SMP/SMPM/SMPS and custom micro-coax for probes, wearables, and mmWave sensing, with a focus on low insertion loss and fast serviceability. Opportunity pool: USD 0.9–1.1 billion.
Pathway E – Materials, Compliance & Localized Supply Non-ferromagnetic alloys, PEEK/PEI insulators, ISO-10993 biocompatibility, repeat-sterilization designs, and regionalized manufacturing/traceability. Strategic pool: USD 0.9–1.1 billion.
The market is segmented by connector type, application, and region. By connector type, the market is divided into QMA connectors and SMP connectors. By application, the market is categorized into medical industry, aerospace, industrial automation, and others. Regionally, the market is divided into North America, Latin America, Europe, East Asia, South Asia & Pacific, and Middle East & Africa.
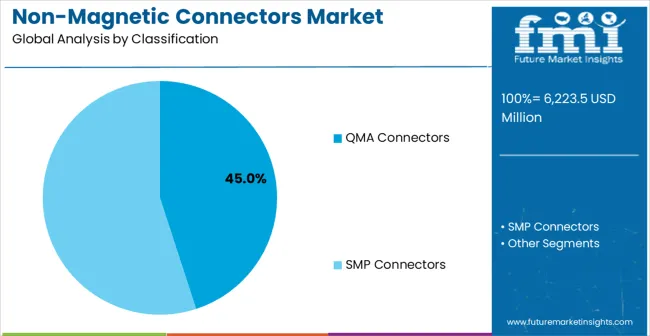
QMA connectors are projected to account for 45% of the non-magnetic connectors market in 2025. This leading share is supported by widespread adoption in medical imaging applications where quick-connect functionality and reliable performance are essential, particularly in MRI systems requiring frequent cable connections and disconnections during patient procedures. QMA connectors provide superior electrical performance with minimal signal loss while maintaining complete magnetic neutrality, making them the preferred choice for high-frequency applications in medical and aerospace environments. The segment benefits from established manufacturing processes and proven reliability in demanding operating conditions where connection integrity directly impacts system performance and patient safety.
The dominance of QMA connectors stems from their unique combination of push-on coupling mechanism and excellent RF performance characteristics that meet stringent medical device requirements. These connectors support rapid installation and removal procedures essential in clinical environments while maintaining consistent impedance matching across frequency ranges critical for imaging system accuracy.
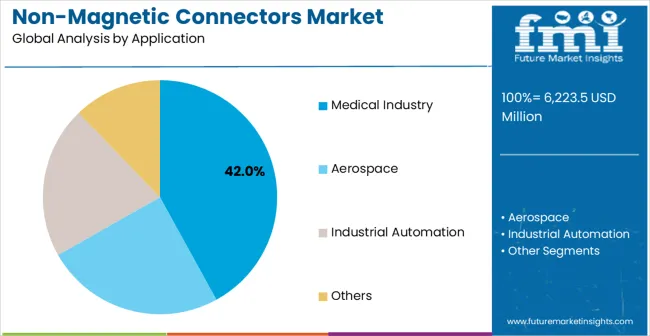
Medical industry applications are expected to account for around 42% of the global non-magnetic connector market in 2025. This significant share underscores the critical importance of magnetic compatibility in healthcare settings, particularly in medical imaging environments where even minimal ferromagnetic materials can distort MRI and CT scan results, affecting diagnostic accuracy and patient safety. Modern hospitals and medical facilities increasingly deploy advanced imaging systems, robotic-assisted surgical platforms, and specialized medical equipment that require extensive non-magnetic connectivity solutions to ensure operational precision and reliability in environments where electromagnetic interference must be completely eliminated.
The growth of this segment is supported by continuous advancements in healthcare technology, which drive demand for connectors that support higher data transmission rates and maintain superior signal integrity while remaining fully magnetically neutral. Non-magnetic connectors are also required to meet stringent biocompatibility standards and withstand repeated sterilization procedures without any loss in performance, making them essential for patient-critical applications. Adoption is further fueled by hospital modernization programs and the rising use of surgical robotics, where precision control and safety are paramount.
The healthcare segment represents the fastest-growing end-use industry within the non-magnetic connectors market, driven by the widespread adoption of advanced diagnostic imaging systems, minimally invasive surgical procedures, and robotic-assisted interventions. Increasing healthcare expenditure in developed countries, coupled with rapid infrastructure development in emerging economies, has LED to a growing demand for modern medical facilities equipped with comprehensive non-magnetic connectivity solutions. These applications require connectors that meet stringent reliability standards and ensure full electromagnetic compatibility, providing opportunities for high-performance products and specialized technical support.
Growth in the healthcare segment is further supported by aging global populations, which drive higher volumes of medical imaging procedures and surgical interventions that rely on sophisticated electronic systems. Technological advancements in healthcare equipment, including MRI, CT scanners, surgical robotics, and portable monitoring devices, are pushing the demand for connectors that deliver higher data transmission rates, improved signal integrity, and complete magnetic neutrality. Trends in telemedicine, remote monitoring, and wearable medical devices are creating new applications for compact, high-performance non-magnetic connectors.
The aerospace and defense segment is a key contributor to the global non-magnetic connector market, driven by the critical need to eliminate electromagnetic interference in navigation, communication, and control systems. Connectors used in this segment must deliver consistent performance under extreme operating conditions, including wide temperature variations, high vibration levels, and intense electromagnetic environments. Failure of connectors in such applications can compromise mission-critical operations, making reliability and durability paramount. Worldwide defense modernization programs create demand for specialized connectivity solutions that comply with stringent military standards for electromagnetic compatibility and environmental resilience.
The aerospace industry also supports robust market growth through the expansion of commercial aviation and avionics systems, where non-magnetic connectors ensure the safety and integrity of onboard electronic systems. Long product lifecycles and the willingness of aerospace and defense customers to pay premium prices for proven high-performance connectors further strengthen market prospects. Emerging applications in space technology require connectors that can maintain functionality and signal integrity under extreme conditions, including vacuum, radiation, and temperature fluctuations.
The non-magnetic connectors market is primarily driven by the increasing adoption of advanced medical imaging systems, including MRI and CT scanners, which require connectors that maintain full electromagnetic compatibility to ensure diagnostic accuracy and patient safety. As healthcare facilities in emerging markets modernize their infrastructure, demand for comprehensive non-magnetic connectivity solutions rises. Hospitals upgrading to digital imaging platforms and implementing sophisticated surgical systems rely heavily on connectors that provide reliable performance under stringent operational conditions. Similarly, the aerospace and defense industries contribute significantly to market growth, as connectors that eliminate electromagnetic interference are essential for navigation, communication, and control systems where reliability directly impacts operational safety. Commercial aviation expansion and global defense modernization programs further strengthen demand for high-performance, non-magnetic connectors capable of withstanding extreme environmental and electromagnetic conditions.
The market growth faces several constraints. The manufacturing of non-magnetic connectors involves complex processes requiring specialized materials, precision fabrication techniques, and advanced engineering, which increase production costs compared to conventional connectors. A limited supplier base for high-performance non-magnetic materials creates potential supply chain vulnerabilities, restricting market expansion in cost-sensitive applications. Achieving miniaturization while maintaining electromagnetic compatibility presents engineering challenges that increase development complexity and extend product introduction timelines.
Key trends shaping the market include the evolution of connector design toward higher data transmission rates, improved signal integrity, and enhanced durability, enabling next-generation medical imaging systems and aerospace avionics platforms. Regulatory mandates in healthcare, especially in MRI environments, drive adoption of non-magnetic materials. Emerging applications in telemedicine, robotic-assisted surgery, and advanced avionics systems further accelerate market growth. Nevertheless, economic pressures in healthcare systems and aerospace manufacturing may slow adoption if cost reduction priorities outweigh performance and reliability requirements.
| Country | CAGR (2025-2035) |
|---|---|
| China | 10.9% |
| India | 10.1% |
| Germany | 9.3% |
| Brazil | 8.5% |
| United States | 7.7% |
| United Kingdom | 6.9% |
| Japan | 6.1% |
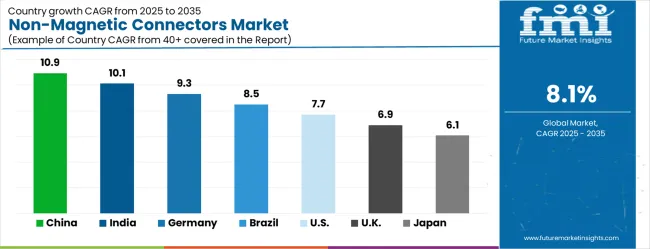
The non-magnetic connectors market is gathering pace worldwide, with China taking the lead thanks to rapid healthcare infrastructure development and expanding aerospace manufacturing capabilities. Close behind, India benefits from government healthcare modernization initiatives and a growing medical device manufacturing sector, positioning itself as a strategic growth hub. Germany shows steady advancement, where precision manufacturing expertise and stringent quality standards strengthen its role in the regional supply chain. Brazil is sharpening its focus on healthcare access expansion and aerospace industry development, signaling an ambition to capture niche opportunities. The United States stands out for its advanced medical technology adoption, and the United Kingdom and Japan continue to record consistent progress. Together, China and India anchor the global expansion story, while the rest build stability and diversity into the market's growth path.
The report covers an in-depth analysis of 40+ countries, top-performing countries are highlighted below.
China demonstrates the strongest growth potential in the non-magnetic connectors market, supported by comprehensive healthcare system modernization and rapid expansion of medical imaging facilities across urban and rural regions. Revenue expansion at a CAGR of 10.9% through 2035 reflects the country's massive investment in hospital infrastructure development and growing adoption of advanced MRI systems in tier-two and tier-three cities. Beijing, Shanghai, and Guangzhou serve as primary hubs for medical technology adoption, where international healthcare providers establish comprehensive diagnostic centers requiring sophisticated non-magnetic connectivity solutions. Healthcare consumers increasingly access advanced diagnostic services through expanded insurance coverage and rising disposable income that supports premium medical care utilization. Manufacturing sector development creates additional demand through precision instrumentation applications and aerospace component production where electromagnetic compatibility requirements drive connector specifications.
Government healthcare policy initiatives prioritize advanced medical imaging capabilities as part of comprehensive healthcare access expansion programs nationwide. The country's medical device manufacturing sector benefits from both domestic demand growth and export opportunities in specialized connector technologies that meet international quality standards.
India exhibits substantial growth momentum in non-magnetic connectors demand, driven by healthcare infrastructure development and increasing adoption of advanced medical imaging technologies in private and public hospital systems. Revenue growth at a CAGR of 10.1% reflects the expanding medical device manufacturing sector and government initiatives promoting healthcare access through digital diagnostic capabilities. Mumbai, Delhi, and Bangalore serve as medical technology centers where healthcare providers implement comprehensive imaging solutions requiring specialized non-magnetic connectivity for MRI and CT scanner installations. Healthcare consumers benefit from improved diagnostic access through insurance scheme expansions and growing awareness of advanced medical technologies that support early disease detection and treatment planning. Industrial manufacturing development creates complementary demand for precision connectors in aerospace and defense applications where electromagnetic compatibility standards mirror medical device requirements.
Medical technology adoption accelerates through public-private partnerships that facilitate hospital modernization and equipment procurement programs supporting comprehensive diagnostic capabilities. Healthcare workforce development programs enhance technical expertise in medical imaging operations and equipment maintenance that requires specialized connector knowledge and application experience.
Germany maintains a strong market position through emphasis on precision manufacturing and advanced engineering capabilities that serve both medical device and aerospace applications requiring superior electromagnetic compatibility performance. Demand growth at a CAGR of 9.3% reflects the country's leadership in medical technology development and aerospace system integration where connector reliability and performance specifications exceed international standards.
Munich, Frankfurt, and Hamburg serve as centers for medical technology innovation where manufacturers develop next-generation imaging systems and surgical equipment requiring sophisticated non-magnetic connectivity solutions. Industrial customers prioritize long-term reliability and performance consistency over cost considerations, creating market conditions that favor premium connector technologies with proven operating characteristics. Manufacturing excellence in precision components supports export demand for specialized connectors serving global medical device and aerospace applications.
German medical device manufacturers emphasize technical innovation and quality assurance that establishes international benchmarks for connector performance and reliability standards. Aerospace industry collaboration creates synergies between medical and aviation applications that share similar electromagnetic compatibility requirements and performance specifications.
Brazil demonstrates consistent market development through healthcare system modernization and growing adoption of advanced medical imaging technologies in major metropolitan regions. Revenue expansion at a CAGR of 8.5% reflects increasing healthcare investment and infrastructure development that prioritizes diagnostic capabilities and surgical precision equipment requiring non-magnetic connectivity solutions.
São Paulo, Rio de Janeiro, and Brasília serve as healthcare technology centers where hospitals upgrade imaging departments and implement sophisticated medical equipment requiring specialized connector applications. Healthcare accessibility improvements through insurance expansion and government programs create broader demand for medical services that utilize advanced diagnostic technologies. Manufacturing sector development in aerospace and defense applications provides complementary market opportunities for non-magnetic connectors serving precision instrumentation requirements.
Healthcare infrastructure development benefits from international partnerships and technology transfer agreements that facilitate adoption of advanced medical equipment and associated connectivity requirements. Medical device regulatory framework development ensures quality standards that align with international specifications for non-magnetic materials and electromagnetic compatibility performance.
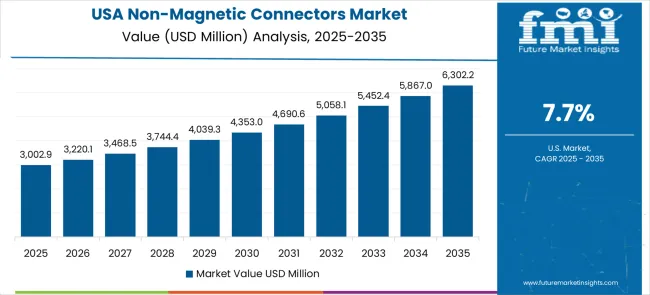
The United States maintains market leadership through continuous innovation in medical technology and aerospace applications that drive demand for advanced non-magnetic connector solutions. Market growth at a CAGR of 7.7% reflects the mature healthcare system's focus on technology advancement and the aerospace industry's emphasis on performance improvement and safety enhancement.
New York, Los Angeles, and Chicago serve as primary markets where healthcare providers implement cutting-edge medical equipment and aerospace manufacturers develop next-generation systems requiring sophisticated connectivity solutions. Healthcare consumers access the most advanced medical technologies through comprehensive insurance coverage and premium healthcare services that prioritize diagnostic accuracy and treatment precision. Defense and commercial aerospace applications create demand for high-performance connectors that meet stringent electromagnetic compatibility and reliability specifications.
Medical device innovation drives continuous improvement in connector performance characteristics and miniaturization capabilities that enable next-generation imaging systems and surgical equipment. Regulatory framework leadership establishes international standards for medical device electromagnetic compatibility and safety requirements that influence global market development.
The United Kingdom demonstrates steady market development through emphasis on healthcare excellence and aerospace technology advancement that requires sophisticated non-magnetic connectivity solutions. Demand growth at a CAGR of 6.9% reflects the country's commitment to maintaining advanced healthcare capabilities and aerospace industry competitiveness through technology innovation and performance improvement. London, Manchester, and Birmingham serve as centers for medical technology adoption where healthcare providers implement advanced imaging systems and aerospace manufacturers develop precision instrumentation requiring specialized connector applications. Healthcare system investment prioritizes diagnostic accuracy and treatment precision that depend on reliable electromagnetic compatibility performance in medical equipment connectivity. Aerospace industry collaboration with international partners creates demand for connectors meeting global performance standards and regulatory requirements.
Healthcare technology adoption emphasizes evidence-based medicine and clinical effectiveness that requires reliable medical equipment performance supported by high-quality connectivity solutions. Aerospace industry expertise in precision manufacturing and quality assurance creates synergies with medical device applications sharing similar performance requirements and technical specifications.
Japan continues to demonstrate technology leadership in precision manufacturing and advanced medical equipment development that requires sophisticated non-magnetic connector solutions. Market development at a CAGR of 6.1% reflects the country's emphasis on quality excellence and technical innovation in both medical device and industrial applications where electromagnetic compatibility performance is critical.
Tokyo, Osaka, and Nagoya serve as technology centers where manufacturers develop advanced medical imaging systems and precision instrumentation requiring specialized connectivity solutions that meet stringent performance specifications. Healthcare system maturity creates demand for premium medical equipment that prioritizes diagnostic accuracy and operational reliability through superior connector technology. Manufacturing excellence in precision components supports both domestic applications and export demand for high-performance connector solutions serving international markets.
Japanese manufacturers emphasize continuous improvement and technical refinement that establishes international benchmarks for connector performance and reliability standards in medical and industrial applications. Healthcare technology integration focuses on precision and reliability which requires connector solutions meeting the highest performance specifications and quality standards.
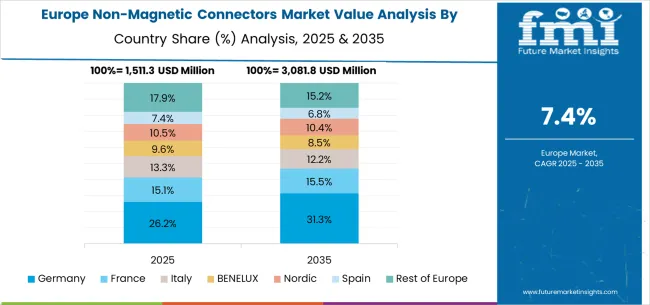
The non-magnetic connectors market in Europe reflects diverse regional priorities with Germany leading through precision manufacturing excellence and technical innovation serving both medical device and aerospace applications. The United Kingdom maintains strong positions in healthcare technology and aerospace development while France focuses on medical equipment modernization and aerospace industry collaboration.
Italy and Spain demonstrate growing adoption of advanced medical imaging technologies, supported by healthcare infrastructure development and regulatory framework improvements. Nordic countries emphasize healthcare system excellence and aerospace technology development, while BENELUX nations benefit from strategic location advantages and manufacturing capabilities. Eastern European regions show increasing adoption of advanced medical technologies through healthcare modernization programs and medical device manufacturing development that creates comprehensive market growth across the continent.
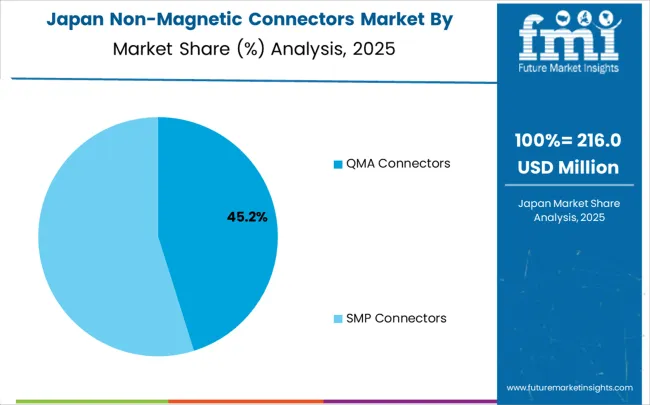
In Japan, the non-magnetic connectors market is largely driven by the QMA connectors segment, which accounts for 52% of total market revenues in 2025. The high penetration of advanced MRI systems in the domestic healthcare infrastructure and the stringent electromagnetic compatibility requirements mandated for medical device connectivity are key contributing factors. SMP connectors follow with a 28% share, primarily in aerospace applications that integrate navigation systems and communication equipment requiring ultra-miniature form factors. Other connector types contribute 20% as specialized applications in industrial automation and research instrumentation continue to develop.
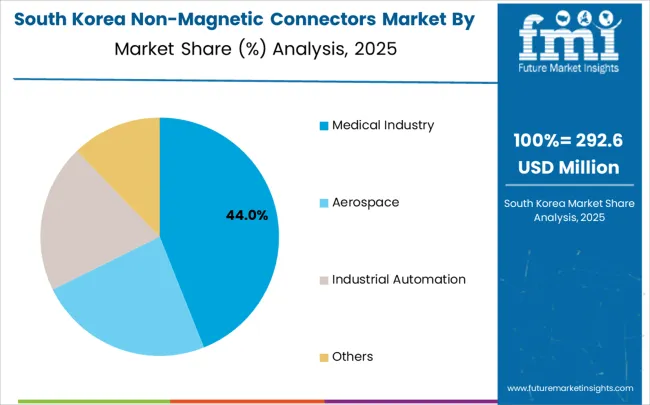
In South Korea, the market is expected to remain dominated by medical industry applications, which hold a 48% share in 2025. These applications are typically the primary growth driver where advanced medical imaging systems and surgical equipment require precise electromagnetic compatibility performance for optimal diagnostic accuracy. Aerospace applications and industrial automation each hold 26% market share, with rising adoption of precision manufacturing systems across semiconductor and automotive industries. The remaining segments account for minor shares but are gradually gaining traction in specialized research and development applications due to increasing technology advancement and performance requirements.
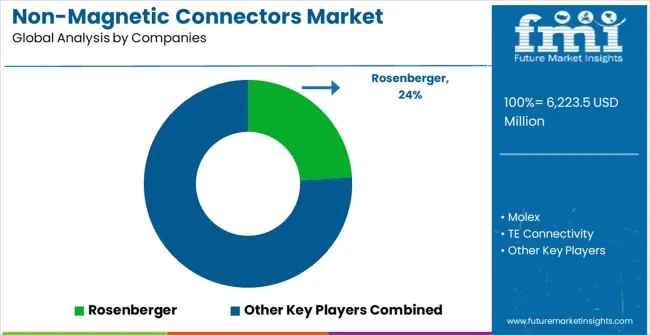
The non-magnetic connectors market operates through a concentrated competitive structure with approximately 15-20 meaningful global players, where the top five companies control roughly 60% of total market revenue through specialized manufacturing capabilities and established customer relationships in medical device and aerospace applications. Competition centers on technical performance, electromagnetic compatibility certification, and customer support capabilities rather than price-based differentiation, creating stable market dynamics favoring established suppliers with proven track records in demanding applications.
Market leaders including Rosenberger, Molex, and TE Connectivity maintain competitive advantages through comprehensive product portfolios, global manufacturing presence, and extensive engineering support capabilities that serve diverse customer requirements across medical, aerospace, and industrial segments. These companies leverage economies of scale in specialized materials procurement and advanced manufacturing processes while maintaining quality standards that meet stringent regulatory requirements for medical device applications. Intellectual property portfolios and established supplier relationships with major OEMs create significant barriers to entry for potential competitors.
Challenger companies including Radiall, Amphenol, and Phoenix Contact compete through specialized product offerings and targeted market segments where technical expertise and customer service capabilities differentiate their value propositions. These players often focus on specific applications or geographic regions where they can establish strong customer relationships and technical leadership positions. Emerging specialists including Luxshare, APTIV, and Hirose Electric pursue growth through innovation in miniaturization, performance improvement, and cost optimization that addresses evolving customer requirements in medical device and aerospace applications.
Market consolidation continues as larger players acquire specialized capabilities and geographic presence while smaller companies seek partnerships or acquisition opportunities to access broader customer bases and manufacturing resources. Technology development requires substantial investment in materials research, manufacturing process improvement, and quality assurance systems that favor companies with sufficient scale and technical expertise to support comprehensive product development programs serving multiple market segments simultaneously.
| Item | Value |
|---|---|
| Quantitative Units (2025) | USD 6,223.5 million |
| Connector Type | QMA Connectors, SMP Connectors |
| Application | Medical Industry, Aerospace, Industrial Automation, Others |
| Regions Covered | North America, Latin America, Europe, East Asia, South Asia & Pacific, Middle East & Africa |
| Country Covered | United States, Canada, United Kingdom, Germany, France, China, Japan, South Korea, India, Brazil, Australia and 40+ countries |
| Key Companies Profiled | Rosenberger, Molex, TE Connectivity, Radiall, Amphenol, Phoenix Contact, Luxshare, APTIV, JONHON, Hirose Electric |
| Additional Attributes | Dollar sales by connector type, application, and end-use industry, regional demand trends across North America, Europe, and Asia-Pacific, competitive landscape with established manufacturers and emerging specialists, adoption patterns in medical device and aerospace applications, integration with advanced materials technology and precision manufacturing platforms, innovations in miniaturization capabilities and electromagnetic compatibility performance, and development of specialized connector solutions with enhanced signal integrity, biocompatibility, and environmental durability for enhanced performance in critical applications. |
The global non-magnetic connectors market is estimated to be valued at USD 6,223.5 million in 2025.
The market size for the non-magnetic connectors market is projected to reach USD 13,561.0 million by 2035.
The non-magnetic connectors market is expected to grow at a 8.1% CAGR between 2025 and 2035.
The key product types in non-magnetic connectors market are qma connectors and SMP connectors.
In terms of application, medical industry segment to command 42.0% share in the non-magnetic connectors market in 2025.


Our Research Products

The "Full Research Suite" delivers actionable market intel, deep dives on markets or technologies, so clients act faster, cut risk, and unlock growth.

The Leaderboard benchmarks and ranks top vendors, classifying them as Established Leaders, Leading Challengers, or Disruptors & Challengers.

Locates where complements amplify value and substitutes erode it, forecasting net impact by horizon

We deliver granular, decision-grade intel: market sizing, 5-year forecasts, pricing, adoption, usage, revenue, and operational KPIs—plus competitor tracking, regulation, and value chains—across 60 countries broadly.

Spot the shifts before they hit your P&L. We track inflection points, adoption curves, pricing moves, and ecosystem plays to show where demand is heading, why it is changing, and what to do next across high-growth markets and disruptive tech

Real-time reads of user behavior. We track shifting priorities, perceptions of today’s and next-gen services, and provider experience, then pace how fast tech moves from trial to adoption, blending buyer, consumer, and channel inputs with social signals (#WhySwitch, #UX).

Partner with our analyst team to build a custom report designed around your business priorities. From analysing market trends to assessing competitors or crafting bespoke datasets, we tailor insights to your needs.
Supplier Intelligence
Discovery & Profiling
Capacity & Footprint
Performance & Risk
Compliance & Governance
Commercial Readiness
Who Supplies Whom
Scorecards & Shortlists
Playbooks & Docs
Category Intelligence
Definition & Scope
Demand & Use Cases
Cost Drivers
Market Structure
Supply Chain Map
Trade & Policy
Operating Norms
Deliverables
Buyer Intelligence
Account Basics
Spend & Scope
Procurement Model
Vendor Requirements
Terms & Policies
Entry Strategy
Pain Points & Triggers
Outputs
Pricing Analysis
Benchmarks
Trends
Should-Cost
Indexation
Landed Cost
Commercial Terms
Deliverables
Brand Analysis
Positioning & Value Prop
Share & Presence
Customer Evidence
Go-to-Market
Digital & Reputation
Compliance & Trust
KPIs & Gaps
Outputs
Full Research Suite comprises of:
Market outlook & trends analysis
Interviews & case studies
Strategic recommendations
Vendor profiles & capabilities analysis
5-year forecasts
8 regions and 60+ country-level data splits
Market segment data splits
12 months of continuous data updates
DELIVERED AS:
PDF EXCEL ONLINE
RF Connectors Market Size and Share Forecast Outlook 2025 to 2035
SMP Connectors Market Size and Share Forecast Outlook 2025 to 2035
Gas Connectors and Gas Hoses Market - Safety, Demand & Market Outlook 2025 to 2035
Cable Connectors and Adapters Market Analysis by Application, Product, Type and Region: Forecast from 2025 to 2035
Automotive Connectors Market Size and Share Forecast Outlook 2025 to 2035
Underwater Connectors Market Size and Share Forecast Outlook 2025 to 2035
Small Bore Connectors Market Analysis - Size, Growth, and Forecast 2025 to 2035
Automotive Connectors Global Market
Fiber Optic Connectors Market Growth – Trends & Forecast through 2034
Multi Coaxial Connectors Market - Growth & Forecast 2025 to 2035
Automotive Data Connectors Market Analysis - Size, Share, & Forecast Outlook 2025 to 2035
Miniature Duplex Connectors Market Size and Share Forecast Outlook 2025 to 2035
Intravenous Line Connectors Market Size and Share Forecast Outlook 2025 to 2035
Small Form Factor (SFF) Connectors Market Size and Share Forecast Outlook 2025 to 2035
Demand for Miniature Duplex Connectors in USA Size and Share Forecast Outlook 2025 to 2035
Nonmagnetic Wheelchair Market

Thank you!
You will receive an email from our Business Development Manager. Please be sure to check your SPAM/JUNK folder too.
Chat With
MaRIA