Normal Flow Filtration Products Market Forecast and Outlook (2025-2035)

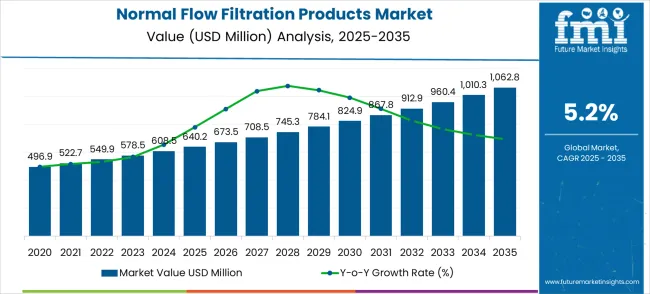
The global normal flow filtration products market is projected to expand from USD 640.2 million in 2025 to approximately USD 1,062.8 million by 2035, recording an absolute increase of USD 422.6 million over the forecast period. This translates into a total growth of 66.0%, with the market forecast to expand at a CAGR of 5.2% between 2025 and 2035. The overall market size is expected to grow by nearly 1.66X during the same period, supported by increasing biopharmaceutical production and growing demand for high-purity filtration solutions across various pharmaceutical manufacturing, chemical processing, and food & beverage applications.
Quick Stats for Normal Flow Filtration Products Market

  • Normal Flow Filtration Products Market Value (2025): USD 640.2 million
  • Normal Flow Filtration Products Market Forecast Value (2035): USD 1,062.8 million
  • Normal Flow Filtration Products Market Forecast CAGR: 5.2%
  • Leading Filtration Technology in Normal Flow Filtration Products Market: Microporous Filtration Membrane (58.0%)
  • Key Growth Regions in Normal Flow Filtration Products Market: China, India, and Germany
  • Top Key Players in Normal Flow Filtration Products Market: Thurne, Cytiva, Sartorius, Mettler Toledo, Parker, Nalgene, Repligen, APPLEXION, Solaris Biotech, Pall, 3M

Normal Flow Filtration Products Market Market Value Analysis

Between 2025 and 2030, the normal flow filtration products market is projected to expand from USD 640.2 million to USD 824.9 million, resulting in a value increase of USD 184.7 million, which represents 43.7% of the total forecast growth for the decade. This phase of growth will be shaped by rising biopharmaceutical manufacturing across global markets, increasing demand for sterile filtration systems in drug production, and growing adoption of single-use filtration technologies in bioprocessing applications. Pharmaceutical manufacturers are investing in advanced filtration systems to improve product purity and meet stringent regulatory requirements for drug manufacturing.

Normal Flow Filtration Products Market Key Takeaways

Metric Value
Market Value (2025) USD 640.2 million
Market Forecast Value (2035) USD 1,062.8 million
Forecast CAGR (2025–2035) 5.2%

From 2030 to 2035, the market is forecast to grow from USD 824.9 million to USD 1,062.8 million, adding another USD 237.9 million, which constitutes 56.3% of the overall ten-year expansion. This period is expected to be characterized by expansion of biosimilar production in developing countries, integration of continuous manufacturing technologies in pharmaceutical processes, and development of specialized filtration solutions for personalized medicine and gene therapy applications. The growing focus on process efficiency and quality assurance will drive demand for innovative and precisely engineered normal flow filtration solutions across multiple life sciences and industrial sectors.

Between 2020 and 2025, the normal flow filtration products market experienced steady expansion, driven by increasing global pharmaceutical production and growing recognition of filtration importance in ensuring product quality and regulatory compliance. The market developed as pharmaceutical companies recognized the need for reliable, high-performance filtration systems to support critical manufacturing processes and meet evolving regulatory standards. Quality requirements and contamination control mandates began influencing procurement decisions toward advanced filtration technologies from established life sciences equipment manufacturers.

Why is the Normal Flow Filtration Products Market Growing?

Market expansion is being supported by the increasing biopharmaceutical production activities across global economies and the corresponding need for high-purity filtration systems that ensure product quality and regulatory compliance in pharmaceutical and bioprocessing applications. Modern pharmaceutical manufacturing requires sophisticated filtration technologies that provide superior separation efficiency while maintaining sterile processing conditions and preventing contamination. The excellent filtration performance and reliability characteristics of normal flow filtration products make them essential components in demanding life sciences environments where product purity and process integrity are paramount.

The growing emphasis on pharmaceutical quality assurance and regulatory compliance is driving demand for advanced filtration technologies from certified manufacturers with proven track records of life sciences equipment reliability and performance validation. Pharmaceutical companies are increasingly investing in high-performance filtration systems that offer improved separation efficiency and enhanced contamination control compared to conventional filtration methods. Regulatory requirements and quality standards are establishing performance benchmarks that favor precision-engineered filtration solutions with comprehensive validation documentation and regulatory compliance support.

Segmental Analysis

The market is segmented by filtration technology, application, and region. By filtration technology, the market is divided into microporous filtration membrane, depth filtration media, and other specialized filtration products. Based on application, the market is categorized into pharmaceutical industry, chemical industry, food & beverage, and other industrial applications. Regionally, the market is divided into North America, Europe, East Asia, South Asia & Pacific, Latin America, and Middle East & Africa.
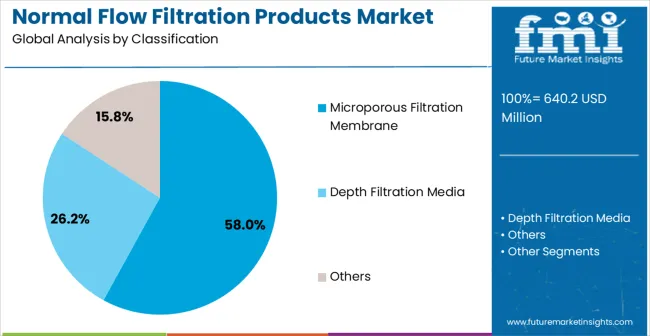
By Filtration Technology, Microporous Filtration Membrane Segment Accounts for 58% Market Share

Normal Flow Filtration Products Market Analysis By Classification

Microporous filtration membrane products are projected to account for 58% of the normal flow filtration products market in 2025. This leading share is supported by the superior separation precision and versatility that microporous membranes provide in pharmaceutical and bioprocessing applications. Microporous filtration membranes offer excellent particle retention with predictable pore size distribution, making them the preferred choice for sterile filtration, protein purification, and pharmaceutical manufacturing applications requiring precise separation control. The segment benefits from technological advancements that have improved membrane performance and durability while reducing fouling tendency and extending operational life.

Modern microporous filtration membranes incorporate advanced polymer technologies, optimized pore structures, and sophisticated surface treatments that ensure superior filtration efficiency while maintaining consistent flow rates and minimal protein binding. These innovations have significantly improved process reliability and product quality while reducing operational costs through extended membrane life and reduced replacement frequency. The pharmaceutical and biotechnology sectors particularly drive demand for microporous membrane solutions, as these industries require precise separation capabilities with validated performance and regulatory compliance documentation.

Additionally, the biopharmaceutical manufacturing sector increasingly adopts microporous membranes for applications where sterile filtration and product purity are essential for meeting regulatory requirements and ensuring patient safety. The integration of single-use membrane systems and automated filtration processes creates opportunities for improved process flexibility and reduced contamination risks, further accelerating market adoption as manufacturers seek reliable yet efficient filtration solutions.
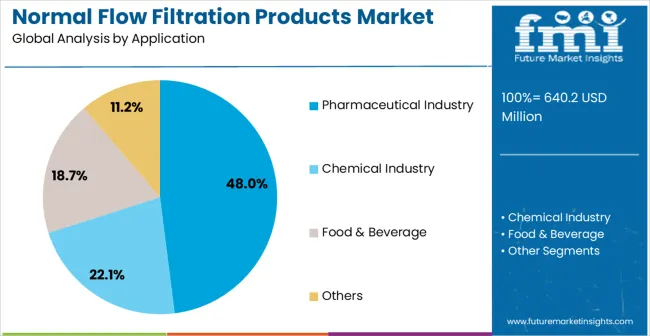
By Application, Pharmaceutical Industry Segment Accounts for 48% Market Share

Normal Flow Filtration Products Market Analysis By Application

Pharmaceutical industry applications are expected to represent 48% of normal flow filtration products demand in 2025. This dominant share reflects the critical importance of filtration in pharmaceutical manufacturing and the stringent requirements for product purity and sterile processing in drug production. Pharmaceutical applications require advanced filtration systems for drug substance purification, sterile drug product manufacturing, and process intermediate filtration. The segment benefits from continuous expansion of pharmaceutical manufacturing globally and increasing regulatory requirements for pharmaceutical quality and safety assurance.

Pharmaceutical applications demand exceptional filtration performance to ensure product purity and regulatory compliance across diverse manufacturing processes and therapeutic product categories. These applications require filtration systems capable of removing contaminants, maintaining sterile conditions, and supporting validated manufacturing processes while meeting comprehensive regulatory documentation requirements. The growing emphasis on pharmaceutical quality and patient safety drives consistent demand for proven filtration technologies that demonstrate superior performance and regulatory compliance. Major pharmaceutical companies and contract manufacturing organizations contribute significantly to market growth as facilities invest in advanced filtration systems to support growing production volumes and meet evolving regulatory standards.

Additionally, the trend toward biopharmaceutical manufacturing and personalized medicine creates opportunities for specialized filtration systems designed for complex biological products and novel therapeutic modalities. The segment also benefits from increasing biosimilar production and generic drug manufacturing requiring proven filtration technologies for cost-effective yet compliant production processes.

What are the Drivers, Restraints, and Key Trends of the Normal Flow Filtration Products Market?

The normal flow filtration products market is advancing steadily due to increasing pharmaceutical production volumes and growing recognition of filtration importance in ensuring product quality and regulatory compliance. However, the market faces challenges including membrane fouling and replacement costs affecting operational economics, complex validation requirements for pharmaceutical applications, and varying filtration needs across different manufacturing processes. Technical innovation and regulatory support programs continue to influence adoption patterns and operational efficiency optimization.

Integration of Single-Use and Continuous Processing Technologies

The growing implementation of single-use filtration systems and continuous manufacturing processes is enabling improved process flexibility and reduced contamination risks in pharmaceutical and bioprocessing applications. Single-use filtration technologies provide simplified validation, reduced cleaning requirements, and enhanced process security while supporting flexible manufacturing operations. These technologies are particularly valuable for biopharmaceutical facilities that require rapid product changeovers and comprehensive contamination control without extensive cleaning validation procedures.

Development of High-Capacity and Specialized Filtration Solutions

Modern filtration manufacturers are incorporating advanced membrane technologies and specialized surface modifications that improve filtration capacity while addressing specific application requirements such as protein binding reduction and enhanced chemical compatibility. Integration of optimized pore structures and advanced materials enables superior filtration performance and significant operational advantages compared to conventional filtration products. Advanced manufacturing techniques and quality control systems also support development of application-specific filtration solutions for specialized pharmaceutical and bioprocessing requirements.
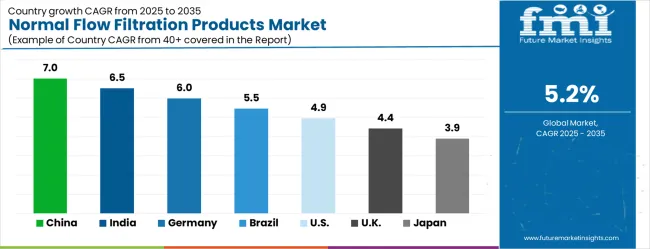
Analysis of Normal Flow Filtration Products Market by Key Country

Normal Flow Filtration Products Market Cagr Analysis By Country

Country CAGR (2025–2035)
China 7.0%
India 6.5%
Germany 6.0%
Brazil 5.5%
United States 4.9%
United Kingdom 4.4%
Japan 3.9%

The market is growing rapidly, with China leading at a 7.0% CAGR through 2035, driven by massive pharmaceutical manufacturing expansion, increasing biopharmaceutical production capabilities, and growing demand for high-quality filtration systems in drug manufacturing. India follows at 6.5%, supported by rising pharmaceutical industry development and growing investments in modern pharmaceutical manufacturing equipment and process technologies. Germany records strong growth at 6.0%, emphasizing pharmaceutical engineering excellence, quality standards, and advanced bioprocessing capabilities. Brazil grows steadily at 5.5%, integrating modern filtration technologies into expanding pharmaceutical and chemical manufacturing operations. The United States shows moderate growth at 4.9%, focusing on biopharmaceutical innovation and advanced manufacturing technologies. The United Kingdom maintains steady expansion at 4.4%, supported by pharmaceutical industry development and life sciences research programs. Japan demonstrates stable growth at 3.9%, emphasizing technological innovation and precision pharmaceutical manufacturing excellence.

The report covers an in-depth analysis of 40+ countries; top-performing countries are highlighted below.

Analysis of Normal Flow Filtration Products Market in China

China recorded a 7.0% CAGR, driven by growing pharmaceutical, biotechnology, and chemical manufacturing industries. Adoption of normal flow filtration products increased due to demand for high purity, reliable, and scalable filtration solutions. Manufacturers emphasized advanced membranes, single-use systems, and automation for efficiency and contamination control. Competitive strategies included partnerships with pharmaceutical firms, expansion of regional production, and R&D in high-performance filters. Growth was further supported by rising domestic pharmaceutical production and expansion of biotech facilities. Companies focused on compliance with local and international quality standards while optimizing throughput and reducing operational costs.

  • Pharmaceutical and biotechnology sectors drove adoption of high purity filtration products.
  • R&D focused on advanced membranes and single-use systems for efficiency.
  • Key players included Merck China, Sartorius China, and Pall Corporation focusing on partnerships and regional expansion.

Growth Outlook of Normal Flow Filtration Products Market in India

India demonstrated a 6.5% CAGR, supported by expanding pharmaceutical and biopharmaceutical manufacturing and rising demand for high quality filtration systems. Manufacturers developed scalable, reliable, and contamination-resistant products tailored for small to large batch processing. Adoption was strongest in vaccine, biologics, and chemical production. Competitive strategies included collaborations with pharmaceutical companies, regional distribution expansion, and in-house R&D to optimize filtration efficiency. Government initiatives promoting local pharmaceutical manufacturing further strengthened market growth. Manufacturers focused on operational reliability, compliance with global quality standards, and cost-effective solutions for diverse end users.

  • Pharmaceutical manufacturing growth increased demand for scalable and reliable filtration systems.
  • R&D focused on contamination-resistant products and process efficiency.
  • Prominent players included Merck India, Sartorius India, and Pall Corporation focusing on collaborations and distribution networks.

Demand Forecast for Normal Flow Filtration Products Market in Germany

Germany progressed at a 6.0% CAGR, driven by strong biotechnology, pharmaceutical, and chemical sectors requiring high precision and quality standards. Manufacturers emphasized advanced filtration products, single-use systems, and automation integration for efficient production. Adoption was strongest in biologics, chemical intermediates, and research laboratories. Competitive strategies included innovation in membrane technologies, partnerships with industrial users, and compliance with European safety and quality standards. Germany’s focus on high-performance production, export potential, and stringent regulations reinforced demand for reliable and advanced filtration solutions, supporting both domestic and international market growth.

  • Biotechnology and pharmaceutical industries drove adoption of advanced filtration products.
  • Innovation in membrane technologies and single-use systems improved production efficiency.
  • Key players included Sartorius Germany, Merck Germany, and Pall Corporation focusing on innovation and compliance with EU standards.

Future Outlook for Normal Flow Filtration Products Market in Brazil

Brazil advanced at a 5.5% CAGR, supported by pharmaceutical, biotechnology, and food and beverage industries requiring reliable filtration systems. Manufacturers emphasized robust, high capacity, and scalable filtration solutions for local and regional markets. Adoption was strongest in vaccine production, chemical processing, and dairy applications. Competitive strategies included collaborations with pharmaceutical companies, regional manufacturing expansion, and product customization for tropical climates. Growth was further driven by government incentives for local pharmaceutical production and industrial modernization. Companies focused on compliance, operational efficiency, and regional availability of filtration products.

  • Pharmaceutical and food industries increased adoption of scalable filtration systems.
  • R&D targeted high capacity and climate-resistant filtration solutions.
  • Prominent players included Merck Brazil, Sartorius Brazil, and Pall Corporation focusing on local manufacturing and regional partnerships.

Normal Flow Filtration Products Market Growth in the United States

The United States expanded at a 4.9% CAGR, influenced by demand from pharmaceuticals, biopharmaceuticals, and chemical manufacturing requiring high reliability and throughput. Manufacturers invested in single-use systems, automated filtration units, and advanced membrane technologies. Adoption was strongest in biologics, vaccine production, and specialty chemicals. Competitive strategies included collaborations with biotech companies, R&D for high efficiency and contamination control, and scaling production capacity. Strict FDA and ISO compliance further reinforced market growth. Manufacturers focused on product innovation, process reliability, and operational efficiency to meet high standards of the domestic and export markets.

  • Biopharmaceutical and chemical sectors drove adoption of advanced filtration systems.
  • Single-use and automated systems improved throughput and contamination control.
  • Key participants included Merck US, Sartorius US, and Pall Corporation focusing on innovation and regulatory compliance.

Future Perspective of Normal Flow Filtration Products Market in the United Kingdom

The United Kingdom registered a 4.4% CAGR, supported by pharmaceutical, biotechnology, and chemical industries requiring high precision filtration. Manufacturers emphasized reliable, scalable, and automation-ready filtration solutions. Adoption was strongest in biologics, chemical production, and research laboratories. Competitive strategies included product innovation, compliance with UK and EU regulations, and partnerships with local industrial users. R&D targeted membrane performance, contamination control, and throughput optimization. Government incentives and growing investment in life sciences facilities further encouraged adoption. Companies focused on quality, operational efficiency, and regulatory adherence to maintain competitiveness in both domestic and export markets.
  • Life sciences and chemical sectors increased adoption of reliable filtration solutions.
  • R&D focused on membrane performance and contamination control.
  • Prominent participants included Merck UK, Sartorius UK, and Pall Corporation focusing on partnerships and compliance.

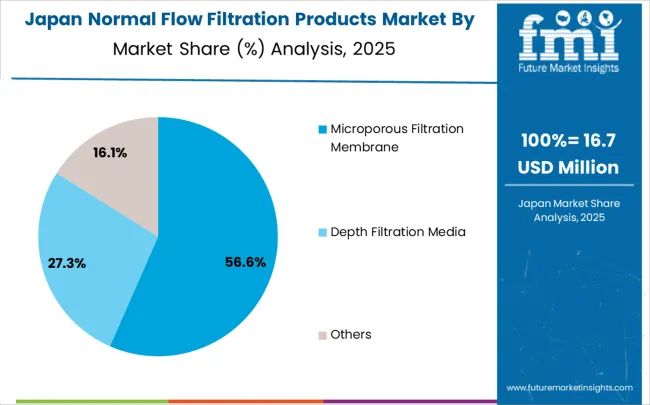
Demand Forecast for Normal Flow Filtration Products Market in Japan

Normal Flow Filtration Products Market Japan Market Share Analysis By Classification

Japan advanced at a 3.9% CAGR, influenced by pharmaceutical, biotechnology, and chemical manufacturing sectors requiring precision and reliability. Manufacturers invested in advanced filtration technologies, single-use systems, and automated solutions to improve efficiency and product safety. Adoption was strongest in biologics, specialty chemicals, and research applications. Competitive strategies included R&D for high efficiency, contamination control, and compact design, as well as collaboration with pharmaceutical companies. Government standards and stringent quality regulations supported the use of high-performance filtration products. Continuous innovation and operational reliability reinforced market growth across domestic and export-focused pharmaceutical and biotechnology sectors.
  • Pharmaceutical and biotechnology industries drove adoption of high-performance filtration products.
  • R&D targeted automation, efficiency, and contamination control.
  • Key players included Merck Japan, Sartorius Japan, and Pall Corporation focusing on innovation and compliance with regulatory standards.

Europe Market Split by Country

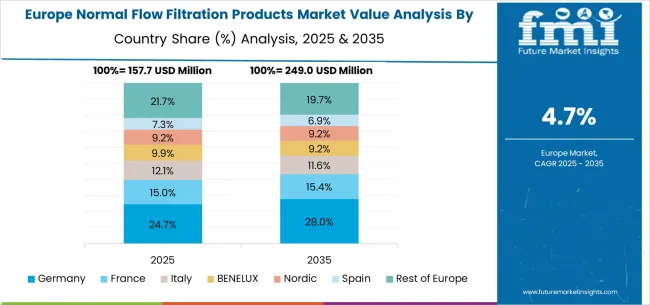
Normal Flow Filtration Products Market Europe Country Market Share Analysis, 2025 & 2035

The normal flow filtration products market in Europe is projected to grow from USD 172.7 million in 2025 to USD 286.6 million by 2035, registering a CAGR of 5.2% over the forecast period. Germany is expected to maintain its leadership with a 28.9% share in 2025, supported by its strong pharmaceutical base and advanced bioprocessing infrastructure. The United Kingdom follows with 18.4% market share, driven by pharmaceutical industry development and life sciences research programs. France holds 15.7% of the European market, benefiting from pharmaceutical manufacturing expansion and biotechnology investments. Italy and Spain collectively represent 22.0% of regional demand, with growing focus on pharmaceutical filtration applications and manufacturing development. The Rest of Europe region accounts for 15.0% of the market, supported by pharmaceutical development in Eastern European countries and Nordic life sciences sectors.
Competitive Landscape of Normal Flow Filtration Products Market

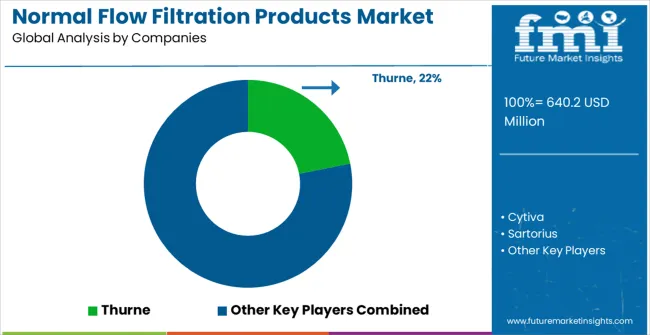
Normal Flow Filtration Products Market Analysis By Company

The market is defined by competition among established life sciences equipment manufacturers, specialized filtration technology companies, and integrated bioprocessing solution providers. Companies are investing in advanced membrane technologies, filtration system innovation, validation support programs, and comprehensive technical services to deliver reliable, efficient, and regulatory-compliant filtration solutions. Strategic partnerships, technology development, and geographic expansion are central to strengthening product portfolios and market presence. Thurne, operating globally, offers comprehensive pharmaceutical filtration solutions with focus on membrane performance, regulatory compliance, and technical support services. Cytiva provides advanced filtration systems with emphasis on biopharmaceutical applications and process integration. Sartorius, multinational life sciences company, delivers comprehensive bioprocessing solutions with focus on single-use technologies and process optimization. Mettler Toledo offers specialized filtration equipment with proven analytical and process applications.

Parker delivers specialized filtration solutions with focus on industrial and pharmaceutical applications. Nalgene offers comprehensive filtration products with laboratory and process applications. Repligen provides bioprocessing filtration systems with focus on downstream purification applications. APPLEXION, Solaris Biotech, Pall, and 3M offer specialized filtration expertise, comprehensive product portfolios, and technical support across global and regional pharmaceutical and industrial markets.

Global Normal Flow Filtration Products Market -- Stakeholder Contribution Framework

The normal flow filtration products market underpins pharmaceutical quality assurance, bioprocessing excellence, regulatory compliance, and manufacturing safety. With pharmaceutical quality mandates, regulatory compliance requirements, and demand for high-purity processing solutions, the sector must balance innovation leadership, operational reliability, and cost effectiveness. Coordinated contributions from governments, regulatory bodies, manufacturers, pharmaceutical companies, and investors will accelerate the transition toward quality-assured, compliant, and technologically advanced filtration systems.

How Governments Could Spur Market Growth and Adoption

  • Pharmaceutical Development Incentives: Provide subsidies or tax credits for pharmaceutical companies investing in advanced manufacturing equipment or high-purity filtration technologies.
  • Regulatory Framework: Establish comprehensive pharmaceutical manufacturing standards, quality requirements, and filtration system validation protocols, boosting adoption of certified filtration systems.
  • Manufacturing Programs: Embed advanced filtration equipment into pharmaceutical industry development initiatives, biopharmaceutical production programs, and healthcare manufacturing support.
  • Innovation Support: Support research and development programs for advanced filtration technologies while streamlining approval processes for innovative pharmaceutical equipment.
  • Industry Development: Recognize pharmaceutical manufacturing excellence within national healthcare and biotechnology development frameworks.

How Regulatory Bodies Could Support Market Development

  • Standards Development: Create harmonized guidelines for filtration system specifications, validation requirements, and pharmaceutical compliance testing protocols.
  • Validation Support: Establish comprehensive validation frameworks, documentation standards, and compliance verification procedures for pharmaceutical filtration systems.
  • Quality Assurance: Develop certification programs and quality metrics to ensure consistent filtration system performance and regulatory compliance across pharmaceutical applications.
  • Global Harmonization: Work with international regulatory agencies to align pharmaceutical filtration standards and facilitate global market access for certified systems.

How Manufacturers Could Strengthen the Ecosystem

  • Technology Integration: Embed advanced membrane materials, automated monitoring systems, and process control technologies into filtration products for enhanced performance and reliability.
  • Application Development: Collaborate with pharmaceutical companies to develop application-specific filtration solutions and optimize processes for diverse drug manufacturing requirements.
  • Innovation Focus: Advance filtration technologies, membrane design, and system integration capabilities for enhanced pharmaceutical manufacturing performance and regulatory compliance.
  • Complete Solutions: Bundle filtration systems with validation services, technical training, and ongoing support for comprehensive pharmaceutical manufacturing solutions.

How Pharmaceutical Companies Could Navigate Opportunities

  • Technology Investment: Invest in advanced filtration systems, process automation, and quality assurance technologies to optimize pharmaceutical manufacturing capabilities and product quality.
  • Quality Excellence: Implement comprehensive quality management systems, filtration validation protocols, and continuous improvement programs for manufacturing processes.
  • Compliance Management: Establish robust regulatory compliance programs, documentation systems, and quality assurance procedures for pharmaceutical filtration operations.
  • Innovation Partnership: Collaborate with filtration manufacturers and technology providers to develop next-generation filtration solutions and manufacturing processes.

How Investors and Financial Enablers Could Unlock Value

  • Pharmaceutical Innovation: Fund research and development of advanced filtration technologies, membrane innovations, and bioprocessing solutions for pharmaceutical applications.
  • Market Expansion: Support market development initiatives, manufacturing capacity expansion, and technology adoption programs in emerging pharmaceutical markets.
  • Technology Development: Back innovation in smart filtration systems, membrane technologies, and process optimization solutions for life sciences applications.
  • Manufacturing Investment: Invest in filtration equipment manufacturing facilities, research centers, and service networks in high-growth markets (China, India, Germany).
  • Supply Chain Enhancement: Provide financing and logistics support for global pharmaceutical filtration equipment manufacturing and distribution optimization.

Key Players in the Normal Flow Filtration Products Market

  • Thurne
  • Cytiva
  • Sartorius
  • Mettler Toledo
  • Parker
  • Nalgene
  • Repligen
  • APPLEXION
  • Solaris Biotech
  • Pall
  • 3M

Scope of the Report

Item Value
Quantitative Units USD 640.2 million
Classification Type Microporous Filtration Membrane, Depth Filtration Media, Others
Application Pharmaceutical Industry, Chemical Industry, Food & Beverage, Others
Regions Covered North America, Europe, East Asia, South Asia & Pacific, Latin America, Middle East & Africa
Country Covered United States, Germany, India, China, United Kingdom, Japan, Brazil, and other 40+ countries
Key Companies Profiled Thurne, Cytiva, Sartorius, Mettler Toledo, Parker, Nalgene, Repligen, APPLEXION, Solaris Biotech, Pall, 3M
Additional Attributes Dollar sales by filtration technology and application, regional demand trends across North America, Europe, and Asia-Pacific, competitive landscape with established life sciences equipment manufacturers and specialized suppliers, buyer preferences for microporous versus depth filtration technologies, integration with advanced bioprocessing and single-use technologies, innovations in membrane materials and filtration efficiency for enhanced pharmaceutical manufacturing performance, and adoption of intelligent filtration solutions with embedded monitoring and process control capabilities for improved regulatory compliance and operational optimization.

Normal Flow Filtration Products Market by Segments

Product Type:

  • Microporous Filtration Membrane
  • Depth Filtration Media
  • Others

Application:

  • Pharmaceutical Industry
  • Chemical Industry
  • Food & Beverage
  • Others

Region:

  • North America
    • United States
    • Canada
    • Mexico
  • Europe
    • Germany
    • United Kingdom
    • France
    • Italy
    • Spain
    • Nordic
    • BENELUX
    • Rest of Europe
  • East Asia
    • China
    • Japan
    • South Korea
  • South Asia & Pacific
    • India
    • ASEAN
    • Australia & New Zealand
    • Rest of South Asia & Pacific
  • Latin America
    • Brazil
    • Chile
    • Rest of Latin America
  • Middle East & Africa
    • Kingdom of Saudi Arabia
    • Other GCC Countries
    • Turkey
    • South Africa
    • Other African Union
    • Rest of Middle East & Africa

Table of Content

  1. Executive Summary
    • Global Market Outlook
    • Demand to side Trends
    • Supply to side Trends
    • Technology Roadmap Analysis
    • Analysis and Recommendations
  2. Market Overview
    • Market Coverage / Taxonomy
    • Market Definition / Scope / Limitations
  3. Market Background
    • Market Dynamics
      • Drivers
      • Restraints
      • Opportunity
      • Trends
    • Scenario Forecast
      • Demand in Optimistic Scenario
      • Demand in Likely Scenario
      • Demand in Conservative Scenario
    • Opportunity Map Analysis
    • Product Life Cycle Analysis
    • Supply Chain Analysis
    • Investment Feasibility Matrix
    • Value Chain Analysis
    • PESTLE and Porter’s Analysis
    • Regulatory Landscape
    • Regional Parent Market Outlook
    • Production and Consumption Statistics
    • Import and Export Statistics
  4. Global Market Analysis 2020 to 2024 and Forecast, 2025 to 2035
    • Historical Market Size Value (USD Million) Analysis, 2020 to 2024
    • Current and Future Market Size Value (USD Million) Projections, 2025 to 2035
      • Y to o to Y Growth Trend Analysis
      • Absolute $ Opportunity Analysis
  5. Global Market Pricing Analysis 2020 to 2024 and Forecast 2025 to 2035
  6. Global Market Analysis 2020 to 2024 and Forecast 2025 to 2035, By Classification
    • Introduction / Key Findings
    • Historical Market Size Value (USD Million) Analysis By Classification , 2020 to 2024
    • Current and Future Market Size Value (USD Million) Analysis and Forecast By Classification , 2025 to 2035
      • Microporous Filtration Membrane
      • Depth Filtration Media
      • Others
    • Y to o to Y Growth Trend Analysis By Classification , 2020 to 2024
    • Absolute $ Opportunity Analysis By Classification , 2025 to 2035
  7. Global Market Analysis 2020 to 2024 and Forecast 2025 to 2035, By Application
    • Introduction / Key Findings
    • Historical Market Size Value (USD Million) Analysis By Application, 2020 to 2024
    • Current and Future Market Size Value (USD Million) Analysis and Forecast By Application, 2025 to 2035
      • Pharmaceutical Industry
      • Chemical Industry
      • Food & Beverage
      • Others
    • Y to o to Y Growth Trend Analysis By Application, 2020 to 2024
    • Absolute $ Opportunity Analysis By Application, 2025 to 2035
  8. Global Market Analysis 2020 to 2024 and Forecast 2025 to 2035, By Region
    • Introduction
    • Historical Market Size Value (USD Million) Analysis By Region, 2020 to 2024
    • Current Market Size Value (USD Million) Analysis and Forecast By Region, 2025 to 2035
      • North America
      • Latin America
      • Western Europe
      • Eastern Europe
      • East Asia
      • South Asia and Pacific
      • Middle East & Africa
    • Market Attractiveness Analysis By Region
  9. North America Market Analysis 2020 to 2024 and Forecast 2025 to 2035, By Country
    • Historical Market Size Value (USD Million) Trend Analysis By Market Taxonomy, 2020 to 2024
    • Market Size Value (USD Million) Forecast By Market Taxonomy, 2025 to 2035
      • By Country
        • USA
        • Canada
        • Mexico
      • By Classification
      • By Application
    • Market Attractiveness Analysis
      • By Country
      • By Classification
      • By Application
    • Key Takeaways
  10. Latin America Market Analysis 2020 to 2024 and Forecast 2025 to 2035, By Country
    • Historical Market Size Value (USD Million) Trend Analysis By Market Taxonomy, 2020 to 2024
    • Market Size Value (USD Million) Forecast By Market Taxonomy, 2025 to 2035
      • By Country
        • Brazil
        • Chile
        • Rest of Latin America
      • By Classification
      • By Application
    • Market Attractiveness Analysis
      • By Country
      • By Classification
      • By Application
    • Key Takeaways
  11. Western Europe Market Analysis 2020 to 2024 and Forecast 2025 to 2035, By Country
    • Historical Market Size Value (USD Million) Trend Analysis By Market Taxonomy, 2020 to 2024
    • Market Size Value (USD Million) Forecast By Market Taxonomy, 2025 to 2035
      • By Country
        • Germany
        • UK
        • Italy
        • Spain
        • France
        • Nordic
        • BENELUX
        • Rest of Western Europe
      • By Classification
      • By Application
    • Market Attractiveness Analysis
      • By Country
      • By Classification
      • By Application
    • Key Takeaways
  12. Eastern Europe Market Analysis 2020 to 2024 and Forecast 2025 to 2035, By Country
    • Historical Market Size Value (USD Million) Trend Analysis By Market Taxonomy, 2020 to 2024
    • Market Size Value (USD Million) Forecast By Market Taxonomy, 2025 to 2035
      • By Country
        • Russia
        • Poland
        • Hungary
        • Balkan & Baltic
        • Rest of Eastern Europe
      • By Classification
      • By Application
    • Market Attractiveness Analysis
      • By Country
      • By Classification
      • By Application
    • Key Takeaways
  13. East Asia Market Analysis 2020 to 2024 and Forecast 2025 to 2035, By Country
    • Historical Market Size Value (USD Million) Trend Analysis By Market Taxonomy, 2020 to 2024
    • Market Size Value (USD Million) Forecast By Market Taxonomy, 2025 to 2035
      • By Country
        • China
        • Japan
        • South Korea
      • By Classification
      • By Application
    • Market Attractiveness Analysis
      • By Country
      • By Classification
      • By Application
    • Key Takeaways
  14. South Asia and Pacific Market Analysis 2020 to 2024 and Forecast 2025 to 2035, By Country
    • Historical Market Size Value (USD Million) Trend Analysis By Market Taxonomy, 2020 to 2024
    • Market Size Value (USD Million) Forecast By Market Taxonomy, 2025 to 2035
      • By Country
        • India
        • ASEAN
        • Australia & New Zealand
        • Rest of South Asia and Pacific
      • By Classification
      • By Application
    • Market Attractiveness Analysis
      • By Country
      • By Classification
      • By Application
    • Key Takeaways
  15. Middle East & Africa Market Analysis 2020 to 2024 and Forecast 2025 to 2035, By Country
    • Historical Market Size Value (USD Million) Trend Analysis By Market Taxonomy, 2020 to 2024
    • Market Size Value (USD Million) Forecast By Market Taxonomy, 2025 to 2035
      • By Country
        • Kingdom of Saudi Arabia
        • Other GCC Countries
        • Turkiye
        • South Africa
        • Other African Union
        • Rest of Middle East & Africa
      • By Classification
      • By Application
    • Market Attractiveness Analysis
      • By Country
      • By Classification
      • By Application
    • Key Takeaways
  16. Key Countries Market Analysis
    • USA
      • Pricing Analysis
      • Market Share Analysis, 2024
        • By Classification
        • By Application
    • Canada
      • Pricing Analysis
      • Market Share Analysis, 2024
        • By Classification
        • By Application
    • Mexico
      • Pricing Analysis
      • Market Share Analysis, 2024
        • By Classification
        • By Application
    • Brazil
      • Pricing Analysis
      • Market Share Analysis, 2024
        • By Classification
        • By Application
    • Chile
      • Pricing Analysis
      • Market Share Analysis, 2024
        • By Classification
        • By Application
    • Germany
      • Pricing Analysis
      • Market Share Analysis, 2024
        • By Classification
        • By Application
    • UK
      • Pricing Analysis
      • Market Share Analysis, 2024
        • By Classification
        • By Application
    • Italy
      • Pricing Analysis
      • Market Share Analysis, 2024
        • By Classification
        • By Application
    • Spain
      • Pricing Analysis
      • Market Share Analysis, 2024
        • By Classification
        • By Application
    • France
      • Pricing Analysis
      • Market Share Analysis, 2024
        • By Classification
        • By Application
    • India
      • Pricing Analysis
      • Market Share Analysis, 2024
        • By Classification
        • By Application
    • ASEAN
      • Pricing Analysis
      • Market Share Analysis, 2024
        • By Classification
        • By Application
    • Australia & New Zealand
      • Pricing Analysis
      • Market Share Analysis, 2024
        • By Classification
        • By Application
    • China
      • Pricing Analysis
      • Market Share Analysis, 2024
        • By Classification
        • By Application
    • Japan
      • Pricing Analysis
      • Market Share Analysis, 2024
        • By Classification
        • By Application
    • South Korea
      • Pricing Analysis
      • Market Share Analysis, 2024
        • By Classification
        • By Application
    • Russia
      • Pricing Analysis
      • Market Share Analysis, 2024
        • By Classification
        • By Application
    • Poland
      • Pricing Analysis
      • Market Share Analysis, 2024
        • By Classification
        • By Application
    • Hungary
      • Pricing Analysis
      • Market Share Analysis, 2024
        • By Classification
        • By Application
    • Kingdom of Saudi Arabia
      • Pricing Analysis
      • Market Share Analysis, 2024
        • By Classification
        • By Application
    • Turkiye
      • Pricing Analysis
      • Market Share Analysis, 2024
        • By Classification
        • By Application
    • South Africa
      • Pricing Analysis
      • Market Share Analysis, 2024
        • By Classification
        • By Application
  17. Market Structure Analysis
    • Competition Dashboard
    • Competition Benchmarking
    • Market Share Analysis of Top Players
      • By Regional
      • By Classification
      • By Application
  18. Competition Analysis
    • Competition Deep Dive
      • Thurne
        • Overview
        • Product Portfolio
        • Profitability by Market Segments (Product/Age /Sales Channel/Region)
        • Sales Footprint
        • Strategy Overview
          • Marketing Strategy
          • Product Strategy
          • Channel Strategy
      • Cytiva
      • Sartorius
      • Mettler Toledo
      • Parker
      • Nalgene
      • Repligen
      • Applexion
      • Membrane Solutions
      • Solaris Biotech
      • Pall
      • 3M
  19. Assumptions & Acronyms Used
  20. Research Methodology

List of Tables

  • Table 1: Global Market Value (USD Million) Forecast by Region, 2020 to 2035
  • Table 2: Global Market Value (USD Million) Forecast by Classification , 2020 to 2035
  • Table 3: Global Market Value (USD Million) Forecast by Application, 2020 to 2035
  • Table 4: North America Market Value (USD Million) Forecast by Country, 2020 to 2035
  • Table 5: North America Market Value (USD Million) Forecast by Classification , 2020 to 2035
  • Table 6: North America Market Value (USD Million) Forecast by Application, 2020 to 2035
  • Table 7: Latin America Market Value (USD Million) Forecast by Country, 2020 to 2035
  • Table 8: Latin America Market Value (USD Million) Forecast by Classification , 2020 to 2035
  • Table 9: Latin America Market Value (USD Million) Forecast by Application, 2020 to 2035
  • Table 10: Western Europe Market Value (USD Million) Forecast by Country, 2020 to 2035
  • Table 11: Western Europe Market Value (USD Million) Forecast by Classification , 2020 to 2035
  • Table 12: Western Europe Market Value (USD Million) Forecast by Application, 2020 to 2035
  • Table 13: Eastern Europe Market Value (USD Million) Forecast by Country, 2020 to 2035
  • Table 14: Eastern Europe Market Value (USD Million) Forecast by Classification , 2020 to 2035
  • Table 15: Eastern Europe Market Value (USD Million) Forecast by Application, 2020 to 2035
  • Table 16: East Asia Market Value (USD Million) Forecast by Country, 2020 to 2035
  • Table 17: East Asia Market Value (USD Million) Forecast by Classification , 2020 to 2035
  • Table 18: East Asia Market Value (USD Million) Forecast by Application, 2020 to 2035
  • Table 19: South Asia and Pacific Market Value (USD Million) Forecast by Country, 2020 to 2035
  • Table 20: South Asia and Pacific Market Value (USD Million) Forecast by Classification , 2020 to 2035
  • Table 21: South Asia and Pacific Market Value (USD Million) Forecast by Application, 2020 to 2035
  • Table 22: Middle East & Africa Market Value (USD Million) Forecast by Country, 2020 to 2035
  • Table 23: Middle East & Africa Market Value (USD Million) Forecast by Classification , 2020 to 2035
  • Table 24: Middle East & Africa Market Value (USD Million) Forecast by Application, 2020 to 2035

List of Figures

  • Figure 1: Global Market Pricing Analysis
  • Figure 2: Global Market Value (USD Million) Forecast 2020-2035
  • Figure 3: Global Market Value Share and BPS Analysis by Classification , 2025 and 2035
  • Figure 4: Global Market Y to o to Y Growth Comparison by Classification , 2025-2035
  • Figure 5: Global Market Attractiveness Analysis by Classification
  • Figure 6: Global Market Value Share and BPS Analysis by Application, 2025 and 2035
  • Figure 7: Global Market Y to o to Y Growth Comparison by Application, 2025-2035
  • Figure 8: Global Market Attractiveness Analysis by Application
  • Figure 9: Global Market Value (USD Million) Share and BPS Analysis by Region, 2025 and 2035
  • Figure 10: Global Market Y to o to Y Growth Comparison by Region, 2025-2035
  • Figure 11: Global Market Attractiveness Analysis by Region
  • Figure 12: North America Market Incremental Dollar Opportunity, 2025-2035
  • Figure 13: Latin America Market Incremental Dollar Opportunity, 2025-2035
  • Figure 14: Western Europe Market Incremental Dollar Opportunity, 2025-2035
  • Figure 15: Eastern Europe Market Incremental Dollar Opportunity, 2025-2035
  • Figure 16: East Asia Market Incremental Dollar Opportunity, 2025-2035
  • Figure 17: South Asia and Pacific Market Incremental Dollar Opportunity, 2025-2035
  • Figure 18: Middle East & Africa Market Incremental Dollar Opportunity, 2025-2035
  • Figure 19: North America Market Value Share and BPS Analysis by Country, 2025 and 2035
  • Figure 20: North America Market Value Share and BPS Analysis by Classification , 2025 and 2035
  • Figure 21: North America Market Y to o to Y Growth Comparison by Classification , 2025-2035
  • Figure 22: North America Market Attractiveness Analysis by Classification
  • Figure 23: North America Market Value Share and BPS Analysis by Application, 2025 and 2035
  • Figure 24: North America Market Y to o to Y Growth Comparison by Application, 2025-2035
  • Figure 25: North America Market Attractiveness Analysis by Application
  • Figure 26: Latin America Market Value Share and BPS Analysis by Country, 2025 and 2035
  • Figure 27: Latin America Market Value Share and BPS Analysis by Classification , 2025 and 2035
  • Figure 28: Latin America Market Y to o to Y Growth Comparison by Classification , 2025-2035
  • Figure 29: Latin America Market Attractiveness Analysis by Classification
  • Figure 30: Latin America Market Value Share and BPS Analysis by Application, 2025 and 2035
  • Figure 31: Latin America Market Y to o to Y Growth Comparison by Application, 2025-2035
  • Figure 32: Latin America Market Attractiveness Analysis by Application
  • Figure 33: Western Europe Market Value Share and BPS Analysis by Country, 2025 and 2035
  • Figure 34: Western Europe Market Value Share and BPS Analysis by Classification , 2025 and 2035
  • Figure 35: Western Europe Market Y to o to Y Growth Comparison by Classification , 2025-2035
  • Figure 36: Western Europe Market Attractiveness Analysis by Classification
  • Figure 37: Western Europe Market Value Share and BPS Analysis by Application, 2025 and 2035
  • Figure 38: Western Europe Market Y to o to Y Growth Comparison by Application, 2025-2035
  • Figure 39: Western Europe Market Attractiveness Analysis by Application
  • Figure 40: Eastern Europe Market Value Share and BPS Analysis by Country, 2025 and 2035
  • Figure 41: Eastern Europe Market Value Share and BPS Analysis by Classification , 2025 and 2035
  • Figure 42: Eastern Europe Market Y to o to Y Growth Comparison by Classification , 2025-2035
  • Figure 43: Eastern Europe Market Attractiveness Analysis by Classification
  • Figure 44: Eastern Europe Market Value Share and BPS Analysis by Application, 2025 and 2035
  • Figure 45: Eastern Europe Market Y to o to Y Growth Comparison by Application, 2025-2035
  • Figure 46: Eastern Europe Market Attractiveness Analysis by Application
  • Figure 47: East Asia Market Value Share and BPS Analysis by Country, 2025 and 2035
  • Figure 48: East Asia Market Value Share and BPS Analysis by Classification , 2025 and 2035
  • Figure 49: East Asia Market Y to o to Y Growth Comparison by Classification , 2025-2035
  • Figure 50: East Asia Market Attractiveness Analysis by Classification
  • Figure 51: East Asia Market Value Share and BPS Analysis by Application, 2025 and 2035
  • Figure 52: East Asia Market Y to o to Y Growth Comparison by Application, 2025-2035
  • Figure 53: East Asia Market Attractiveness Analysis by Application
  • Figure 54: South Asia and Pacific Market Value Share and BPS Analysis by Country, 2025 and 2035
  • Figure 55: South Asia and Pacific Market Value Share and BPS Analysis by Classification , 2025 and 2035
  • Figure 56: South Asia and Pacific Market Y to o to Y Growth Comparison by Classification , 2025-2035
  • Figure 57: South Asia and Pacific Market Attractiveness Analysis by Classification
  • Figure 58: South Asia and Pacific Market Value Share and BPS Analysis by Application, 2025 and 2035
  • Figure 59: South Asia and Pacific Market Y to o to Y Growth Comparison by Application, 2025-2035
  • Figure 60: South Asia and Pacific Market Attractiveness Analysis by Application
  • Figure 61: Middle East & Africa Market Value Share and BPS Analysis by Country, 2025 and 2035
  • Figure 62: Middle East & Africa Market Value Share and BPS Analysis by Classification , 2025 and 2035
  • Figure 63: Middle East & Africa Market Y to o to Y Growth Comparison by Classification , 2025-2035
  • Figure 64: Middle East & Africa Market Attractiveness Analysis by Classification
  • Figure 65: Middle East & Africa Market Value Share and BPS Analysis by Application, 2025 and 2035
  • Figure 66: Middle East & Africa Market Y to o to Y Growth Comparison by Application, 2025-2035
  • Figure 67: Middle East & Africa Market Attractiveness Analysis by Application
  • Figure 68: Global Market - Tier Structure Analysis
  • Figure 69: Global Market - Company Share Analysis

Frequently Asked Questions

How big is the normal flow filtration products market in 2025?

The global normal flow filtration products market is estimated to be valued at USD 640.2 million in 2025.

What will be the size of normal flow filtration products market in 2035?

The market size for the normal flow filtration products market is projected to reach USD 1,062.8 million by 2035.

How much will be the normal flow filtration products market growth between 2025 and 2035?

The normal flow filtration products market is expected to grow at a 5.2% CAGR between 2025 and 2035.

What are the key product types in the normal flow filtration products market?

The key product types in normal flow filtration products market are microporous filtration membrane, depth filtration media and others.

Which application segment to contribute significant share in the normal flow filtration products market in 2025?

In terms of application, pharmaceutical industry segment to command 48.0% share in the normal flow filtration products market in 2025.

Explore Similar Insights

Future Market Insights

Normal Flow Filtration Products Market

Chat With

MaRIA

Hi There, I am MaRIA, Your Market Research Intelligence Assistant. How may I help you?