Omega-3 in Animal Feed Market Size, Share, and Forecast Outlook 2025 to 2035

The omega-3 in animal feed market is projected to rise from USD 678.2 million in 2025 to USD 987.2 million by 2035, registering a CAGR of 3.7% during the forecast period. Annual gains show a steady upward trend, starting at USD 25.1 million in 2026 and reaching USD 34.8 million by 2035.
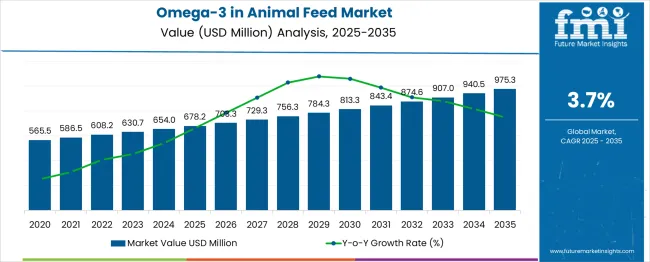
Quick Stats in Omega-3 in Animal Feed Market

  • Omega-3 in Animal Feed Market Size (2025): USD 678.2 million
  • Projected Omega-3 in Animal Feed Market (2035): USD 987.2 million
  • Forecast CAGR of Omega-3 in Animal Feed Market (2025 to 2035): 3.7%
  • Leading Segment by Source Type of Omega-3 in Animal Feed Market (2025): Fish Oil (38.7%)
  • Fastest Growing Country in Omega-3 in Animal Feed Market (2025): Germany (4.9% CAGR)
  • Top Key Players in Omega-3 in Animal Feed Market: DSM-Firmenich, Cargill, Archer Daniels Midland, Alltech, BASF

Omega 3 In Animal Feed Market Market Value Analysis

Metric Value
Industry Size (2025E) USD 678.2 million
Industry Value (2035F) USD 987.2 million
CAGR (2025 to 2035) 3.7%

This growth pattern reflects increasing awareness of the nutritional benefits of omega-3 fatty acids for livestock, poultry, aquaculture, and companion animals. Omega-3 inclusion in feed is associated with improved immunity, enhanced fertility, and better overall productivity, making it a valuable additive in both commercial and specialty feed blends.

As sustainable omega-3 sources such as algae oils gain traction and regulatory frameworks become more nutrition-friendly, the market is expected to accelerate further beyond 2030.

The Omega-3 in Animal Feed Market accounts for approximately 3.5-4.5% of the global animal feed additives market, which is valued at over USD 45 billion as of 2025. The inclusion of omega-3, especially in aquafeed, pet food, and premium livestock diets, is rising due to growing awareness of animal welfare, feed-to-food quality transfer, and sustainability concerns.

In aquaculture alone, omega-3-rich feed formulations dominate over 15% of nutritional input costs due to the need for DHA and EPA in fish development. The functional feed ingredients segment, worth over USD 12 billion, is increasingly allocating 5-6% of its value to omega-3 inclusion. Pet nutrition brands are also boosting omega-3 content to address inflammation, cognition, and coat health, further expanding its share in specialized feeds.

Omega-3 in Animal Feed Market by Top Investment Segments

Demand for Omega-3 in animal feed is being driven by fish oil-based formulations, oil product formats, and compound feed applications. Aquaculture leads animal type usage, while feed integrators remain the most strategic sales channel for industry players.
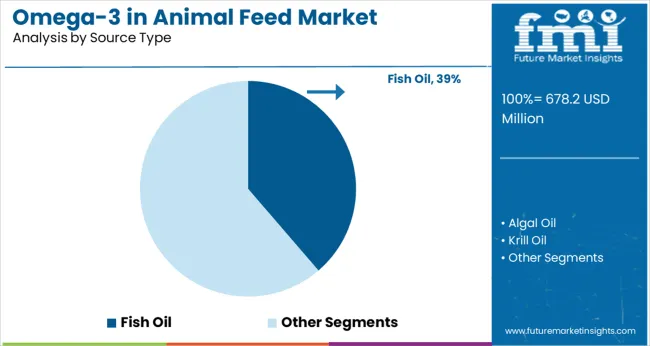
Fish Oil Leads the Way in Omega-3 Sourcing

Omega 3 In Animal Feed Market Analysis By Source Type

Fish oil remains the primary source in the Omega-3 in animal feed market, holding a 38.7% value share in 2025. Its rich EPA and DHA content makes it indispensable for high-performance animal nutrition, especially in aquaculture and livestock health applications. Feed manufacturers are increasingly favoring fish oil due to its digestibility and proven efficacy in promoting growth and immunity.
  • Consistent supply chains in Peru and Norway support fish oil extraction.
  • Sustainability certifications like MSC are boosting adoption in premium feed.
  • Aquaculture remains the largest end-use segment for fish oil Omega-3s.

Aquaculture Drives Animal Type Utilization

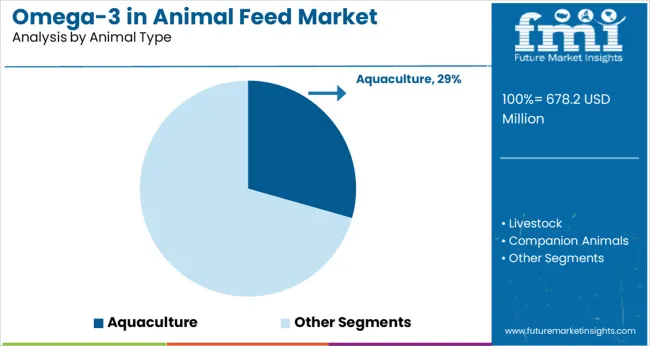
Omega 3 In Animal Feed Market Analysis By Animal Type

Aquaculture is projected to hold a 29.4% share by 2025, positioning it as a dominant end-use for Omega-3 enriched feeds. Nutritional enrichment using fish-based Omega-3s in shrimp, salmon, and trout farming has become essential to meet global seafood demand. Regulatory mandates on feed quality and omega inclusion in Asia-Pacific and Europe are shaping this trend.
  • Salmonids account for a majority share in aquaculture Omega-3 feed use.
  • Growth is driven by rising exports from Norway, Chile, and Vietnam.
  • Feed conversions improve significantly with consistent Omega-3 supplementation.

Oil Format Maintains Preference Among Feed Manufacturers

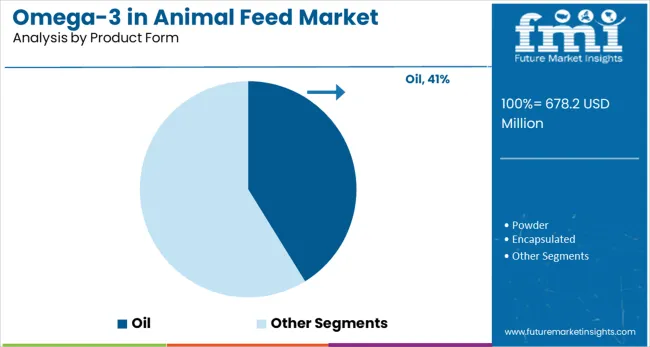
Omega 3 In Animal Feed Market Analysis By Product Form

Oil-based Omega-3 formulations dominate with a 41.2% share in 2025. Feed producers prefer oil over powder due to better nutrient retention and improved palatability in animal diets. Cold-pressed and microencapsulated fish oils are gaining momentum, offering better oxidation stability.
  • Liquid oils integrate efficiently in pelleted and extruded feed formats.
  • Temperature-sensitive oil variants are used in precision aquaculture.
  • Packaging innovations reduce oxidation during storage and transport.

Growth Promotion Emerges as Key Application Focus

Omega 3 In Animal Feed Market Analysis By Application

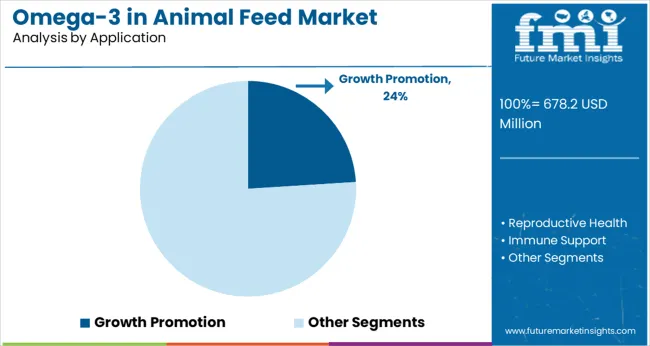
Growth promotion applications represent 24% of the Omega-3 in animal feed market in 2025. Omega-3 fatty acids play a pivotal role in metabolic efficiency, weight gain, and overall productivity in livestock and aquatic species. Functional formulations aimed at improving feed conversion ratios are seeing wider usage in emerging economies.
  • Trials show faster fish growth and reduced mortality with Omega-3 inclusion.
  • Poultry and piglet starters are being reformulated for enhanced daily gain.
  • Higher ROI for producers accelerates Omega-3 feed adoption across Asia.

Feed Integrators Dominate Sales Channel Distribution

Omega 3 In Animal Feed Market Analysis By Sales Channel

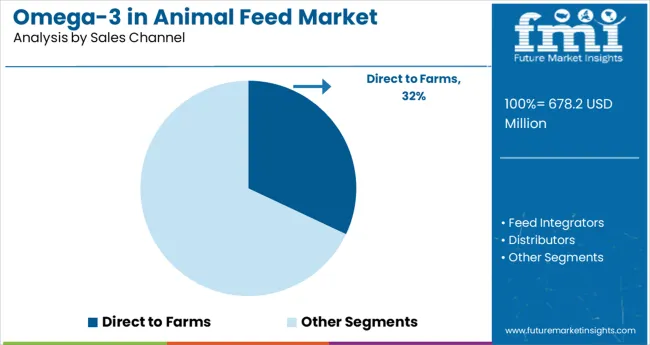
Feed integrators are forecasted to command 32% of sales by 2025, driven by their control over both formulation and distribution. These vertically integrated players ensure consistent Omega-3 sourcing and dosage accuracy, especially in aquaculture and poultry segments. Partnerships with marine oil suppliers are reshaping the competitive landscape.
  • Top integrators in India, China, and Europe are scaling Omega-3 offerings.
  • In-house R&D drives demand for customized Omega-3 blends.
  • Procurement contracts with fisheries offer long-term cost benefits.

Compound Feed Format Gains Strong Momentum

Omega 3 In Animal Feed Market Analysis By End Use Format

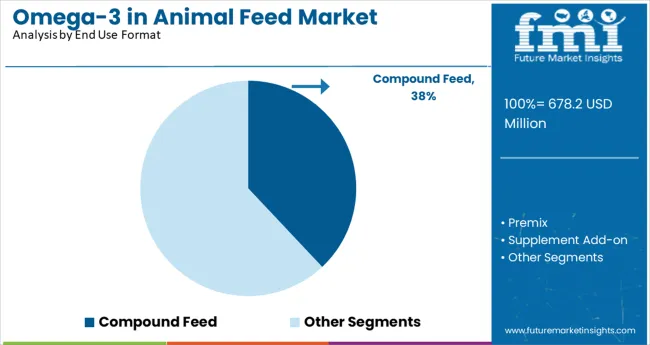
Compound feed is expected to account for 38% of market value, reflecting a growing demand for ready-to-use, nutritionally balanced formulations. Omega-3s in compound feed provide standardized dosing, better digestibility, and lower nutrient loss. This trend is especially pronounced in regions with organized farming and high-value animal protein exports.

  • Compound feed penetration in aquaculture boosts Omega-3 stability.
  • Regulatory alignment supports fortified feed production in Europe.
  • Custom premix solutions are being bundled with Omega-3 oils.

Top Omega-3 in Animal Feed Market Dynamics

Rising focus on animal immunity, reproductive health, and enriched end-products is propelling omega-3 inclusion in feed. Algal and flax-based sources are replacing fish oil in poultry, swine, and aquaculture. Feed millers are leveraging encapsulation and stabilized formats to ensure dosage accuracy, shelf life, and oxidative stability under intensive farm conditions.

Algae-Based DHA Gains Ground in Layer and Broiler Feed

In 2025, algal DHA inclusion in poultry feed rose 44%, driven by demand for omega-3-enriched eggs and improved flock health. Layer farms using 0.5% DHA-rich algae in mash feed achieved a 28% increase in egg DHA content and an 11% higher hatchability rate. Broiler integrators observed a 17% reduction in feed conversion ratio(FCR) when algal omega-3s were combined with vitamin E.

Shelf-stable powdered formats outperformed fish oil in tropical climates, reducing oxidation losses by 36%. As fish oil prices climbed 14% YoY, algae suppliers secured multi-year contracts with EU and APAC egg producers, signaling long-term substitution in omega-enrichment strategies.

Omega-3 Fortification Expands in Aquafeed Formulations

Omega-3 inclusion in aquafeed grew 39% in 2025, especially in salmonid, tilapia, and shrimp diets. Encapsulated EPA-DHA blends extended feed shelf life by 21% and enabled consistent deposition in fillets, boosting DHA levels in farmed salmon by 33% over 2020 baselines. Plant-based omega-3s from flax and canola now contribute up to 45% of total inclusion in cold-water species diets. Pellet stability and water leaching were improved by 18% with microencapsulated forms, reducing feed wastage. Feed mills in Norway and Chile adopted omega-3 blends tailored to water temperature and lifecycle stage, supporting higher yields and better flesh quality for export markets.
Top Countries Enhancing, Fortifying, and Scaling Omega-3 in Animal Feed

Omega 3 In Animal Feed Market Cagr Analysis By Country

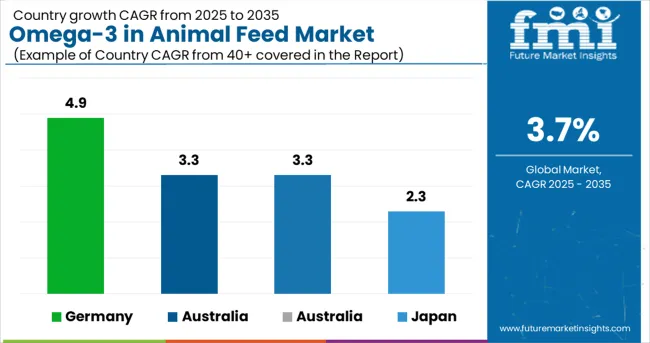
The global omega-3 in animal feed market is anticipated to grow at a CAGR of 3.7% between 2025 and 2035, driven by demand for enriched livestock nutrition and improved animal health outcomes. Germany stands out with a projected CAGR of 4.9%, outperforming the global average due to robust regulatory support for functional additives in EU agriculture and strong investments in feed innovation.

The United States and Australia are expected to grow at 3.3%, slightly below the global pace, as market penetration for omega-3 formulations continues in poultry and aquaculture segments. Japan, trails with a CAGR of 2.3%, influenced by stagnant livestock production volumes and limited innovation cycles in feed applications.

As OECD markets mature, growth will hinge on value-added formulations and sustainability-driven sourcing, while emerging BRICS and ASEAN economies present long-term potential for scaling omega-3 inclusion across feed categories.

The report provides insights across 40+ countries. The four below are highlighted for their strategic influence and growth trajectory.

Countries CAGR(2025 to 2035)
Germany 4.9%
Australia 3.3%
United States 3.3%
Japan 2.3%

Surge in Demand for Omega-3 in Animal Feed Market across Germany

Germany’s market is set to register a CAGR of 4.9% from 2025 to 2035. During 2020-2024, demand surged in swine and poultry segments due to consumer push for nutrient-dense animal products. The outlook remains strong as regulations in the EU promote the use of Omega-3 in enhancing animal welfare and product quality.

  • Feed mills are optimizing Omega-3 content to align with EFSA guidelines
  • Sales of Omega-3 in Animal Feed are growing in premium meat production chains
  • Algal oil and flaxseed-based formulations are replacing marine-sourced inputs

Sustainable Sourcing Driving Omega-3 in Animal Feed Market in Australia

The market in Australia is forecasted to grow at a CAGR of 3.3% through 2035. From 2020 to 2024, adoption rose in the beef and poultry sectors, especially among organic and grass-fed producers. Future demand for Omega-3 in Animal Feed will be supported by a shift toward eco-friendly feed additives and rising functional meat exports.

  • Sales of Omega-3 in Animal Feed are up in pasture-raised livestock programs
  • Marine Omega-3 inputs are being replaced by flaxseed and canola oils
  • Government-funded research is exploring Omega-3 enrichment in ruminant nutrition

Growth Opportunities for Omega-3 in Animal Feed Market in the United States

The USA market is projected to expand at a CAGR of 3.3% through 2035. Between 2020 and 2024, demand for Omega-3 in Animal Feed increased, driven by the need for enhancing immunity and reproduction in livestock and aquaculture. Over the next decade, the market will benefit from the integration of algae-based Omega-3 into poultry and dairy feed.

  • Sales of Omega-3 in Animal Feed are supported by sustainable sourcing strategies
  • Growth in specialty livestock diets is pushing demand for DHA and EPA blends
  • USDA-backed studies are encouraging adoption in ruminant health applications

Japan’s Omega-3 in Animal Feed Market Adapts to Aquaculture Needs

Japan is expected to post a CAGR of 2.3% through 2035. Between 2020 and 2024, the market showed steady use in aquafeed, especially in salmon farming. Moving ahead, demand for Omega-3 in Animal Feed will grow moderately as domestic aquaculture integrates higher EPA/DHA content to meet export quality standards.
  • Sales of Omega-3 in Animal Feed are driven by fisheries modernization policies
  • Algae-derived sources are gaining preference due to marine sustainability issues
  • Niche animal feed brands are formulating functional feeds for fish hatcheries

Leading Omega-3 in Animal Feed Distributors

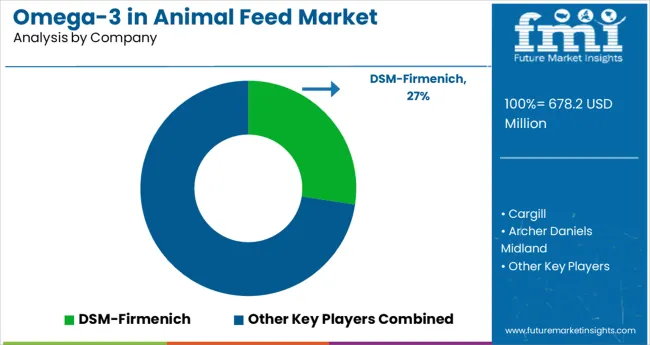
Omega 3 In Animal Feed Market Analysis By Company

The Omega-3 in Animal Feed market is led by a concentrated group of players, with DSM-Firmenich at the forefront due to its proprietary Veramaris algal-based omega-3 oils, accounting for approximately 27.4% of global supply in 2025. Cargill follows closely, holding a 22.1% share through its EWOS and Aqua Nutrition divisions, emphasizing fishmeal alternatives and EPA-DHA rich blends.

ADM Animal Nutrition captures 18.6% of the market, focusing on vertically integrated omega-3 formulations across poultry and swine. Alltech commands 14.9%, driven by innovation in flaxseed-derived omega-3s and regional supply chains. BASF, while no longer directly involved in Veramaris, retains an 11.2% share through its specialty nutrition solutions and strategic partnerships.

Recent Omega-3 in Animal Feed Industry News

  • In April 2024, DSM-Firmenich launched Veramaris® Pets and DHAgold™ at the Petfood Forum. Both are algae-based omega-3 solutions for pets, designed to support cognitive and heart health. This expansion reinforces DSM’s leadership in sustainable, non-fish-derived omega-3s in the animal feed and companion animal nutrition markets.

Leading Players in Omega-3 in Animal Feed Market

  • DSM-Firmenich
  • Cargill
  • Archer Daniels Midland
  • Alltech
  • BASF

Report Coverage and Scope Summary

Report Attributes Details
Industry Size(2025) USD 678.2 million
Projected Industry Size(2035) USD 987.2 million
CAGR(2025 to 2035) 3.7%
Base Year for Estimation 2024
Historical Period 2020 to 2024
Projections Period 2025 to 2035
Quantitative Units USD million for value
Source Types Analyzed(Segment 1) Fish Oil, Algal Oil, Krill Oil, Flaxseed Oil, Canola Oil, Chia Seed Oil, Camelina Oil, Other Plant-Based Sources
Animal Types Analyzed(Segment 2) Livestock(Poultry, Swine, Ruminants), Aquaculture(Salmonids, Tilapia, Catfish, Shrimp), Companion Animals(Dogs, Cats), Equine, Exotic/Zoo Animals
Product Forms Analyzed(Segment 3) Oil, Powder, Encapsulated(Microencapsulated), Emulsified Liquid, Meal
Applications Analyzed(Segment 4) Growth Promotion, Reproductive Health, Immune Support, Meat/Dairy/Fish Quality Enhancement, Brain & Vision Development, Anti-inflammatory Support
Sales Channels Analyzed(Segment 5) Direct to Farms, Feed Integrators, Distributors, Veterinary Clinics, Online/B2B Portals
End Use Formats Analyzed(Segment 6) Compound Feed, Premix, Supplement Add-on, TMR(Total Mixed Ration), Customized Diet Formulation
Regions Covered North America, Latin America, Western Europe, Eastern Europe, East Asia, South Asia & Pacific
Countries Covered United States, Canada, Germany, United Kingdom, France, Italy, Spain, China, India, Japan, South Korea, Australia, Brazil, Mexico, Argentina, Saudi Arabia, UAE, South Africa
Key Players DSM- Firmenich, Cargill, Archer Daniels Midland, Alltech, BASF
Additional Attributes Dollar sales supported by increasing aquafeed inclusion, segment diversification across species, shift toward algal-based EPA/DHA sources, and rising B2B custom formulation demand

Omega-3 in Animal Feed Market Analyzed by Key Investment Segments

By Source Type:

Includes fish oil, algal oil, krill oil, flaxseed oil, canola oil, chia seed oil, camelina oil, and other plant-based sources.

By Animal Type:

Covers livestock(poultry, swine, ruminants), aquaculture (salmonids, tilapia, catfish, shrimp), companion animals (dogs, cats), equine, and exotic/zoo animals.

By Product Form:

Available forms include oil, powder, encapsulated (microencapsulated), emulsified liquid, and meal.

By Application:

Applications span growth promotion, reproductive health, immune support, meat/dairy/fish quality enhancement, brain & vision development, and anti-inflammatory support.

By Sales Channel:

Distributed through direct to farms, feed integrators, distributors, veterinary clinics, and online/B2B portals.

By End Use Format:

Used in compound feed, premix, supplement add-on, TMR (total mixed ration), and customized diet formulation.

By Region:

Includes North America, Latin America, East Asia, South Asia & Pacific, Eastern Europe, and Western Europe.

Table of Content

  1. Executive Summary
    • Global Market Outlook
    • Demand-side Trends
    • Supply-side Trends
    • Technology Roadmap Analysis
    • Analysis and Recommendations
  2. Market Overview
    • Market Coverage / Taxonomy
    • Market Definition / Scope / Limitations
  3. Market Background
    • Market Dynamics
      • Drivers
      • Restraints
      • Opportunity
      • Trends
    • Scenario Forecast
      • Demand in Optimistic Scenario
      • Demand in Likely Scenario
      • Demand in Conservative Scenario
    • Opportunity Map Analysis
    • Product Life Cycle Analysis
    • Supply Chain Analysis
      • Supply Side Participants and their Roles
        • Producers
        • Mid-Level Participants (Traders/ Agents/ Brokers)
        • Wholesalers and Distributors
      • Value Added and Value Created at Node in the Supply Chain
      • List of Raw Material Suppliers
      • List of Existing and Potential Buyer’s
    • Investment Feasibility Matrix
    • Value Chain Analysis
      • Profit Margin Analysis
      • Wholesalers and Distributors
      • Retailers
    • PESTLE and Porter’s Analysis
    • Regulatory Landscape
      • By Key Regions
      • By Key Countries
    • Regional Parent Market Outlook
    • Production and Consumption Statistics
    • Import and Export Statistics
  4. Global Market Analysis 2020 to 2024 and Forecast, 2025 to 2035
    • Historical Market Size Value (USD Million) & Volume (MT) Analysis, 2020 to 2024
    • Current and Future Market Size Value (USD Million) & Volume (MT) Projections, 2025 to 2035
      • Y-o-Y Growth Trend Analysis
      • Absolute $ Opportunity Analysis
  5. Global Market Pricing Analysis 2020 to 2024 and Forecast 2025 to 2035
  6. Global Market Analysis 2020 to 2024 and Forecast 2025 to 2035, By Source Type
    • Introduction / Key Findings
    • Historical Market Size Value (USD Million) & Volume (MT) Analysis By Source Type, 2020 to 2024
    • Current and Future Market Size Value (USD Million) & Volume (MT) Analysis and Forecast By Source Type, 2025 to 2035
      • Fish Oil
      • Algal Oil
      • Krill Oil
      • Flaxseed Oil
      • Canola Oil
      • Chia Seed Oil
      • Camelina Oil
      • Other Plant-Based Sources
    • Y-o-Y Growth Trend Analysis By Source Type, 2020 to 2024
    • Absolute $ Opportunity Analysis By Source Type, 2025 to 2035
  7. Global Market Analysis 2020 to 2024 and Forecast 2025 to 2035, By Animal Type
    • Introduction / Key Findings
    • Historical Market Size Value (USD Million) & Volume (MT) Analysis By Animal Type, 2020 to 2024
    • Current and Future Market Size Value (USD Million) & Volume (MT) Analysis and Forecast By Animal Type, 2025 to 2035
      • Livestock
        • Poultry
        • Swine
        • Ruminants
      • Aquaculture
        • Salmonids
        • Tilapia
        • Catfish
        • Shrimp
      • Companion Animals
        • Dogs
        • Cats
      • Equine
      • Exotic/Zoo Animals
    • Y-o-Y Growth Trend Analysis By Animal Type, 2020 to 2024
    • Absolute $ Opportunity Analysis By Animal Type, 2025 to 2035
  8. Global Market Analysis 2020 to 2024 and Forecast 2025 to 2035, By Product Form
    • Introduction / Key Findings
    • Historical Market Size Value (USD Million) & Volume (MT) Analysis By Product Form, 2020 to 2024
    • Current and Future Market Size Value (USD Million) & Volume (MT) Analysis and Forecast By Product Form, 2025 to 2035
      • Oil
      • Powder
      • Encapsulated
        • Microencapsulated
      • Emulsified Liquid
      • Meal
    • Y-o-Y Growth Trend Analysis By Product Form, 2020 to 2024
    • Absolute $ Opportunity Analysis By Product Form, 2025 to 2035
  9. Global Market Analysis 2020 to 2024 and Forecast 2025 to 2035, By Application
    • Introduction / Key Findings
    • Historical Market Size Value (USD Million) & Volume (MT) Analysis By Application, 2020 to 2024
    • Current and Future Market Size Value (USD Million) & Volume (MT) Analysis and Forecast By Application, 2025 to 2035
      • Growth Promotion
      • Reproductive Health
      • Immune Support
      • Meat/Dairy/Fish Quality Enhancement
      • Brain & Vision Development
      • Anti-inflammatory Support
    • Y-o-Y Growth Trend Analysis By Application, 2020 to 2024
    • Absolute $ Opportunity Analysis By Application, 2025 to 2035
  10. Global Market Analysis 2020 to 2024 and Forecast 2025 to 2035, By Sales Channel
    • Introduction / Key Findings
    • Historical Market Size Value (USD Million) & Volume (MT) Analysis By Sales Channel, 2020 to 2024
    • Current and Future Market Size Value (USD Million) & Volume (MT) Analysis and Forecast By Sales Channel, 2025 to 2035
      • Direct to Farms
      • Feed Integrators
      • Distributors
      • Veterinary Clinics
      • Online/B2B Portals
    • Y-o-Y Growth Trend Analysis By Sales Channel, 2020 to 2024
    • Absolute $ Opportunity Analysis By Sales Channel, 2025 to 2035
  11. Global Market Analysis 2020 to 2024 and Forecast 2025 to 2035, By End Use Format
    • Introduction / Key Findings
    • Historical Market Size Value (USD Million) & Volume (MT) Analysis By End Use Format, 2020 to 2024
    • Current and Future Market Size Value (USD Million) & Volume (MT) Analysis and Forecast By End Use Format, 2025 to 2035
      • Compound Feed
      • Premix
      • Supplement Add-on
      • TMR (Total Mixed Ration)
      • Customized Diet Formulation
    • Y-o-Y Growth Trend Analysis By End Use Format, 2020 to 2024
    • Absolute $ Opportunity Analysis By End Use Format, 2025 to 2035
  12. Global Market Analysis 2020 to 2024 and Forecast 2025 to 2035, By Region
    • Introduction
    • Historical Market Size Value (USD Million) & Volume (MT) Analysis By Region, 2020 to 2024
    • Current Market Size Value (USD Million) & Volume (MT) Analysis and Forecast By Region, 2025 to 2035
      • North America
      • Latin America
      • Western Europe
      • Eastern Europe
      • East Asia
      • South Asia & Pacific
      • Middle East and Africa
    • Market Attractiveness Analysis By Region
  13. North America Market Analysis 2020 to 2024 and Forecast 2025 to 2035, By Country
    • Historical Market Size Value (USD Million) & Volume (MT) Trend Analysis By Market Taxonomy, 2020 to 2024
    • Market Size Value (USD Million) & Volume (MT) Forecast By Market Taxonomy, 2025 to 2035
      • By Country
        • USA
        • Canada
        • Mexico
      • By Source Type
      • By Animal Type
      • By Product Form
      • By Application
      • By Sales Channel
      • By End Use Format
    • Market Attractiveness Analysis
      • By Country
      • By Source Type
      • By Animal Type
      • By Product Form
      • By Application
      • By Sales Channel
      • By End Use Format
    • Key Takeaways
  14. Latin America Market Analysis 2020 to 2024 and Forecast 2025 to 2035, By Country
    • Historical Market Size Value (USD Million) & Volume (MT) Trend Analysis By Market Taxonomy, 2020 to 2024
    • Market Size Value (USD Million) & Volume (MT) Forecast By Market Taxonomy, 2025 to 2035
      • By Country
        • Brazil
        • Argentina
        • Rest of LATAM
      • By Source Type
      • By Animal Type
      • By Product Form
      • By Application
      • By Sales Channel
      • By End Use Format
    • Market Attractiveness Analysis
      • By Country
      • By Source Type
      • By Animal Type
      • By Product Form
      • By Application
      • By Sales Channel
      • By End Use Format
    • Key Takeaways
  15. Western Europe Market Analysis 2020 to 2024 and Forecast 2025 to 2035, By Country
    • Historical Market Size Value (USD Million) & Volume (MT) Trend Analysis By Market Taxonomy, 2020 to 2024
    • Market Size Value (USD Million) & Volume (MT) Forecast By Market Taxonomy, 2025 to 2035
      • By Country
        • Germany
        • Italy
        • France
        • UK
        • Spain
        • BENELUX
        • Nordic
        • Rest of W.Europe
      • By Source Type
      • By Animal Type
      • By Product Form
      • By Application
      • By Sales Channel
      • By End Use Format
    • Market Attractiveness Analysis
      • By Country
      • By Source Type
      • By Animal Type
      • By Product Form
      • By Application
      • By Sales Channel
      • By End Use Format
    • Key Takeaways
  16. Eastern Europe Market Analysis 2020 to 2024 and Forecast 2025 to 2035, By Country
    • Historical Market Size Value (USD Million) & Volume (MT) Trend Analysis By Market Taxonomy, 2020 to 2024
    • Market Size Value (USD Million) & Volume (MT) Forecast By Market Taxonomy, 2025 to 2035
      • By Country
        • Russia
        • Hungary
        • Poland
        • Balkan & Baltics
        • Rest of E. Europe
      • By Source Type
      • By Animal Type
      • By Product Form
      • By Application
      • By Sales Channel
      • By End Use Format
    • Market Attractiveness Analysis
      • By Country
      • By Source Type
      • By Animal Type
      • By Product Form
      • By Application
      • By Sales Channel
      • By End Use Format
    • Key Takeaways
  17. East Asia Market Analysis 2020 to 2024 and Forecast 2025 to 2035, By Country
    • Historical Market Size Value (USD Million) & Volume (MT) Trend Analysis By Market Taxonomy, 2020 to 2024
    • Market Size Value (USD Million) & Volume (MT) Forecast By Market Taxonomy, 2025 to 2035
      • By Country
        • China
        • Japan
        • South Korea
      • By Source Type
      • By Animal Type
      • By Product Form
      • By Application
      • By Sales Channel
      • By End Use Format
    • Market Attractiveness Analysis
      • By Country
      • By Source Type
      • By Animal Type
      • By Product Form
      • By Application
      • By Sales Channel
      • By End Use Format
    • Key Takeaways
  18. South Asia & Pacific Market Analysis 2020 to 2024 and Forecast 2025 to 2035, By Country
    • Historical Market Size Value (USD Million) & Volume (MT) Trend Analysis By Market Taxonomy, 2020 to 2024
    • Market Size Value (USD Million) & Volume (MT) Forecast By Market Taxonomy, 2025 to 2035
      • By Country
        • India
        • Australia & New Zealand
        • ASEAN
        • Rest of SAP
      • By Source Type
      • By Animal Type
      • By Product Form
      • By Application
      • By Sales Channel
      • By End Use Format
    • Market Attractiveness Analysis
      • By Country
      • By Source Type
      • By Animal Type
      • By Product Form
      • By Application
      • By Sales Channel
      • By End Use Format
    • Key Takeaways
  19. Middle East and Africa Market Analysis 2020 to 2024 and Forecast 2025 to 2035, By Country
    • Historical Market Size Value (USD Million) & Volume (MT) Trend Analysis By Market Taxonomy, 2020 to 2024
    • Market Size Value (USD Million) & Volume (MT) Forecast By Market Taxonomy, 2025 to 2035
      • By Country
        • GCC Countries
        • Northern Africa
        • South Africa
        • Turkiye
        • Rest of MEA
      • By Source Type
      • By Animal Type
      • By Product Form
      • By Application
      • By Sales Channel
      • By End Use Format
    • Market Attractiveness Analysis
      • By Country
      • By Source Type
      • By Animal Type
      • By Product Form
      • By Application
      • By Sales Channel
      • By End Use Format
    • Key Takeaways
  20. Key Countries Market Analysis
    • USA
      • Pricing Analysis
      • Market Share Analysis, 2024
        • By Source Type
        • By Animal Type
        • By Product Form
        • By Application
        • By Sales Channel
        • By End Use Format
    • Canada
      • Pricing Analysis
      • Market Share Analysis, 2024
        • By Source Type
        • By Animal Type
        • By Product Form
        • By Application
        • By Sales Channel
        • By End Use Format
    • Brazil
      • Pricing Analysis
      • Market Share Analysis, 2024
        • By Source Type
        • By Animal Type
        • By Product Form
        • By Application
        • By Sales Channel
        • By End Use Format
    • Mexico
      • Pricing Analysis
      • Market Share Analysis, 2024
        • By Source Type
        • By Animal Type
        • By Product Form
        • By Application
        • By Sales Channel
        • By End Use Format
    • Argentina
      • Pricing Analysis
      • Market Share Analysis, 2024
        • By Source Type
        • By Animal Type
        • By Product Form
        • By Application
        • By Sales Channel
        • By End Use Format
  21. Market Structure Analysis
    • Competition Dashboard
    • Competition Benchmarking
    • Market Share Analysis of Top Players
      • By Regional
      • By Source Type
      • By Animal Type
      • By Product Form
      • By Application
      • By Sales Channel
      • By End Use Format
  22. Competition Analysis
    • Competition Deep Dive
      • DSM-Firmenich
        • Overview
        • Product Portfolio
        • Profitability by Market Segments (Product/Age /Sales Channel/Region)
        • Sales Footprint
        • Strategy Overview
          • Marketing Strategy
          • Product Strategy
          • Channel Strategy
      • Cargill
        • Overview
        • Product Portfolio
        • Profitability by Market Segments (Product/Age /Sales Channel/Region)
        • Sales Footprint
        • Strategy Overview
          • Marketing Strategy
          • Product Strategy
          • Channel Strategy
      • Archer Daniels Midland
        • Overview
        • Product Portfolio
        • Profitability by Market Segments (Product/Age /Sales Channel/Region)
        • Sales Footprint
        • Strategy Overview
          • Marketing Strategy
          • Product Strategy
          • Channel Strategy
      • Alltech
        • Overview
        • Product Portfolio
        • Profitability by Market Segments (Product/Age /Sales Channel/Region)
        • Sales Footprint
        • Strategy Overview
          • Marketing Strategy
          • Product Strategy
          • Channel Strategy
      • BASF
        • Overview
        • Product Portfolio
        • Profitability by Market Segments (Product/Age /Sales Channel/Region)
        • Sales Footprint
        • Strategy Overview
          • Marketing Strategy
          • Product Strategy
          • Channel Strategy
  23. Assumptions & Acronyms Used
  24. Research Methodology

List of Tables

  • Table 1: Global Market Value (USD Million) Forecast by Region, 2020-2035
  • Table 2: Global Market Volume (MT) Forecast by Region, 2020-2035
  • Table 3: Global Market Value (USD Million) Forecast by Source Type, 2020-2035
  • Table 4: Global Market Volume (MT) Forecast by Source Type, 2020-2035
  • Table 5: Global Market Value (USD Million) Forecast by Animal Type, 2020-2035
  • Table 6: Global Market Volume (MT) Forecast by Animal Type, 2020-2035
  • Table 7: Global Market Value (USD Million) Forecast by Product Form, 2020-2035
  • Table 8: Global Market Volume (MT) Forecast by Product Form, 2020-2035
  • Table 9: Global Market Value (USD Million) Forecast by Application, 2020-2035
  • Table 10: Global Market Volume (MT) Forecast by Application, 2020-2035
  • Table 11: Global Market Value (USD Million) Forecast by Sales Channel, 2020-2035
  • Table 12: Global Market Volume (MT) Forecast by Sales Channel, 2020-2035
  • Table 13: Global Market Value (USD Million) Forecast by End Use Format, 2020-2035
  • Table 14: Global Market Volume (MT) Forecast by End Use Format, 2020-2035
  • Table 15: North America Market Value (USD Million) Forecast by Country, 2020-2035
  • Table 16: North America Market Volume (MT) Forecast by Country, 2020-2035
  • Table 17: North America Market Value (USD Million) Forecast by Source Type, 2020-2035
  • Table 18: North America Market Volume (MT) Forecast by Source Type, 2020-2035
  • Table 19: North America Market Value (USD Million) Forecast by Animal Type, 2020-2035
  • Table 20: North America Market Volume (MT) Forecast by Animal Type, 2020-2035
  • Table 21: North America Market Value (USD Million) Forecast by Product Form, 2020-2035
  • Table 22: North America Market Volume (MT) Forecast by Product Form, 2020-2035
  • Table 23: North America Market Value (USD Million) Forecast by Application, 2020-2035
  • Table 24: North America Market Volume (MT) Forecast by Application, 2020-2035
  • Table 25: North America Market Value (USD Million) Forecast by Sales Channel, 2020-2035
  • Table 26: North America Market Volume (MT) Forecast by Sales Channel, 2020-2035
  • Table 27: North America Market Value (USD Million) Forecast by End Use Format, 2020-2035
  • Table 28: North America Market Volume (MT) Forecast by End Use Format, 2020-2035
  • Table 29: Latin America Market Value (USD Million) Forecast by Country, 2020-2035
  • Table 30: Latin America Market Volume (MT) Forecast by Country, 2020-2035
  • Table 31: Latin America Market Value (USD Million) Forecast by Source Type, 2020-2035
  • Table 32: Latin America Market Volume (MT) Forecast by Source Type, 2020-2035
  • Table 33: Latin America Market Value (USD Million) Forecast by Animal Type, 2020-2035
  • Table 34: Latin America Market Volume (MT) Forecast by Animal Type, 2020-2035
  • Table 35: Latin America Market Value (USD Million) Forecast by Product Form, 2020-2035
  • Table 36: Latin America Market Volume (MT) Forecast by Product Form, 2020-2035
  • Table 37: Latin America Market Value (USD Million) Forecast by Application, 2020-2035
  • Table 38: Latin America Market Volume (MT) Forecast by Application, 2020-2035
  • Table 39: Latin America Market Value (USD Million) Forecast by Sales Channel, 2020-2035
  • Table 40: Latin America Market Volume (MT) Forecast by Sales Channel, 2020-2035
  • Table 41: Latin America Market Value (USD Million) Forecast by End Use Format, 2020-2035
  • Table 42: Latin America Market Volume (MT) Forecast by End Use Format, 2020-2035
  • Table 43: Western Europe Market Value (USD Million) Forecast by Country, 2020-2035
  • Table 44: Western Europe Market Volume (MT) Forecast by Country, 2020-2035
  • Table 45: Western Europe Market Value (USD Million) Forecast by Source Type, 2020-2035
  • Table 46: Western Europe Market Volume (MT) Forecast by Source Type, 2020-2035
  • Table 47: Western Europe Market Value (USD Million) Forecast by Animal Type, 2020-2035
  • Table 48: Western Europe Market Volume (MT) Forecast by Animal Type, 2020-2035
  • Table 49: Western Europe Market Value (USD Million) Forecast by Product Form, 2020-2035
  • Table 50: Western Europe Market Volume (MT) Forecast by Product Form, 2020-2035
  • Table 51: Western Europe Market Value (USD Million) Forecast by Application, 2020-2035
  • Table 52: Western Europe Market Volume (MT) Forecast by Application, 2020-2035
  • Table 53: Western Europe Market Value (USD Million) Forecast by Sales Channel, 2020-2035
  • Table 54: Western Europe Market Volume (MT) Forecast by Sales Channel, 2020-2035
  • Table 55: Western Europe Market Value (USD Million) Forecast by End Use Format, 2020-2035
  • Table 56: Western Europe Market Volume (MT) Forecast by End Use Format, 2020-2035
  • Table 57: Eastern Europe Market Value (USD Million) Forecast by Country, 2020-2035
  • Table 58: Eastern Europe Market Volume (MT) Forecast by Country, 2020-2035
  • Table 59: Eastern Europe Market Value (USD Million) Forecast by Source Type, 2020-2035
  • Table 60: Eastern Europe Market Volume (MT) Forecast by Source Type, 2020-2035
  • Table 61: Eastern Europe Market Value (USD Million) Forecast by Animal Type, 2020-2035
  • Table 62: Eastern Europe Market Volume (MT) Forecast by Animal Type, 2020-2035
  • Table 63: Eastern Europe Market Value (USD Million) Forecast by Product Form, 2020-2035
  • Table 64: Eastern Europe Market Volume (MT) Forecast by Product Form, 2020-2035
  • Table 65: Eastern Europe Market Value (USD Million) Forecast by Application, 2020-2035
  • Table 66: Eastern Europe Market Volume (MT) Forecast by Application, 2020-2035
  • Table 67: Eastern Europe Market Value (USD Million) Forecast by Sales Channel, 2020-2035
  • Table 68: Eastern Europe Market Volume (MT) Forecast by Sales Channel, 2020-2035
  • Table 69: Eastern Europe Market Value (USD Million) Forecast by End Use Format, 2020-2035
  • Table 70: Eastern Europe Market Volume (MT) Forecast by End Use Format, 2020-2035
  • Table 71: East Asia Market Value (USD Million) Forecast by Country, 2020-2035
  • Table 72: East Asia Market Volume (MT) Forecast by Country, 2020-2035
  • Table 73: East Asia Market Value (USD Million) Forecast by Source Type, 2020-2035
  • Table 74: East Asia Market Volume (MT) Forecast by Source Type, 2020-2035
  • Table 75: East Asia Market Value (USD Million) Forecast by Animal Type, 2020-2035
  • Table 76: East Asia Market Volume (MT) Forecast by Animal Type, 2020-2035
  • Table 77: East Asia Market Value (USD Million) Forecast by Product Form, 2020-2035
  • Table 78: East Asia Market Volume (MT) Forecast by Product Form, 2020-2035
  • Table 79: East Asia Market Value (USD Million) Forecast by Application, 2020-2035
  • Table 80: East Asia Market Volume (MT) Forecast by Application, 2020-2035
  • Table 81: East Asia Market Value (USD Million) Forecast by Sales Channel, 2020-2035
  • Table 82: East Asia Market Volume (MT) Forecast by Sales Channel, 2020-2035
  • Table 83: East Asia Market Value (USD Million) Forecast by End Use Format, 2020-2035
  • Table 84: East Asia Market Volume (MT) Forecast by End Use Format, 2020-2035
  • Table 85: South Asia & Pacific Market Value (USD Million) Forecast by Country, 2020-2035
  • Table 86: South Asia & Pacific Market Volume (MT) Forecast by Country, 2020-2035
  • Table 87: South Asia & Pacific Market Value (USD Million) Forecast by Source Type, 2020-2035
  • Table 88: South Asia & Pacific Market Volume (MT) Forecast by Source Type, 2020-2035
  • Table 89: South Asia & Pacific Market Value (USD Million) Forecast by Animal Type, 2020-2035
  • Table 90: South Asia & Pacific Market Volume (MT) Forecast by Animal Type, 2020-2035
  • Table 91: South Asia & Pacific Market Value (USD Million) Forecast by Product Form, 2020-2035
  • Table 92: South Asia & Pacific Market Volume (MT) Forecast by Product Form, 2020-2035
  • Table 93: South Asia & Pacific Market Value (USD Million) Forecast by Application, 2020-2035
  • Table 94: South Asia & Pacific Market Volume (MT) Forecast by Application, 2020-2035
  • Table 95: South Asia & Pacific Market Value (USD Million) Forecast by Sales Channel, 2020-2035
  • Table 96: South Asia & Pacific Market Volume (MT) Forecast by Sales Channel, 2020-2035
  • Table 97: South Asia & Pacific Market Value (USD Million) Forecast by End Use Format, 2020-2035
  • Table 98: South Asia & Pacific Market Volume (MT) Forecast by End Use Format, 2020-2035
  • Table 99: Middle East and Africa Market Value (USD Million) Forecast by Country, 2020-2035
  • Table 100: Middle East and Africa Market Volume (MT) Forecast by Country, 2020-2035
  • Table 101: Middle East and Africa Market Value (USD Million) Forecast by Source Type, 2020-2035
  • Table 102: Middle East and Africa Market Volume (MT) Forecast by Source Type, 2020-2035
  • Table 103: Middle East and Africa Market Value (USD Million) Forecast by Animal Type, 2020-2035
  • Table 104: Middle East and Africa Market Volume (MT) Forecast by Animal Type, 2020-2035
  • Table 105: Middle East and Africa Market Value (USD Million) Forecast by Product Form, 2020-2035
  • Table 106: Middle East and Africa Market Volume (MT) Forecast by Product Form, 2020-2035
  • Table 107: Middle East and Africa Market Value (USD Million) Forecast by Application, 2020-2035
  • Table 108: Middle East and Africa Market Volume (MT) Forecast by Application, 2020-2035
  • Table 109: Middle East and Africa Market Value (USD Million) Forecast by Sales Channel, 2020-2035
  • Table 110: Middle East and Africa Market Volume (MT) Forecast by Sales Channel, 2020-2035
  • Table 111: Middle East and Africa Market Value (USD Million) Forecast by End Use Format, 2020-2035
  • Table 112: Middle East and Africa Market Volume (MT) Forecast by End Use Format, 2020-2035

List of Figures

  • Figure 1: Global Market Volume (MT) Forecast 2020-2035
  • Figure 2: Global Market Pricing Analysis
  • Figure 3: Global Market Value (USD Million) Forecast 2020-2035
  • Figure 4: Global Market Value Share and BPS Analysis by Source Type, 2025 and 2035
  • Figure 5: Global Market Y-o-Y Growth Comparison by Source Type, 2025-2035
  • Figure 6: Global Market Attractiveness Analysis by Source Type
  • Figure 7: Global Market Value Share and BPS Analysis by Animal Type, 2025 and 2035
  • Figure 8: Global Market Y-o-Y Growth Comparison by Animal Type, 2025-2035
  • Figure 9: Global Market Attractiveness Analysis by Animal Type
  • Figure 10: Global Market Value Share and BPS Analysis by Product Form, 2025 and 2035
  • Figure 11: Global Market Y-o-Y Growth Comparison by Product Form, 2025-2035
  • Figure 12: Global Market Attractiveness Analysis by Product Form
  • Figure 13: Global Market Value Share and BPS Analysis by Application, 2025 and 2035
  • Figure 14: Global Market Y-o-Y Growth Comparison by Application, 2025-2035
  • Figure 15: Global Market Attractiveness Analysis by Application
  • Figure 16: Global Market Value Share and BPS Analysis by Sales Channel, 2025 and 2035
  • Figure 17: Global Market Y-o-Y Growth Comparison by Sales Channel, 2025-2035
  • Figure 18: Global Market Attractiveness Analysis by Sales Channel
  • Figure 19: Global Market Value Share and BPS Analysis by End Use Format, 2025 and 2035
  • Figure 20: Global Market Y-o-Y Growth Comparison by End Use Format, 2025-2035
  • Figure 21: Global Market Attractiveness Analysis by End Use Format
  • Figure 22: Global Market Value (USD Million) Share and BPS Analysis by Region, 2025 and 2035
  • Figure 23: Global Market Y-o-Y Growth Comparison by Region, 2025-2035
  • Figure 24: Global Market Attractiveness Analysis by Region
  • Figure 25: North America Market Incremental $ Opportunity, 2025-2035
  • Figure 26: Latin America Market Incremental $ Opportunity, 2025-2035
  • Figure 27: Western Europe Market Incremental $ Opportunity, 2025-2035
  • Figure 28: Eastern Europe Market Incremental $ Opportunity, 2025-2035
  • Figure 29: East Asia Market Incremental $ Opportunity, 2025-2035
  • Figure 30: South Asia & Pacific Market Incremental $ Opportunity, 2025-2035
  • Figure 31: Middle East and Africa Market Incremental $ Opportunity, 2025-2035
  • Figure 32: North America Market Value Share and BPS Analysis by Country, 2025 and 2035
  • Figure 33: North America Market Value Share and BPS Analysis by Source Type, 2025 and 2035
  • Figure 34: North America Market Y-o-Y Growth Comparison by Source Type, 2025-2035
  • Figure 35: North America Market Attractiveness Analysis by Source Type
  • Figure 36: North America Market Value Share and BPS Analysis by Animal Type, 2025 and 2035
  • Figure 37: North America Market Y-o-Y Growth Comparison by Animal Type, 2025-2035
  • Figure 38: North America Market Attractiveness Analysis by Animal Type
  • Figure 39: North America Market Value Share and BPS Analysis by Product Form, 2025 and 2035
  • Figure 40: North America Market Y-o-Y Growth Comparison by Product Form, 2025-2035
  • Figure 41: North America Market Attractiveness Analysis by Product Form
  • Figure 42: North America Market Value Share and BPS Analysis by Application, 2025 and 2035
  • Figure 43: North America Market Y-o-Y Growth Comparison by Application, 2025-2035
  • Figure 44: North America Market Attractiveness Analysis by Application
  • Figure 45: North America Market Value Share and BPS Analysis by Sales Channel, 2025 and 2035
  • Figure 46: North America Market Y-o-Y Growth Comparison by Sales Channel, 2025-2035
  • Figure 47: North America Market Attractiveness Analysis by Sales Channel
  • Figure 48: North America Market Value Share and BPS Analysis by End Use Format, 2025 and 2035
  • Figure 49: North America Market Y-o-Y Growth Comparison by End Use Format, 2025-2035
  • Figure 50: North America Market Attractiveness Analysis by End Use Format
  • Figure 51: Latin America Market Value Share and BPS Analysis by Country, 2025 and 2035
  • Figure 52: Latin America Market Value Share and BPS Analysis by Source Type, 2025 and 2035
  • Figure 53: Latin America Market Y-o-Y Growth Comparison by Source Type, 2025-2035
  • Figure 54: Latin America Market Attractiveness Analysis by Source Type
  • Figure 55: Latin America Market Value Share and BPS Analysis by Animal Type, 2025 and 2035
  • Figure 56: Latin America Market Y-o-Y Growth Comparison by Animal Type, 2025-2035
  • Figure 57: Latin America Market Attractiveness Analysis by Animal Type
  • Figure 58: Latin America Market Value Share and BPS Analysis by Product Form, 2025 and 2035
  • Figure 59: Latin America Market Y-o-Y Growth Comparison by Product Form, 2025-2035
  • Figure 60: Latin America Market Attractiveness Analysis by Product Form
  • Figure 61: Latin America Market Value Share and BPS Analysis by Application, 2025 and 2035
  • Figure 62: Latin America Market Y-o-Y Growth Comparison by Application, 2025-2035
  • Figure 63: Latin America Market Attractiveness Analysis by Application
  • Figure 64: Latin America Market Value Share and BPS Analysis by Sales Channel, 2025 and 2035
  • Figure 65: Latin America Market Y-o-Y Growth Comparison by Sales Channel, 2025-2035
  • Figure 66: Latin America Market Attractiveness Analysis by Sales Channel
  • Figure 67: Latin America Market Value Share and BPS Analysis by End Use Format, 2025 and 2035
  • Figure 68: Latin America Market Y-o-Y Growth Comparison by End Use Format, 2025-2035
  • Figure 69: Latin America Market Attractiveness Analysis by End Use Format
  • Figure 70: Western Europe Market Value Share and BPS Analysis by Country, 2025 and 2035
  • Figure 71: Western Europe Market Value Share and BPS Analysis by Source Type, 2025 and 2035
  • Figure 72: Western Europe Market Y-o-Y Growth Comparison by Source Type, 2025-2035
  • Figure 73: Western Europe Market Attractiveness Analysis by Source Type
  • Figure 74: Western Europe Market Value Share and BPS Analysis by Animal Type, 2025 and 2035
  • Figure 75: Western Europe Market Y-o-Y Growth Comparison by Animal Type, 2025-2035
  • Figure 76: Western Europe Market Attractiveness Analysis by Animal Type
  • Figure 77: Western Europe Market Value Share and BPS Analysis by Product Form, 2025 and 2035
  • Figure 78: Western Europe Market Y-o-Y Growth Comparison by Product Form, 2025-2035
  • Figure 79: Western Europe Market Attractiveness Analysis by Product Form
  • Figure 80: Western Europe Market Value Share and BPS Analysis by Application, 2025 and 2035
  • Figure 81: Western Europe Market Y-o-Y Growth Comparison by Application, 2025-2035
  • Figure 82: Western Europe Market Attractiveness Analysis by Application
  • Figure 83: Western Europe Market Value Share and BPS Analysis by Sales Channel, 2025 and 2035
  • Figure 84: Western Europe Market Y-o-Y Growth Comparison by Sales Channel, 2025-2035
  • Figure 85: Western Europe Market Attractiveness Analysis by Sales Channel
  • Figure 86: Western Europe Market Value Share and BPS Analysis by End Use Format, 2025 and 2035
  • Figure 87: Western Europe Market Y-o-Y Growth Comparison by End Use Format, 2025-2035
  • Figure 88: Western Europe Market Attractiveness Analysis by End Use Format
  • Figure 89: Eastern Europe Market Value Share and BPS Analysis by Country, 2025 and 2035
  • Figure 90: Eastern Europe Market Value Share and BPS Analysis by Source Type, 2025 and 2035
  • Figure 91: Eastern Europe Market Y-o-Y Growth Comparison by Source Type, 2025-2035
  • Figure 92: Eastern Europe Market Attractiveness Analysis by Source Type
  • Figure 93: Eastern Europe Market Value Share and BPS Analysis by Animal Type, 2025 and 2035
  • Figure 94: Eastern Europe Market Y-o-Y Growth Comparison by Animal Type, 2025-2035
  • Figure 95: Eastern Europe Market Attractiveness Analysis by Animal Type
  • Figure 96: Eastern Europe Market Value Share and BPS Analysis by Product Form, 2025 and 2035
  • Figure 97: Eastern Europe Market Y-o-Y Growth Comparison by Product Form, 2025-2035
  • Figure 98: Eastern Europe Market Attractiveness Analysis by Product Form
  • Figure 99: Eastern Europe Market Value Share and BPS Analysis by Application, 2025 and 2035
  • Figure 100: Eastern Europe Market Y-o-Y Growth Comparison by Application, 2025-2035
  • Figure 101: Eastern Europe Market Attractiveness Analysis by Application
  • Figure 102: Eastern Europe Market Value Share and BPS Analysis by Sales Channel, 2025 and 2035
  • Figure 103: Eastern Europe Market Y-o-Y Growth Comparison by Sales Channel, 2025-2035
  • Figure 104: Eastern Europe Market Attractiveness Analysis by Sales Channel
  • Figure 105: Eastern Europe Market Value Share and BPS Analysis by End Use Format, 2025 and 2035
  • Figure 106: Eastern Europe Market Y-o-Y Growth Comparison by End Use Format, 2025-2035
  • Figure 107: Eastern Europe Market Attractiveness Analysis by End Use Format
  • Figure 108: East Asia Market Value Share and BPS Analysis by Country, 2025 and 2035
  • Figure 109: East Asia Market Value Share and BPS Analysis by Source Type, 2025 and 2035
  • Figure 110: East Asia Market Y-o-Y Growth Comparison by Source Type, 2025-2035
  • Figure 111: East Asia Market Attractiveness Analysis by Source Type
  • Figure 112: East Asia Market Value Share and BPS Analysis by Animal Type, 2025 and 2035
  • Figure 113: East Asia Market Y-o-Y Growth Comparison by Animal Type, 2025-2035
  • Figure 114: East Asia Market Attractiveness Analysis by Animal Type
  • Figure 115: East Asia Market Value Share and BPS Analysis by Product Form, 2025 and 2035
  • Figure 116: East Asia Market Y-o-Y Growth Comparison by Product Form, 2025-2035
  • Figure 117: East Asia Market Attractiveness Analysis by Product Form
  • Figure 118: East Asia Market Value Share and BPS Analysis by Application, 2025 and 2035
  • Figure 119: East Asia Market Y-o-Y Growth Comparison by Application, 2025-2035
  • Figure 120: East Asia Market Attractiveness Analysis by Application
  • Figure 121: East Asia Market Value Share and BPS Analysis by Sales Channel, 2025 and 2035
  • Figure 122: East Asia Market Y-o-Y Growth Comparison by Sales Channel, 2025-2035
  • Figure 123: East Asia Market Attractiveness Analysis by Sales Channel
  • Figure 124: East Asia Market Value Share and BPS Analysis by End Use Format, 2025 and 2035
  • Figure 125: East Asia Market Y-o-Y Growth Comparison by End Use Format, 2025-2035
  • Figure 126: East Asia Market Attractiveness Analysis by End Use Format
  • Figure 127: South Asia & Pacific Market Value Share and BPS Analysis by Country, 2025 and 2035
  • Figure 128: South Asia & Pacific Market Value Share and BPS Analysis by Source Type, 2025 and 2035
  • Figure 129: South Asia & Pacific Market Y-o-Y Growth Comparison by Source Type, 2025-2035
  • Figure 130: South Asia & Pacific Market Attractiveness Analysis by Source Type
  • Figure 131: South Asia & Pacific Market Value Share and BPS Analysis by Animal Type, 2025 and 2035
  • Figure 132: South Asia & Pacific Market Y-o-Y Growth Comparison by Animal Type, 2025-2035
  • Figure 133: South Asia & Pacific Market Attractiveness Analysis by Animal Type
  • Figure 134: South Asia & Pacific Market Value Share and BPS Analysis by Product Form, 2025 and 2035
  • Figure 135: South Asia & Pacific Market Y-o-Y Growth Comparison by Product Form, 2025-2035
  • Figure 136: South Asia & Pacific Market Attractiveness Analysis by Product Form
  • Figure 137: South Asia & Pacific Market Value Share and BPS Analysis by Application, 2025 and 2035
  • Figure 138: South Asia & Pacific Market Y-o-Y Growth Comparison by Application, 2025-2035
  • Figure 139: South Asia & Pacific Market Attractiveness Analysis by Application
  • Figure 140: South Asia & Pacific Market Value Share and BPS Analysis by Sales Channel, 2025 and 2035
  • Figure 141: South Asia & Pacific Market Y-o-Y Growth Comparison by Sales Channel, 2025-2035
  • Figure 142: South Asia & Pacific Market Attractiveness Analysis by Sales Channel
  • Figure 143: South Asia & Pacific Market Value Share and BPS Analysis by End Use Format, 2025 and 2035
  • Figure 144: South Asia & Pacific Market Y-o-Y Growth Comparison by End Use Format, 2025-2035
  • Figure 145: South Asia & Pacific Market Attractiveness Analysis by End Use Format
  • Figure 146: Middle East and Africa Market Value Share and BPS Analysis by Country, 2025 and 2035
  • Figure 147: Middle East and Africa Market Value Share and BPS Analysis by Source Type, 2025 and 2035
  • Figure 148: Middle East and Africa Market Y-o-Y Growth Comparison by Source Type, 2025-2035
  • Figure 149: Middle East and Africa Market Attractiveness Analysis by Source Type
  • Figure 150: Middle East and Africa Market Value Share and BPS Analysis by Animal Type, 2025 and 2035
  • Figure 151: Middle East and Africa Market Y-o-Y Growth Comparison by Animal Type, 2025-2035
  • Figure 152: Middle East and Africa Market Attractiveness Analysis by Animal Type
  • Figure 153: Middle East and Africa Market Value Share and BPS Analysis by Product Form, 2025 and 2035
  • Figure 154: Middle East and Africa Market Y-o-Y Growth Comparison by Product Form, 2025-2035
  • Figure 155: Middle East and Africa Market Attractiveness Analysis by Product Form
  • Figure 156: Middle East and Africa Market Value Share and BPS Analysis by Application, 2025 and 2035
  • Figure 157: Middle East and Africa Market Y-o-Y Growth Comparison by Application, 2025-2035
  • Figure 158: Middle East and Africa Market Attractiveness Analysis by Application
  • Figure 159: Middle East and Africa Market Value Share and BPS Analysis by Sales Channel, 2025 and 2035
  • Figure 160: Middle East and Africa Market Y-o-Y Growth Comparison by Sales Channel, 2025-2035
  • Figure 161: Middle East and Africa Market Attractiveness Analysis by Sales Channel
  • Figure 162: Middle East and Africa Market Value Share and BPS Analysis by End Use Format, 2025 and 2035
  • Figure 163: Middle East and Africa Market Y-o-Y Growth Comparison by End Use Format, 2025-2035
  • Figure 164: Middle East and Africa Market Attractiveness Analysis by End Use Format
  • Figure 165: Global Market - Tier Structure Analysis
  • Figure 166: Global Market - Company Share Analysis

Frequently Asked Questions

What is the projected size of the omega-3 in animal feed market in 2025?

The market is valued at USD 678.2 million in 2025.

What is the outlook on omega-3 in animal feed demand by 2035?

The market is forecasted to reach USD 987.2 million by 2035, reflecting a CAGR of 3.7%.

Which segment leads the omega-3 in animal feed market by source type in 2025?

Fish oil will lead the source type segment, accounting for 38.7% of the global market share in 2025.

What is the top animal type segment for the omega-3 in animal feed market in 2025?

Aquaculture will dominate the animal type segment with a 29.4% share in 2025.

Which country is projected to have the fastest-growing omega-3 in animal feed market?

Germany is projected to grow at the fastest rate, with a CAGR of 4.9% from 2025 to 2035.

Explore Similar Insights

Future Market Insights

Omega-3 in Animal Feed Market