The Orthodontic Wax Market is estimated to be valued at USD 1.4 billion in 2025 and is projected to reach USD 2.3 billion by 2035, registering a compound annual growth rate (CAGR) of 5.0% over the forecast period.
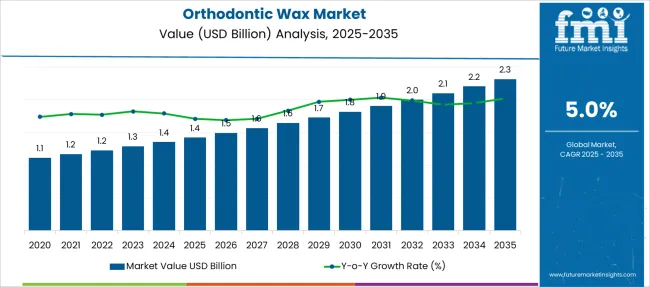
| Metric | Value |
|---|---|
| Orthodontic Wax Market Estimated Value in (2025 E) | USD 1.4 billion |
| Orthodontic Wax Market Forecast Value in (2035 F) | USD 2.3 billion |
| Forecast CAGR (2025 to 2035) | 5.0% |
The orthodontic wax market is witnessing consistent growth, largely influenced by the rising number of individuals undergoing orthodontic treatment and the increased emphasis on patient comfort. With the expanding use of braces and clear aligners among both adolescents and adults, demand for supportive accessories such as orthodontic wax has significantly increased. These waxes are essential in protecting the oral mucosa from irritation caused by brackets and wires, thereby improving treatment adherence and patient satisfaction.
Advancements in wax compositions, including the incorporation of flavored and transparent options, are contributing to wider acceptance among end-users. Regulatory support for oral care hygiene products and the growth of dental tourism in emerging markets are further accelerating adoption.
The market is also benefiting from higher availability through both clinical channels and direct-to-consumer platforms, allowing greater accessibility As dental awareness grows and orthodontic care becomes more personalized, orthodontic wax is anticipated to play a vital role in enhancing the overall treatment experience across global markets.
The market is segmented by Product Type, Source, and End-User and region. By Product Type, the market is divided into Pattern Waxes, Processing Waxes, and Impression Wax. In terms of Source, the market is classified into Mineral, Plant, and Animal (Beeswax). Based on End-User, the market is segmented into Dental Hospitals, Dental Clinics, Dental Laboratories, and Homecare Settings. Regionally, the market is classified into North America, Latin America, Western Europe, Eastern Europe, Balkan & Baltic Countries, Russia & Belarus, Central Asia, East Asia, South Asia & Pacific, and the Middle East & Africa.
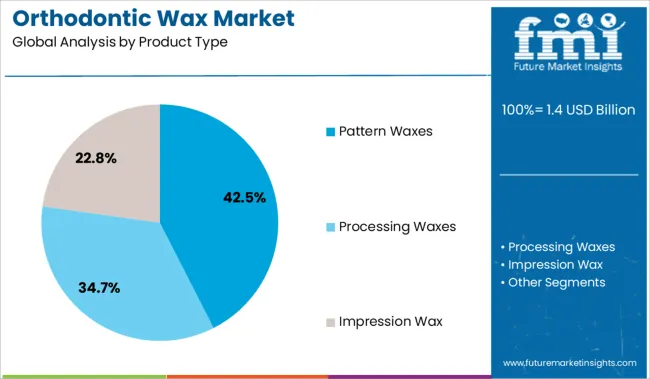
The pattern waxes segment is expected to contribute 42.5% of the total revenue share in the orthodontic wax market in 2025, marking it as the dominant product type. The widespread preference for this subsegment is being driven by its excellent molding capabilities, ease of customization, and suitability for high-precision applications in orthodontic care.
Pattern waxes have been recognized for their superior handling characteristics and consistent performance across varied temperature conditions, which ensures patient comfort during prolonged wear. The segment's prominence is also being supported by its compatibility with modern orthodontic appliances and its availability in various grades tailored to clinical needs.
Manufacturers have been focusing on enhancing the quality of pattern waxes by improving softness and flexibility, thereby addressing diverse patient requirements Additionally, the reliability and cost-effectiveness of pattern waxes have made them a preferred option among dental professionals, further reinforcing their continued dominance in the orthodontic wax market.
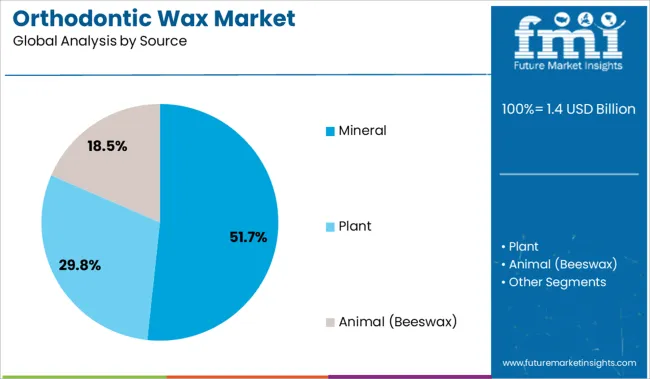
The mineral source segment is projected to account for 51.7% of the total revenue share in the orthodontic wax market in 2025, positioning it as the leading source category. This dominance is being driven by the abundant availability, affordability, and proven safety of mineral-based waxes for intraoral applications. The ease of processing and blending mineral waxes into various formulations has enabled manufacturers to meet specific requirements for orthodontic comfort, including consistency, texture, and non-toxicity.
The inert nature of mineral waxes makes them ideal for prolonged oral use, minimizing the risk of allergic reactions or tissue irritation. The segment has also gained traction due to its regulatory acceptance and wide usage in clinical practice.
With dental professionals seeking stable and reliable materials for patient care, mineral waxes have emerged as the preferred choice due to their balance of performance and cost-efficiency Their use in mass production and institutional supply chains has further contributed to their substantial market share.
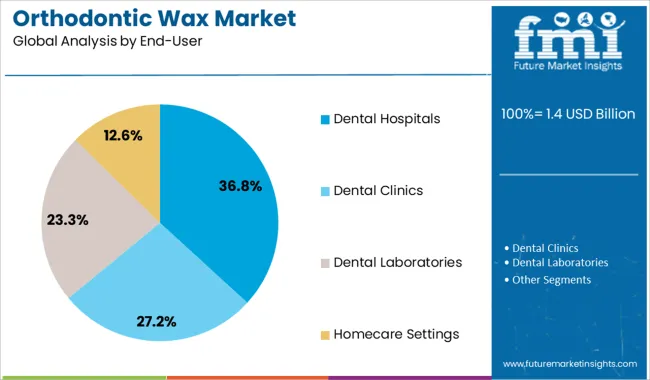
Dental hospitals are estimated to hold 36.8% of the total revenue share in the orthodontic wax market in 2025, making them the largest end-user segment. This leadership is being attributed to the high patient throughput and continuous demand for orthodontic procedures within these institutions. Dental hospitals often serve as referral centers for complex orthodontic cases, which increases the regular consumption of auxiliary materials such as orthodontic wax.
The segment's growth is also being influenced by the structured procurement systems and long-term supplier contracts typically observed in hospital settings, ensuring consistent product availability. Moreover, dental hospitals tend to adopt standardized products that align with clinical protocols and regulatory compliance, further driving the use of reliable wax formulations.
Investment in advanced orthodontic technologies and a growing focus on improving patient experience have encouraged hospitals to stock quality comfort-enhancing materials As institutional dental care expands in both public and private sectors, the role of dental hospitals in supporting the orthodontic wax market is expected to remain significant.
Surging demand for the prevention of enamel damage due to high consumption of coffee, smoking, alcohol, and low oral hygiene is likely to create lucrative opportunities for the market.
This needs to protect cheeks and gums from injuries arising from wires, ridges, and clasps used in braces is increasing. This is likely to improve the demand for orthodontic wax over the coming years.
Besides this, the low toxicity of orthodontic wax is estimated to propel its usage in dental care, augmenting the sales of orthodontic wax in the coming years. Furthermore, increasing cases of tooth decay, crooked teeth, and other dental problems are increasing the demand for dental implants, boosting the market.
The hydrophobic nature of orthodontic wax causes limited mouth movement, discomfort, and drying of the mouth. These factors of orthodontic wax are likely to limit the sales in the market.
Similarly, difficulty in initiating the natural process of hardening and longer healing time is likely to hamper the sales of orthodontic wax. Further, changing raw material prices is projected to increase the prices of orthodontic wax, which will restrain the demand for orthodontic wax.
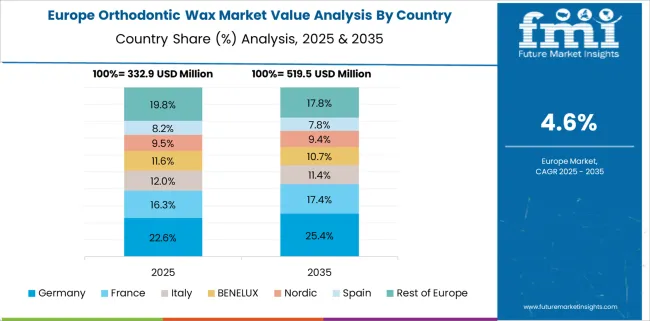
According to Future Market Insights (FMI), Europe is estimated to account for a significant share of the orthodontic wax market. Growth is attributed to the rising number of dental care facilities in the United Kingdom, Russia, and Germany.
With the growing influence of social media, the demand for dental aesthetics to enhance physical appearance is increasing. This will create a conducive environment for the orthodontic wax market.
Also, favorable reimbursement policies related to orthodontic procedures in countries such as the United Kingdom, Germany, and others are likely to bolster growth in Europe. Furthermore, high consumption of alcohol, fast foods, and smoking is surging the demand for dental treatments and fixtures, propelling sales in the market.
Asia-Pacific is projected to register the fastest growth rate owing to growing consciousness about dental care and hygiene to prevent dental problems. This is projected to propel the demand for orthodontic wax across India, China, and Japan.
Demand for customized and transparent orthodontic devices is rising due to the increasing need for the correction of misaligned or crooked teeth. This is projected to spur sales in the market.
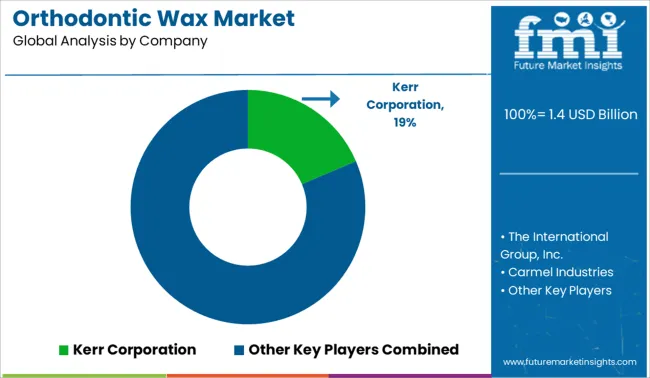
Key players profiled in the global orthodontic wax market include Carmel Industries, Bilkim Ltd. Co., Colgate-Palmolive Company, DWS Systems, Pyrex Polymars Inc., C.J. Robinson Company, Solstice T&I, Bracon Dental, Metrodent Ltd., among others.
Some of the key players are developing high-quality orthodontic wax to increase their revenue and increase their consumer base.
| Report Attribute | Details |
|---|---|
| Growth Rate | 5% to 6% CAGR |
| Base Year for Estimation | 2024 |
| Historical Data | 2020 to 2024 |
| Forecast Period | 2025 to 2035 |
| Quantitative Units | Revenue in USD Billion, and CAGR from 2025 to 2035 |
| Report Coverage | Revenue Forecast, Volume Forecast, Company Ranking, Competitive Landscape, Growth Factors, Trends, and Pricing Analysis |
| Segments Covered | Product Type, End User, Region |
| Regions Covered | North America; Latin America; Western Europe; Eastern Europe; Asia Pacific Excluding Japan; Japan; Middle East and Africa |
| Key Countries Profiled | USA, Canada, Brazil, Argentina, Germany, United Kingdom, France, Spain, Italy, Nordics, BENELUX, Australia & New Zealand, China, India, ASIAN, GCC Countries, South Africa |
| Key Companies Profiled | Carmel Industries; Bilkim Ltd. Co.; Colgate-Palmolive Company; DWS Systems; Pyrex Polymars Inc.; C.J. Robinson Company; Solstice T&I; Bracon Dental; Metrodent Ltd. |
| Customization | Available Upon Request |
The global orthodontic wax market is estimated to be valued at USD 1.4 billion in 2025.
The market size for the orthodontic wax market is projected to reach USD 2.3 billion by 2035.
The orthodontic wax market is expected to grow at a 5.0% CAGR between 2025 and 2035.
The key product types in orthodontic wax market are pattern waxes, processing waxes and impression wax.
In terms of source, mineral segment to command 51.7% share in the orthodontic wax market in 2025.


Our Research Products

The "Full Research Suite" delivers actionable market intel, deep dives on markets or technologies, so clients act faster, cut risk, and unlock growth.

The Leaderboard benchmarks and ranks top vendors, classifying them as Established Leaders, Leading Challengers, or Disruptors & Challengers.

Locates where complements amplify value and substitutes erode it, forecasting net impact by horizon

We deliver granular, decision-grade intel: market sizing, 5-year forecasts, pricing, adoption, usage, revenue, and operational KPIs—plus competitor tracking, regulation, and value chains—across 60 countries broadly.

Spot the shifts before they hit your P&L. We track inflection points, adoption curves, pricing moves, and ecosystem plays to show where demand is heading, why it is changing, and what to do next across high-growth markets and disruptive tech

Real-time reads of user behavior. We track shifting priorities, perceptions of today’s and next-gen services, and provider experience, then pace how fast tech moves from trial to adoption, blending buyer, consumer, and channel inputs with social signals (#WhySwitch, #UX).

Partner with our analyst team to build a custom report designed around your business priorities. From analysing market trends to assessing competitors or crafting bespoke datasets, we tailor insights to your needs.
Supplier Intelligence
Discovery & Profiling
Capacity & Footprint
Performance & Risk
Compliance & Governance
Commercial Readiness
Who Supplies Whom
Scorecards & Shortlists
Playbooks & Docs
Category Intelligence
Definition & Scope
Demand & Use Cases
Cost Drivers
Market Structure
Supply Chain Map
Trade & Policy
Operating Norms
Deliverables
Buyer Intelligence
Account Basics
Spend & Scope
Procurement Model
Vendor Requirements
Terms & Policies
Entry Strategy
Pain Points & Triggers
Outputs
Pricing Analysis
Benchmarks
Trends
Should-Cost
Indexation
Landed Cost
Commercial Terms
Deliverables
Brand Analysis
Positioning & Value Prop
Share & Presence
Customer Evidence
Go-to-Market
Digital & Reputation
Compliance & Trust
KPIs & Gaps
Outputs
Full Research Suite comprises of:
Market outlook & trends analysis
Interviews & case studies
Strategic recommendations
Vendor profiles & capabilities analysis
5-year forecasts
8 regions and 60+ country-level data splits
Market segment data splits
12 months of continuous data updates
DELIVERED AS:
PDF EXCEL ONLINE
Dental Orthodontic Wax Market Insights – Growth & Forecast 2024-2034
Waxed Paper Market Size and Share Market Forecast and Outlook 2025 to 2035
Waxing Base Paper Market Size and Share Forecast Outlook 2025 to 2035
Wax Injector Market Size and Share Forecast Outlook 2025 to 2035
Wax Paper Medicine Pots Market Size and Share Forecast Outlook 2025 to 2035
Wax Boxes Market Insights - Growth & Demand Forecast 2025 to 2035
Wax-coated Paper Market
Waxed Paper Packaging Market
Earwax Removal Market Analysis by Product, Age Group, Distribution Channel, and Region Forecast Through 2035
Bio-wax Market Size and Share Forecast Outlook 2025 to 2035
Beeswax for Cosmetics Market Size and Share Forecast Outlook 2025 to 2035
Ear Wax Removal Products Market Size and Share Forecast Outlook 2025 to 2035
Car Wax Market Outlook – Demand, Size & Industry Trends 2025-2035
Beeswax Market
Cold Waxed Paper Cups Market Size and Share Forecast Outlook 2025 to 2035
Assessing Cold Waxed Paper Cups Market Share & Industry Trends
Global Bees Wax Wrap Market Growth – Trends & Forecast 2024-2034
Sealed Wax Packaging Market Size and Share Forecast Outlook 2025 to 2035
UK Car Wax Market Analysis – Size, Share & Forecast 2025-2035
Montan Wax Market

Thank you!
You will receive an email from our Business Development Manager. Please be sure to check your SPAM/JUNK folder too.
Chat With
MaRIA