Parchment Paper Market
Market Insights on Parchment Paper covering sales outlook, demand forecast & up-to-date key trends
Parchment Paper Market By Basis Weight Type (Bleached, Unbleached), Basis Weight (Less than 40 GSM, 41 to 60 GSM, 61 to 80 GSM), End Use (Bakery and Confectionary, Ready-to-Eat Meals, Fresh Produce) & Region - Forecast 2021 - 2031
Parchment Paper Market Snapshot
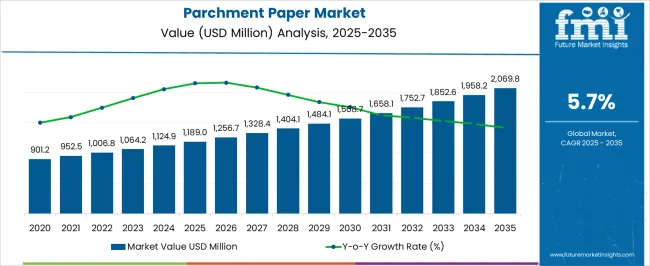
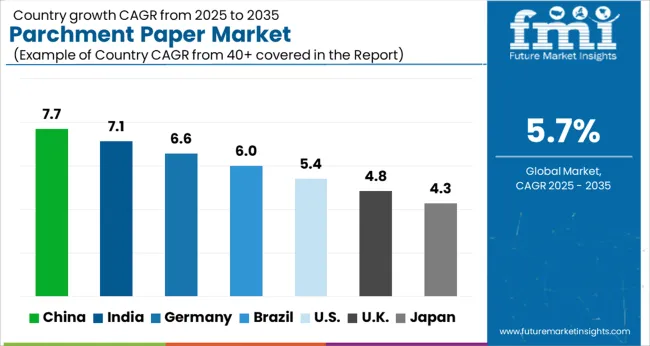
Future Market Insights (FMI) projects the parchment paper market to surpass US$ 959 million by 2021. The overall valuation is expected to reach US$ 1.6 billion by 2031, growing at a CAGR of 5.8% for 2021-2031.
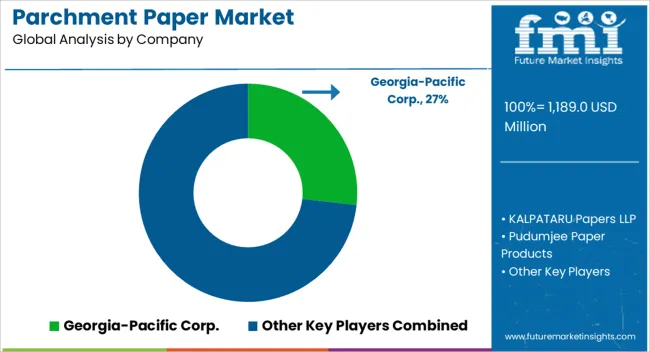
The demand for parchment paper will accelerate with top 5 providers, including Georgia-Pacific Corp., Ahlstrom-Munksjo Oyj., METSA Tissue, Delfort Group AG, and Nordic Paper AS accounting for over 15-20% of the overall market in 2021.
Let us know your requirement to get
100% FREE customization
Key Points Covered in Parchment Paper Market Study
- Market estimates and forecast 2015-2031
- Key drivers and restraints impacting market growth
- Segment-wise, Country-wise, and Region-wise Analysis
- Competition Mapping and Benchmarking
- Brand share and Market Share Analysis
- Key Product Innovations and Regulatory Climate
- COVID-19 Impact on Parchment Papers Market and How to Navigate
- Recommendation on Key Winning Strategies
2015-2020 Parchment Paper Market Outlook Compared to 2021-2031 Forecast
Growth in food and food services sector has navigated rapid development of parchment paper industry worldwide. It is predicted to rise at 5.8% CAGR from 2021 to 2031 in comparison to 3.3% CAGR registered between 2015 and 2020.
Globally, changing consumer behavior has resulted in rise of consumption of ready-to-eat food. Thanks to increase in disposable income, consumers in emerging economies are spending more in food and food services sector. This trend is expected to continue over the assessment period.
On the back of these factors, the global parchment paper market is projected to witness the incremental opportunity of US$ 759.7 Mn during 2021-2031
Restaurants and bakeries are shifting towards parchment paper to reduce the time and labor invested in cleaning utensils. Traditionally usage of clamshell products was very common in the food services industry, but lately it has been transitioning to easily manageable, light weight, durable, safe and hygienic parchment paper.
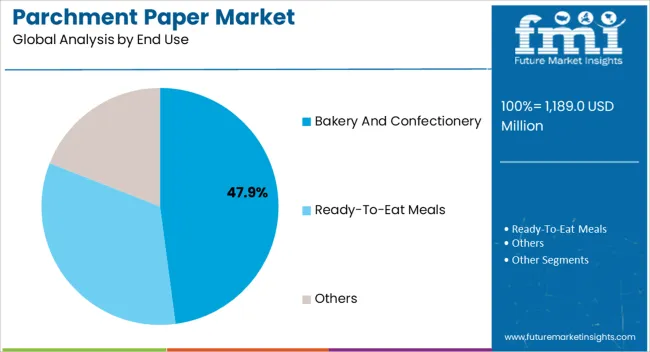
Application of chlorine-free and unbleached greaseproof paper is expected to rise in the bakery and confectionary segment, which is anticipated to account for over 30% of sales in the market by the end of the forecast period.
These sheets are considered ideal for wrapping food and confectioneries. They are often used for wrapping a variety of ready-to-eat meals such as burgers or sandwiches. Parchment paper also is used as inner lining in snack boxes.
Economical parchment paper produced in South Asia and East Asia has a high demand in mature markets of U.S., U.K., Germany and France. Reasonable pricing of raw materials in emerging economies such as India, China and South Korea is pushing key players to produce goods in developing countries and export them to all parts of world.
What Is the Impact of COVID-19 Crisis on Parchment Paper Market?
Due to the unprecedented COVID-19 outbreak, most of the countries across the globe implemented complete or partial lockdown to stop the menace of this life threatening virus. Although complete lockdown was enforced, manufacturing and transportation of essential commodities and materials were allowed by some government authorities.
The parchment paper market also witnessed a decelerating demand due to interruption of supply chains amid the outbreak of deadly virus. This caused great loss to producers and highly impacted the medium and small scale manufacturers with low profit margins. It resulted in negative year on year growth at -4.2% in the year 2020.
The food & beverage sector had a late boom, as the supply chain of agro-products and essential items were reinstated due to that bulk cargo transport by food producers. This has contributed positively to the growth of global parchment paper market by the start of 2021.
Find your sweet spots for generating winning opportunities in this market.
Talk to AnalystCountry-wise Insights
Why is the U.S. Considered a Highly Profitable Parchment Paper Market?
North America is forecast to be second-leading market, according to Future Market Insights. As per the analysis, the U.S. is expected to hold more than 70% of the North America parchment paper market till 2031.
Implementation of stringent food safety regulations is set to boost the market for safe and hygienic food packaging solutions like unbleached parchment paper in the U.S.
Furthermore, the U.S. remains one of the world's largest markets for consumption of parchment paper, valued at US$ 164.1 Mn in 2020. Parchment paper is mostly used for wrapping of food products such as burger, bakery and confectionery products.
Many of the end users are opting for parchment paper while transporting food products, as this paper keeps the quality of the food products intact for a longer duration. Therefore, parchment paper is the most favored choice for exporting confectionary products in bulk across the globe.
Why are Parchment Paper Manufacturers Eyeing China to strengthen their Position?
China is gaining popularity for its stronghold in industrial and infrastructural growth and the country is projected to account for over 36% of the parchment paper market in East Asia.
China is well known as an early adopter of latest technologies. The cost of manufacturing is notably less in the country along with the availability of cheap labor and extensive pool of consumers, which are attracting many producers from around the world.
China also has emerged as one of Asia’s largest markets for food services industry, making it highly lucrative for parchment paper manufacturers. Moreover, rise in demand for food, and food services will create impressive growth opportunities for the market.
As per FMI, the parchment paper market in China is estimated to grow at a CAGR of 7.1% during the forecast period.
How will Expansion of Food Service Industry Fuel Demand for Parchment Paper in India?
India will hold share of more than 24% for the South Asia parchment paper market by the end of year 2031. The expansion of the food services will present lucrative opportunities for parchment paper manufacturers to maximize their sales in India.
The ever increasing production of food services product by India, means rise in demand for paper packaging solutions such as parchment papers. Also, the in-state consumption of packed foods has risen due to population surge. These factors directly impact the growth of parchment paper market.
Why is Japan Considered a Lucrative Parchment Paper Market?
Japan is one of the key producers of parchment paper in East-Asia and it is forecast to account for market value of almost about US$ 86 Mn by the end of 2031. Manufacturers from Japan are keenly focusing on developing a safe product for consumers.
Also, key food and food services players from Japan are undergoing a transition from clamshell products to parchment paper which is sustainable to reduce generation of carbon footprint. Subsequently, the Japan parchment paper market will create incremental opportunity of US$ 45.8 Mn in the forecast period 2021-2031.
Category-wise Insights
Why is Unbleached Paper Preferred in the Parchment Paper Market?
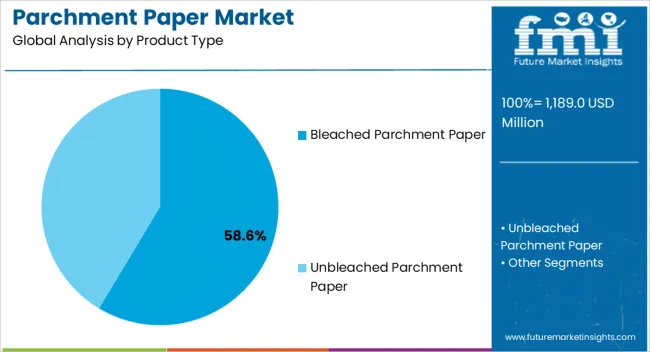
Unbleached paper is widely preferred in market owing to very little or no presence of fluorochemicals on the paper. Due to this, unbleached paper held more than 50% of market share in 2020.
Stringent rules are implemented on the use of bleached paper for food packaging in to curb the cases of food poisoning. This might restrict sales of bleached parchment paper. Moreover, bleached paper, if exposed under sunlight causes reaction of fluorochemicals present on paper with UV light. It might also leave traces of chemicals over food products which can cause food poisoning and other harmful effects.
Considering these factors, usage of unbleached parchment paper will expand by 2.05 times and expected to gain 630 BPS by the end of 2031.
Which Type of Parchment Paper is Widely Consumed in the market?
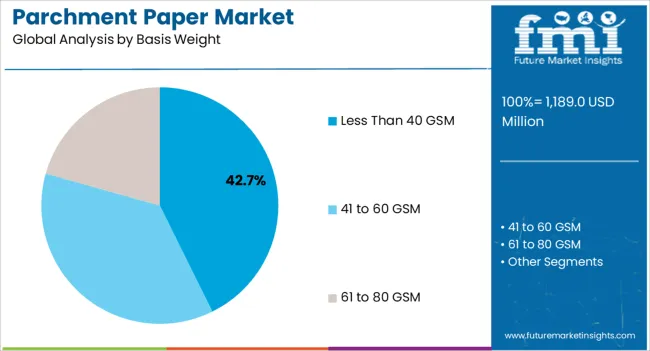
The 40-60 GSM paper is widely used in the market due to its durability and lightweight properties. This segment is anticipated to hold about 44% of the market share by the end of 2021. Countries in the West are largely emphasizing on sustainable packaging solutions and stringent rules for environment.
40-60 GSM paper is highly recyclable and a greener option present in the market, due to which it has gained extensive market share. It will expand by almost 1.9 times its current market value by 2031.
Who are the Leading End Users in Parchment Paper Market?
Bakery & confectionary and ready-to-eat meals segments are leading the global parchment paper holding a combined market share of 63% in the year 2020. They will remain dominant due to high consumption of bakery & confectionary and ready-to-eat meal products in mature markets of North America and Europe.
It has been witnessed that the consumption of ready-to-eat meals among millennials is exponentially increasing due to changing lifestyle and eating habits. As parchment paper is grease resistant and nonstick paper, it ensures quality of food product. Therefore, in the global parchment paper market, ready-to-eat meals segment is expected to expand by 1.9 times of current value, by the end of 2031.

A unified Market Research Subscription Platform, built for today's disparate research needs.
Competitive Landscape
Companies operating in the parchment paper market are aiming at expansion and strategic partnerships with other manufacturers to expand their product manufacturing capabilities, product portfolio and global presence.
- In 2020, Nordic Paper AS started a campaign targeting professional bakers. Bakers are particular about ingredients they use in their products, because many baking paper contain fluorochemicals, which may migrate to baked goods. To prevent this, Nordic Paper launched a campaign in collaboration with National Swedish Baking Team. Also, this resulted in a positive surge in sales of unbleached parchment paper in Europe.
- In November 2019, McNairn Packaging was acquired by AmerCareRoyal LLC, which broadened its selection of food service packaging alternatives that were not present in its current portfolio.
- In July 2019, JK Paper signed an US$201.7 Mn MOU with Gujarat government to set up a new plant with 300,000 TPA capacity to facilitate modernization and expansion of Songadh unit. This increased the production of food packaging paper which will facilitate the consumption needs of parchment paper in the Indian subcontinent.
- In August 2018, Drewsen Spezialpapiere GmbH & Co. KG launched Mineral Oil Repellent Barrier Paper for food safety as aromatic mineral oils are harmful to human body and considered carcinogenic in nature.
- In 2018, Ahlstrom Munksjo Oyj. acquired the U.S.-based Expera Specialty Paper from KPS Capital Partners and Brazilian Caieiras plant from MD Papeis. Due to this production capacity of company increased as they captured food packaging paper distribution chains of acquired institutions.
Scope of Report
Attribute |
Details |
Forecast Period |
2021-2031 |
Historical Data Available for |
2015-2020 |
Market Analysis |
USD Million for Value and Tonnes for Volume |
Key Countries Covered |
US, Canada, Brazil, Mexico, Germany U.K., France, Italy, Spain, Russia, Poland, China, Japan, India, Australia, New Zealand, GCC Countries, Turkey, Northern Africa, and South Africa |
Key Segments Covered |
Product type, Basis Weight, End Use end Region |
Key Companies Profiled |
|
Report Coverage |
Market Forecast, Company Share Analysis, Competition Intelligence, DROT Analysis, Market Dynamics and Challenges, and Strategic Growth Initiatives |
Customization & Pricing |
Available upon Request |
Parchment Paper Market by Category
By Product Type:
- Bleached Parchment Paper
- Unbleached Parchment Paper
By Basis Weight:
- Less than 40 GSM Parchment Paper
- 41 to 60 GSM Parchment Paper
- 61 to 80 GSM Parchment Paper
By End Use:
- Bakery and Confectionary
- Ready-to-Eat Meals
- Fresh Produce
- Others
By Region:
- North America
- Latin America
- Europe
- MEA
- East Asia
- South Asia
- Oceania
Frequently Asked Questions
The parchment paper market is expected to surpass a valuation of US$ 959.3 Mn by 2021.
The parchment paper market exhibited steady CAGR of 3.3% in the last five years from 2015 to 2020.
Parchment paper market will register gradual rise in demand after a period of decelerating sales amid COVID-19 in 2020. As per FMI, the market will register a CAGR of 5.8% between 2021 and 2031.
Key parchment paper manufacturers are making solutions available that will help industries to eliminate the risk of food poisoning. Also there is high focus on production of sustainable yet greener packaging solution.
Increasing demand for lightweight, safe and hygienic packaging solutions for food and food services will drive sales in the parchment paper market.
North America will remain the second-leading market for parchment papers, accounting for nearly 22% of sales globally.
The top five companies operating in the parchment paper market are Georgia-Pacific Corp., Ahlstrom-Munksjo Oyj., METSA Tissue, Delfort Group AG, Nordic Paper AS. These companies covered nearly 20% to 25% of the overall market in 2020.
FMI has projected that the Europe parchment paper market, being a mature market, will exhibit a CAGR of 4.9% between 2021 and 2031 and will have an incremental rate of US$ 185.9 Mn
The U.S., Canada, China, Russia, and the U.K. are among leading markets for parchment papers, exhibiting consistently high demand.
As per FMI, the Japan parchment paper market is expected to rise at 7.6% CAGR between 2021 and 2031 and expand almost 2.13 times at its current market value.
Table of Content
1. Executive Summary
1.1. Global Market Outlook
1.2. Market Analysis
1.3. Analysis and Recommendations
2. Market Overview
2.1. Market Coverage
2.2. Market Definition
3. Key Market Trends
3.1. Key Trends Impacting the Market
3.2. Product Innovation Trends
4. Key Success Factors
4.1. Product Adoption Analysis
4.2. Product USPs / Features
5. Global Parchment Paper Market Demand Analysis 2015–2020 and Forecast, 2021–2031
5.1. Historical Market Volume (Tonnes) Analysis, 2015–2020
5.2. Current and Future Market Volume (Tonnes) Projections, 2021–2031
5.3. Y-o-Y Growth Trend Analysis
6. Global Parchment Paper Market - Pricing Analysis
6.1. Regional Pricing Analysis
6.2. Pricing Break-up
7. Global Parchment Paper Market Demand (Value in US$ Mn) Analysis 2015–2020 and Forecast, 2021–2031
7.1. Historical Market Value (US$ Mn) Analysis, 2015–2020
7.2. Current and Future Market Value (US$ Mn) Projections, 2021–2031
7.2.1. Y-o-Y Growth Trend Analysis
7.2.2. Absolute $ Opportunity Analysis
8. Market Background
8.1. Global Packaging Market Outlook
8.2. Global GDP Growth Outlook
8.2.1. GDP (Nominal) in US$ Bn Country-wise Outlook (2020)
8.2.2. GDP Growth Rate (Y-o-Y), 2012–2019
8.3. Global Paper Recycling Industry Outlook
8.4. Macro-Economic Factors
8.4.1. Global Flexible Packaging Industry Growth
8.4.2. Global Paper and Pulp Industry Growth
8.4.3. COVID-19 Pandemic
8.4.4. Global Food Services Industry Growth
8.4.5. Global Retail Industry Growth
8.5. Forecast Factors - Relevance & Impact
8.5.1. Global Flexible Packaging Market Growth
8.5.2. Global Food and Food Services Industry Growth
8.5.3. Paper Packaging Industry Growth
8.5.4. Global Retail Market Growth
8.5.5. Segmental Revenue Growth
8.5.6. Manufacturing Value Added (M.V.A.) Growth
8.6. Value Chain Analysis
8.6.1. Key Participants
8.6.1.1. Raw Material Suppliers
8.6.1.2. Parchment Paper Manufacturers
8.6.1.3. Distributors
8.6.2. Profitability Margin
8.7. Market Dynamics
8.7.1. Drivers
8.7.2. Restraints
8.7.3. Opportunity Analysis
8.8. Impact of COVID-19
8.8.1. Current Statistics and Probable Future Impact
8.8.2. Impact of COVID-19 on Parchment Paper Market
9. Global Parchment Paper Market Analysis 2015–2020 and Forecast 2021–2031, By Product Type
9.1. Introduction
9.2. Historical Market Size (US$ Mn) and Volume (Tonnes) Analysis, By Product Type, 2015–2020
9.3. Current and Future Market Size (US$ Mn) and Volume (Tonnes) Analysis and Forecast, By Product Type ,2021–2031
9.3.1. Bleached
9.3.2. Unbleached
9.4. Market Attractiveness Analysis, By Product Type
10. Global Parchment Paper Market Analysis 2015–2020 and Forecast 2021–2031, By Basis Weight
10.1. Introduction
10.2. Historical Market Size (US$ Mn) and Volume (Tonnes) Analysis, By Basis Weight, 2015–2020
10.3. Current and Future Market Size (US$ Mn) and Volume (Tonnes) Analysis and Forecast, By Basis Weight, 2021–2031
10.3.1. Below 40 GSM
10.3.2. 41 to 60 GSM
10.3.3. 61 to 80 GSM
10.4. Market Attractiveness Analysis, By Basis Weight
11. Global Parchment Paper Market Analysis 2015–2020 and Forecast 2021–2031, By End Use
11.1. Introduction
11.2. Historical Market Size (US$ Mn) and Volume (Tonnes) Analysis, By End Use, 2015–2020
11.3. Current and Future Market Size (US$ Mn) and Volume (Tonnes) Analysis and Forecast, By End Use, 2021–2031
11.3.1. Bakery & Confectionary
11.3.2. Ready-to-Eat Meals
11.3.3. Fresh Produce
11.3.4. Others
11.4. Market Attractiveness Analysis, By End Use
12. Global Parchment Paper Market Analysis 2015–2020 and Forecast 2021–2031, by Region
12.1. Introduction
12.2. Historical Market Size (US$ Mn) and Volume (Tonnes) Analysis, by Region, 2015–2020
12.3. Current Market Size (US$ Mn) and Volume (Tonnes) Analysis and Forecast, by Region, 2021–2031
12.3.1. North America
12.3.2. Latin America
12.3.3. Europe
12.3.4. Middle East and Africa (MEA)
12.3.5. East Asia
12.3.6. South Asia
12.3.7. Oceania
12.4. Market Attractiveness Analysis, by Region
13. North America Parchment Paper Market Analysis 2015–2020 and Forecast 2021–2031
13.1. Introduction
13.2. Historical Market Size (US$ Mn) and Volume (Tonnes) Analysis, by Market Taxonomy, 2015–2020
13.3. Market Size (US$ Mn) and Volume (Tonnes) Forecast, by Market Taxonomy, 2021–2031
13.3.1. By Country
13.3.1.1. U.S.
13.3.1.2. Canada
13.3.2. By Product Type
13.3.3. By Basis Weight
13.3.4. By End Use
13.4. Market Attractiveness Analysis
13.4.1. By Country
13.4.2. By Product Type
13.4.3. By Basis Weight
13.4.4. By End Use
14. Latin America Parchment Paper Market Analysis 2015–2020 and Forecast 2021–2031
14.1. Introduction
14.2. Historical Market Size (US$ Mn) and Volume (Tonnes) Analysis, by Market Taxonomy, 2015–2020
14.3. Market Size (US$ Mn) and Volume (Tonnes) Forecast, by Market Taxonomy, 2021–2031
14.3.1. By Country
14.3.1.1. Brazil
14.3.1.2. Mexico
14.3.1.3. Argentina
14.3.1.4. Rest of Latin America
14.3.2. By Product Type
14.3.3. By Basis Weight
14.3.4. By End Use
14.4. Market Attractiveness Analysis
14.4.1. By Country
14.4.2. By Product Type
14.4.3. By Basis Weight
14.4.4. By End Use
15. Europe Parchment Paper Market Analysis 2015–2020 and Forecast 2021–2031
15.1. Introduction
15.2. Historical Market Size (US$ Mn) and Volume (Tonnes) Analysis, by Market Taxonomy, 2015–2020
15.3. Market Size (US$ Mn) and Volume (Tonnes) Forecast, by Market Taxonomy, 2021–2031
15.3.1. By Country
15.3.1.1. Germany
15.3.1.2. Italy
15.3.1.3. France
15.3.1.4. Spain
15.3.1.5. U.K.
15.3.1.6. BENELUX
15.3.1.7. Russia
15.3.1.8. Poland
15.3.1.9. Rest of Europe
15.3.2. By Product Type
15.3.3. By Basis Weight
15.3.4. By End Use
15.4. Market Attractiveness Analysis
15.4.1. By Country
15.4.2. By Product Type
15.4.3. By Basis Weight
15.4.4. By End Use
16. Middle East and Africa Parchment Paper Market Analysis 2015–2020 and Forecast 2021–2031
16.1. Introduction
16.2. Historical Market Size (US$ Mn) and Volume (Tonnes) Analysis, by Market Taxonomy, 2015–2020
16.3. Market Size (US$ Mn) and Volume (Tonnes) Forecast, by Market Taxonomy, 2021–2031
16.3.1. By Country
16.3.1.1. GCC Countries
16.3.1.2. Turkey
16.3.1.3. Northern Africa
16.3.1.4. South Africa
16.3.1.5. Rest of Middle East and Africa
16.3.2. By Product Type
16.3.3. By Basis Weight
16.3.4. By End Use
16.4. Market Attractiveness Analysis
16.4.1. By Country
16.4.2. By Product Type
16.4.3. By Basis Weight
16.4.4. By End Use
17. East Asia Parchment Paper Market Analysis 2015–2020 and Forecast 2021–2031
17.1. Introduction
17.2. Historical Market Size (US$ Mn) and Volume (Tonnes) Analysis, by Market Taxonomy, 2015–2020
17.3. Market Size (US$ Mn) and Volume (Tonnes) Forecast, by Market Taxonomy, 2021–2031
17.3.1. By Country
17.3.1.1. China
17.3.1.2. Japan
17.3.1.3. South Korea
17.3.1.4. Rest of East Asia
17.3.2. By Product Type
17.3.3. By Basis Weight
17.3.4. By End Use
17.4. Market Attractiveness Analysis
17.4.1. By Product Type
17.4.2. By Basis Weight
17.4.3. By End Use
18. South Asia Parchment Paper Market Analysis 2015–2020 and Forecast 2021–2031
18.1. Introduction
18.2. Historical Market Size (US$ Mn) and Volume (Tonnes) Analysis, by Market Taxonomy, 2015–2020
18.3. Market Size (US$ Mn) and Volume (Tonnes) Forecast, by Market Taxonomy, 2021–2031
18.3.1. By Country
18.3.1.1. India
18.3.1.2. Thailand
18.3.1.3. Indonesia
18.3.1.4. Malaysia
18.3.1.5. Rest of South Asia
18.3.2. By Product Type
18.3.3. By Basis Weight
18.3.4. By End Use
18.4. Market Attractiveness Analysis
18.4.1. By Country
18.4.2. By Product Type
18.4.3. By Basis Weight
18.4.4. By End Use
19. Oceania Parchment Paper Market Analysis 2015–2020 and Forecast 2021–2031
19.1. Introduction
19.2. Historical Market Size (US$ Mn) and Volume (Tonnes) Analysis, by Market Taxonomy, 2015–2020
19.3. Market Size (US$ Mn) and Volume (Tonnes) Forecast, by Market Taxonomy, 2021–2031
19.3.1. By Country
19.3.1.1. Australia
19.3.1.2. New Zealand
19.3.2. By Product Type
19.3.3. By Basis Weight
19.3.4. By End Use
19.4. Market Attractiveness Analysis
19.4.1. By Country
19.4.2. By Product Type
19.4.3. By Basis Weight
19.4.4. By End Use
20. Parchment Paper Market Country wise Analysis 2021 & 2031
20.1. U.S. Parchment Paper Market Analysis
20.1.1. Market Volume (Tonnes) and Value (US$ Mn) Analysis and Forecast, by Market Taxonomy
20.1.1.1. By Product Type
20.1.1.2. By Basis Weight
20.1.1.3. By End Use
20.2. Canada Parchment Paper Market Analysis
20.2.1. Market Volume (Tonnes) and Value (US$ Mn) Analysis and Forecast, by Market Taxonomy
20.2.1.1. By Product Type
20.2.1.2. By Basis Weight
20.2.1.3. By End Use
20.3. Brazil Parchment Paper Market Analysis
20.3.1. Market Volume (Tonnes) and Value (US$ Mn) Analysis and Forecast, by Market Taxonomy
20.3.1.1. By Product Type
20.3.1.2. By Basis Weight
20.3.1.3. By End Use
20.4. Mexico Parchment Paper Market Analysis
20.4.1. Market Volume (Tonnes) and Value (US$ Mn) Analysis and Forecast, by Market Taxonomy
20.4.1.1. By Product Type
20.4.1.2. By Basis Weight
20.4.1.3. By End Use
20.5. Germany Parchment Paper Market Analysis
20.5.1. Market Volume (Tonnes) and Value (US$ Mn) Analysis and Forecast, by Market Taxonomy
20.5.1.1. By Product Type
20.5.1.2. By Basis Weight
20.5.1.3. By End Use
20.6. Italy Parchment Paper Market Analysis
20.6.1. Market Volume (Tonnes) and Value (US$ Mn) Analysis and Forecast, by Market Taxonomy
20.6.1.1. By Product Type
20.6.1.2. By Basis Weight
20.6.1.3. By End Use
20.7. France Parchment Paper Market Analysis
20.7.1. Market Volume (Tonnes) and Value (US$ Mn) Analysis and Forecast, by Market Taxonomy
20.7.1.1. By Product Type
20.7.1.2. By Basis Weight
20.7.1.3. By End Use
20.8. Spain Parchment Paper Market Analysis
20.8.1. Market Volume (Tonnes) and Value (US$ Mn) Analysis and Forecast, by Market Taxonomy
20.8.1.1. By Product Type
20.8.1.2. By Basis Weight
20.8.1.3. By End Use
20.9. U.K. Parchment Paper Market Analysis
20.9.1. Market Volume (Tonnes) and Value (US$ Mn) Analysis and Forecast, by Market Taxonomy
20.9.1.1. By Product Type
20.9.1.2. By Basis Weight
20.9.1.3. By End Use
20.10. Russia Parchment Paper Market Analysis
20.10.1. Market Volume (Tonnes) and Value (US$ Mn) Analysis and Forecast, by Market Taxonomy
20.10.1.1. By Product Type
20.10.1.2. By Basis Weight
20.10.1.3. By End Use
20.11. Poland Parchment Paper Market Analysis
20.11.1. Market Volume (Tonnes) and Value (US$ Mn) Analysis and Forecast, by Market Taxonomy
20.11.1.1. By Product Type
20.11.1.2. By Basis Weight
20.11.1.3. By End Use
20.12. Turkey Parchment Paper Market Analysis
20.12.1. Market Volume (Tonnes) and Value (US$ Mn) Analysis and Forecast, by Market Taxonomy
20.12.1.1. By Product Type
20.12.1.2. By Basis Weight
20.12.1.3. By End Use
20.13. South Africa Parchment Paper Market Analysis
20.13.1. Market Volume (Tonnes) and Value (US$ Mn) Analysis and Forecast, by Market Taxonomy
20.13.1.1. By Product Type
20.13.1.2. By Basis Weight
20.13.1.3. By End Use
20.14. GCC Countries Parchment Paper Market Analysis
20.14.1. Market Volume (Tonnes) and Value (US$ Mn) Analysis and Forecast, by Market Taxonomy
20.14.1.1. By Product Type
20.14.1.2. By Basis Weight
20.14.1.3. By End Use
20.15. Japan Parchment Paper Market Analysis
20.15.1. Market Volume (Tonnes) and Value (US$ Mn) Analysis and Forecast, by Market Taxonomy
20.15.1.1. By Product Type
20.15.1.2. By Basis Weight
20.15.1.3. By End Use
20.16. South Korea Parchment Paper Market Analysis
20.16.1. Market Volume (Tonnes) and Value (US$ Mn) Analysis and Forecast, by Market Taxonomy
20.16.1.1. By Product Type
20.16.1.2. By Basis Weight
20.16.1.3. By End Use
20.17. India Parchment Paper Market Analysis
20.17.1. Market Volume (Tonnes) and Value (US$ Mn) Analysis and Forecast, by Market Taxonomy
20.17.1.1. By Product Type
20.17.1.2. By Basis Weight
20.17.1.3. By End Use
20.18. China Parchment Paper Market Analysis
20.18.1. Market Volume (Tonnes) and Value (US$ Mn) Analysis and Forecast, by Market Taxonomy
20.18.1.1. By Product Type
20.18.1.2. By Basis Weight
20.18.1.3. By End Use
20.19. Australia Parchment Paper Market Analysis
20.19.1. Market Volume (Tonnes) and Value (US$ Mn) Analysis and Forecast, by Market Taxonomy
20.19.1.1. By Product Type
20.19.1.2. By Basis Weight
20.19.1.3. By End Use
20.20. New Zealand Parchment Paper Market Analysis
20.20.1. Market Volume (Tonnes) and Value (US$ Mn) Analysis and Forecast, by Market Taxonomy
20.20.1.1. By Product Type
20.20.1.2. By Basis Weight
20.20.1.3. By End Use
21. Market Structure Analysis
21.1. Market Analysis, by Tier of Parchment Paper Companies
21.2. Market Share Analysis of Top Players
21.3. Market Presence Analysis
22. Competition Analysis
22.1. Competition Dashboard
22.2. Competition Benchmarking
22.3. Competition Deep Dive
22.3.1. Georgia-Pacific Corp.
22.3.1.1. Overview
22.3.1.2. Product Portfolio
22.3.1.3. Profitability by Market Segments
22.3.1.4. Sales Footprint
22.3.1.5. Strategy Overview
22.3.1.5.1. Marketing Strategy
22.3.1.5.2. Product Strategy
22.3.1.5.3. Channel Strategy
22.3.2. KALPATARU PAPERS LLP
22.3.2.1. Overview
22.3.2.2. Product Portfolio
22.3.2.3. Profitability by Market Segments
22.3.2.4. Sales Footprint
22.3.2.5. Strategy Overview
22.3.2.5.1. Marketing Strategy
22.3.2.5.2. Product Strategy
22.3.2.5.3. Channel Strategy
22.3.3. Pudumjee Paper Products
22.3.3.1. Overview
22.3.3.2. Product Portfolio
22.3.3.3. Profitability by Market Segments
22.3.3.4. Sales Footprint
22.3.3.5. Strategy Overview
22.3.3.5.1. Marketing Strategy
22.3.3.5.2. Product Strategy
22.3.3.5.3. Channel Strategy
22.3.4. JK Paper
22.3.4.1. Overview
22.3.4.2. Product Portfolio
22.3.4.3. Profitability by Market Segments
22.3.4.4. Sales Footprint
22.3.4.5. Strategy Overview
22.3.4.5.1. Marketing Strategy
22.3.4.5.2. Product Strategy
22.3.4.5.3. Channel Strategy
22.3.5. Ahlstrom Munksjo Oyj.
22.3.5.1. Overview
22.3.5.2. Product Portfolio
22.3.5.3. Profitability by Market Segments
22.3.5.4. Sales Footprint
22.3.5.5. Strategy Overview
22.3.5.5.1. Marketing Strategy
22.3.5.5.2. Product Strategy
22.3.5.5.3. Channel Strategy
22.3.6. Drewsen Spezialpapiere GmbH & Co. KG
22.3.6.1. Overview
22.3.6.2. Product Portfolio
22.3.6.3. Profitability by Market Segments
22.3.6.4. Sales Footprint
22.3.6.5. Strategy Overview
22.3.6.5.1. Marketing Strategy
22.3.6.5.2. Product Strategy
22.3.6.5.3. Channel Strategy
22.3.7. Delfort Group AG
22.3.7.1. Overview
22.3.7.2. Product Portfolio
22.3.7.3. Profitability by Market Segments
22.3.7.4. Sales Footprint
22.3.7.5. Strategy Overview
22.3.7.5.1. Marketing Strategy
22.3.7.5.2. Product Strategy
22.3.7.5.3. Channel Strategy
22.3.8. METSÄ TISSUE
22.3.8.1. Overview
22.3.8.2. Product Portfolio
22.3.8.3. Profitability by Market Segments
22.3.8.4. Sales Footprint
22.3.8.5. Strategy Overview
22.3.8.5.1. Marketing Strategy
22.3.8.5.2. Product Strategy
22.3.8.5.3. Channel Strategy
22.3.9. McNairn Packaging
22.3.9.1. Overview
22.3.9.2. Product Portfolio
22.3.9.3. Profitability by Market Segments
22.3.9.4. Sales Footprint
22.3.9.5. Strategy Overview
22.3.9.5.1. Marketing Strategy
22.3.9.5.2. Product Strategy
22.3.9.5.3. Channel Strategy
22.3.10. Awa Paper and Technological Co. Inc.
22.3.10.1. Overview
22.3.10.2. Product Portfolio
22.3.10.3. Profitability by Market Segments
22.3.10.4. Sales Footprint
22.3.10.5. Strategy Overview
22.3.10.5.1. Marketing Strategy
22.3.10.5.2. Product Strategy
22.3.10.5.3. Channel Strategy
22.3.11. Cosmoplast
22.3.11.1. Overview
22.3.11.2. Product Portfolio
22.3.11.3. Profitability by Market Segments
22.3.11.4. Sales Footprint
22.3.11.5. Strategy Overview
22.3.11.5.1. Marketing Strategy
22.3.11.5.2. Product Strategy
22.3.11.5.3. Channel Strategy
22.3.12. Vicat Papeteris de Vizille
22.3.12.1. Overview
22.3.12.2. Product Portfolio
22.3.12.3. Profitability by Market Segments
22.3.12.4. Sales Footprint
22.3.12.5. Strategy Overview
22.3.12.5.1. Marketing Strategy
22.3.12.5.2. Product Strategy
22.3.12.5.3. Channel Strategy
22.3.13. Nordic Paper AS
22.3.13.1. Overview
22.3.13.2. Product Portfolio
22.3.13.3. Profitability by Market Segments
22.3.13.4. Sales Footprint
22.3.13.5. Strategy Overview
22.3.13.5.1. Marketing Strategy
22.3.13.5.2. Product Strategy
22.3.13.5.3. Channel Strategy
22.3.14. The GRIFF Network
22.3.14.1. Overview
22.3.14.2. Product Portfolio
22.3.14.3. Profitability by Market Segments
22.3.14.4. Sales Footprint
22.3.14.5. Strategy Overview
22.3.14.5.1. Marketing Strategy
22.3.14.5.2. Product Strategy
22.3.14.5.3. Channel Strategy
22.3.15. KRPA Paper AS
22.3.15.1. Overview
22.3.15.2. Product Portfolio
22.3.15.3. Profitability by Market Segments
22.3.15.4. Sales Footprint
22.3.15.5. Strategy Overview
22.3.15.5.1. Marketing Strategy
22.3.15.5.2. Product Strategy
22.3.15.5.3. Channel Strategy
22.3.16. Formacia Paper
22.3.16.1. Overview
22.3.16.2. Product Portfolio
22.3.16.3. Profitability by Market Segments
22.3.16.4. Sales Footprint
22.3.16.5. Strategy Overview
22.3.16.5.1. Marketing Strategy
22.3.16.5.2. Product Strategy
22.3.16.5.3. Channel Strategy
22.3.17. Parchment & Paper Products Co
22.3.17.1. Overview
22.3.17.2. Product Portfolio
22.3.17.3. Profitability by Market Segments
22.3.17.4. Sales Footprint
22.3.17.5. Strategy Overview
22.3.17.5.1. Marketing Strategy
22.3.17.5.2. Product Strategy
22.3.17.5.3. Channel Strategy
22.3.18. Savy Packaging Pvt. Ltd.
22.3.18.1. Overview
22.3.18.2. Product Portfolio
22.3.18.3. Profitability by Market Segments
22.3.18.4. Sales Footprint
22.3.18.5. Strategy Overview
22.3.18.5.1. Marketing Strategy
22.3.18.5.2. Product Strategy
22.3.18.5.3. Channel Strategy
22.3.19. Star Stuff Group
22.3.19.1. Overview
22.3.19.2. Product Portfolio
22.3.19.3. Profitability by Market Segments
22.3.19.4. Sales Footprint
22.3.19.5. Strategy Overview
22.3.19.5.1. Marketing Strategy
22.3.19.5.2. Product Strategy
22.3.19.5.3. Channel Strategy
22.3.20. Hangzhou Guanglian Complex Paper Co., Ltd
22.3.20.1. Overview
22.3.20.2. Product Portfolio
22.3.20.3. Profitability by Market Segments
22.3.20.4. Sales Footprint
22.3.20.5. Strategy Overview
22.3.20.5.1. Marketing Strategy
22.3.20.5.2. Product Strategy
22.3.20.5.3. Channel Strategy
*The above list is indicative in nature and is subject to change during the course of research
23. Assumptions and Acronyms Used
24. Research Methodology
Let us know your requirement to get
100% FREE customization
List of Tables
Table 01: Global Parchment Paper Market Value (US$ Mn) Analysis, by Product Type, 2015H-2031F
Table 02: Global Parchment Paper Market Volume (Tonnes) Analysis, by Product Type, 2015H-2031F
Table 03: Global Parchment Paper Market Value (US$ Mn) Analysis, by Basis Weight, 2015H-2031F
Table 04: Global Parchment Paper Market Volume (Tonnes) Analysis, by Basis Weight, 2015H-2031F
Table 05: Global Parchment Paper Market Value (US$ Mn) Analysis, by End Use, 2015H-2031F
Table 06: Global Parchment Paper Market Volume (Tonnes) Analysis, by End Use, 2015H-2031F
Table 07: Global Parchment Paper Market Value (US$ Mn) Analysis, by Region, 2015H-2031F
Table 08: Global Parchment Paper Market Volume (Tonnes) Analysis, by Region, 2015H-2031F
Table 09: North America Parchment Paper Market Value (US$ Mn) Analysis, by Product Type, 2015H-2031F
Table 10: North America Parchment Paper Market Volume (Tonnes) Analysis, by Product Type, 2015H-2031F
Table 11: North America Parchment Paper Market Value (US$ Mn) Analysis, by Basis Weight, 2015H-2031F
Table 12: North America Parchment Paper Market Volume (Tonnes) Analysis, by Basis Weight, 2015H-2031F
Table 13: North America Parchment Paper Market Value (US$ Mn) Analysis, by End Use, 2015H-2031F
Table 14: North America Parchment Paper Market Volume (Tonnes) Analysis, by End Use, 2015H-2031F
Table 15: North America Parchment Paper Market Value (US$ Mn) Analysis, by Country, 2015H-2031F
Table 16: North America Parchment Paper Market Volume (Tonnes) Analysis, by Country, 2015H-2031F
Table 17: Latin America Parchment Paper Market Value (US$ Mn) Analysis, by Product Type, 2015H-2031F
Table 18: Latin America Parchment Paper Market Volume (Tonnes) Analysis, by Product Type, 2015H-2031F
Table 19: Latin America Parchment Paper Market Value (US$ Mn) Analysis, by Basis Weight, 2015H-2031F
Table 20: Latin America Parchment Paper Market Volume (Tonnes) Analysis, by Basis Weight, 2015H-2031F
Table 21: Latin America Parchment Paper Market Value (US$ Mn) Analysis, by End Use, 2015H-2031F
Table 22: Latin America Parchment Paper Market Volume (Tonnes) Analysis, by End Use, 2015H-2031F
Table 23: Latin America Parchment Paper Market Value (US$ Mn) Analysis, by Country, 2015H-2031F
Table 24: Latin America Parchment Paper Market Volume (Tonnes) Analysis, by Country, 2015H-2031F
Table 25: Europe Parchment Paper Market Value (US$ Mn) Analysis, by Product Type, 2015H-2031F
Table 26: Europe Parchment Paper Market Volume (Tonnes) Analysis, by Product Type, 2015H-2031F
Table 27: Europe Parchment Paper Market Value (US$ Mn) Analysis, by Basis Weight, 2015H-2031F
Table 28: Europe Parchment Paper Market Volume (Tonnes) Analysis, by Basis Weight, 2015H-2031F
Table 29: Europe Parchment Paper Market Value (US$ Mn) Analysis, by End Use, 2015H-2031F
Table 30: Europe Parchment Paper Market Volume (Tonnes) Analysis, by End Use, 2015H-2031F
Table 31: Europe Parchment Paper Market Value (US$ Mn) Analysis, by Country, 2015H-2031F
Table 32: Europe Parchment Paper Market Volume (Tonnes) Analysis, by Country, 2015H-2031F
Table 33: MEA Parchment Paper Market Value (US$ Mn) Analysis, by Product Type, 2015H-2031F
Table 34: MEA Parchment Paper Market Volume (Tonnes) Analysis, by Product Type, 2015H-2031F
Table 35: MEA Parchment Paper Market Value (US$ Mn) Analysis, by Basis Weight, 2015H-2031F
Table 36: MEA Parchment Paper Market Volume (Tonnes) Analysis, by Basis Weight, 2015H-2031F
Table 37: MEA Parchment Paper Market Value (US$ Mn) Analysis, by End Use, 2015H-2031F
Table 38: MEA Parchment Paper Market Volume (Tonnes) Analysis, by End Use, 2015H-2031F
Table 39: MEA Parchment Paper Market Value (US$ Mn) Analysis, by Country, 2015H-2031F
Table 40: MEA Parchment Paper Market Volume (Tonnes) Analysis, by Country, 2015H-2031F
Table 41: East Asia Parchment Paper Market Value (US$ Mn) Analysis, by Product Type, 2015H-2031F
Table 42: East Asia Parchment Paper Market Volume (Tonnes) Analysis, by Product Type, 2015H-2031F
Table 43: East Asia Parchment Paper Market Value (US$ Mn) Analysis, by Basis Weight, 2015H-2031F
Table 44: East Asia Parchment Paper Market Volume (Tonnes) Analysis, by Basis Weight, 2015H-2031F
Table 45: East Asia Parchment Paper Market Value (US$ Mn) Analysis, by End Use, 2015H-2031F
Table 46: East Asia Parchment Paper Market Volume (Tonnes) Analysis, by End Use, 2015H-2031F
Table 47: East Asia Parchment Paper Market Value (US$ Mn) Analysis, by Country, 2015H-2031F
Table 48: East Asia Parchment Paper Market Volume (Tonnes) Analysis, by Country, 2015H-2031F
Table 49: South Asia Parchment Paper Market Value (US$ Mn) Analysis, by Product Type, 2015H-2031F
Table 50: South Asia Parchment Paper Market Volume (Tonnes) Analysis, by Product Type, 2015H-2031F
Table 51: South Asia Parchment Paper Market Value (US$ Mn) Analysis, by Basis Weight, 2015H-2031F
Table 52: South Asia Parchment Paper Market Volume (Tonnes) Analysis, by Basis Weight, 2015H-2031F
Table 53: South Asia Parchment Paper Market Value (US$ Mn) Analysis, by End Use, 2015H-2031F
Table 54: South Asia Parchment Paper Market Volume (Tonnes) Analysis, by End Use, 2015H-2031F
Table 55: South Asia Parchment Paper Market Value (US$ Mn) Analysis, by Country, 2015H-2031F
Table 56: South Asia Parchment Paper Market Volume (Tonnes) Analysis, by Country, 2015H-2031F
Table 57: Oceania Parchment Paper Market Value (US$ Mn) Analysis, by Product Type, 2015H-2031F
Table 58: Oceania Parchment Paper Market Volume (Tonnes) Analysis, by Product Type, 2015H-2031F
Table 59: Oceania Parchment Paper Market Value (US$ Mn) Analysis, by Basis Weight, 2015H-2031F
Table 60: Oceania Parchment Paper Market Volume (Tonnes) Analysis, by Basis Weight, 2015H-2031F
Table 61: Oceania Parchment Paper Market Value (US$ Mn) Analysis, by End Use, 2015H-2031F
Table 62: Oceania Parchment Paper Market Volume (Tonnes) Analysis, by End Use, 2015H-2031F
Table 63: Oceania Parchment Paper Market Value (US$ Mn) Analysis, by Country, 2015H-2031F
Table 64: Oceania Parchment Paper Market Volume (Tonnes) Analysis, by Country, 2015H-2031F
Find your sweet spots for generating winning opportunities in this market.
Talk to AnalystList of Charts
Figure 01: Global Parchment Paper Market Share Analysis by Product Type, 2021E & 2031F
Figure 02: Global Parchment Paper Market Y-o-Y Analysis by Product Type, 2019H-2031F
Figure 03: Global Parchment Paper Market Attractiveness Analysis by Product Type, 2021E-2031F
Figure 04: Global Parchment Paper Market Share Analysis by Basis Weight, 2021E & 2031F
Figure 05: Global Parchment Paper Market Y-o-Y Analysis by Basis Weight, 2019H-2031F
Figure 06: Global Parchment Paper Market Attractiveness Analysis by Basis Weight, 2021E-2031F
Figure 07: Global Parchment Paper Market Share Analysis by End Use, 2021E & 2031F
Figure 08: Global Parchment Paper Market Y-o-Y Analysis by End Use, 2019H-2031F
Figure 09: Global Parchment Paper Market Attractiveness Analysis by End Use, 2021E-2031F
Figure 10: Global Parchment Paper Market Share Analysis by Region 2021E & 2031F
Figure 11: Global Parchment Paper Market Y-o-Y Analysis by Region, 2019H-2031F
Figure 12: Global Parchment Paper Market Attractiveness Analysis by Region, 2021E-2031F
Figure 13: North America Parchment Paper Market Attractiveness Analysis by Basis Weight, 2021E-2031F
Figure 14: North America Parchment Paper Market Y-o-Y Analysis by Product Type, 2019H-2031F
Figure 15: North America Parchment Paper Market Value Share Analysis by End Use 2021(E)
Figure 16: North America Parchment Paper Market Share Analysis by Country, 2021E & 2031F
Figure 17: Latin America Parchment Paper Market Attractiveness Analysis by Basis Weight, 2021E-2031F
Figure 18: Latin America Parchment Paper Market Y-o-Y Analysis by Product Type, 2019H-2031F
Figure 19: Latin America Parchment Paper Market Value Share Analysis by End Use 2021(E)
Figure 20: Latin America Parchment Paper Market Share Analysis by Country, 2021E & 2031F
Figure 21: Europe Parchment Paper Market Attractiveness Analysis by Basis Weight, 2021E-2031F
Figure 22: Europe Parchment Paper Market Y-o-Y Analysis by Product Type, 2019H-2031F
Figure 23: Europe Parchment Paper Market Value Share Analysis by End Use 2021(E)
Figure 24: Europe Parchment Paper Market Share Analysis by Country, 2021E & 2031F
Figure 25: MEA Parchment Paper Market Attractiveness Analysis by Basis Weight, 2021E-2031F
Figure 26: MEA Parchment Paper Market Y-o-Y Analysis by Product Type, 2019H-2031F
Figure 27: MEA Parchment Paper Market Value Share Analysis by End Use 2021(E)
Figure 28: MEA Parchment Paper Market Share Analysis by Country, 2021E & 2031F
Figure 29: East Asia Parchment Paper Market Attractiveness Analysis by Basis Weight, 2021E-2031F
Figure 30: East Asia Parchment Paper Market Y-o-Y Analysis by Product Type, 2019H-2031F
Figure 31: East Asia Parchment Paper Market Value Share Analysis by End Use 2021(E)
Figure 32: East Asia Parchment Paper Market Share Analysis by Country, 2021E & 2031F
Figure 33: South Asia Parchment Paper Market Attractiveness Analysis by Basis Weight, 2021E-2031F
Figure 34: South Asia Parchment Paper Market Y-o-Y Analysis by Product Type, 2019H-2031F
Figure 35: South Asia Parchment Paper Market Value Share Analysis by End Use 2021(E)
Figure 36: South Asia Parchment Paper Market Share Analysis by Country, 2021E & 2031F
Figure 37: Oceania Parchment Paper Market Attractiveness Analysis by Basis Weight, 2021E-2031F
Figure 38: Oceania Parchment Paper Market Y-o-Y Analysis by Product Type, 2019H-2031F
Figure 39: Oceania Parchment Paper Market Value Share Analysis by End Use 2021(E)
Figure 40: Oceania Parchment Paper Market Share Analysis by Country, 2021E & 2031F
Figure 41: U.S. Parchment Paper Market Value Share Analysis, by Basis Weight, 2021E & 2031F
Figure 42: U.S. Parchment Paper Market Value Share Analysis, by Product Type, 2021E & 2031F
Figure 43: U.S. Parchment Paper Market Value Share Analysis, by End Use, 2021E & 2031F
Figure 44: Canada Parchment Paper Market Value Share Analysis, by Basis Weight, 2021E & 2031F
Figure 45: Canada Parchment Paper Market Value Share Analysis, by Product Type, 2021E & 2031F
Figure 46: Canada Parchment Paper Market Value Share Analysis, by End Use, 2021E & 2031F
Figure 47: Brazil Parchment Paper Market Value Share Analysis, by Basis Weight, 2021E & 2031F
Figure 48: Brazil Parchment Paper Market Value Share Analysis, by Product Type, 2021E & 2031F
Figure 49: Brazil Parchment Paper Market Value Share Analysis, by End Use, 2021E & 2031F
Figure 50: Mexico Parchment Paper Market Value Share Analysis, by Basis Weight, 2021E & 2031F
Figure 51: Mexico Parchment Paper Market Value Share Analysis, by Product Type, 2021E & 2031F
Figure 52: Mexico Parchment Paper Market Value Share Analysis, by End Use, 2021E & 2031F
Figure 53: Germany Parchment Paper Market Value Share Analysis, by Basis Weight, 2021E & 2031F
Figure 54: Germany Parchment Paper Market Value Share Analysis, by Product Type, 2021E & 2031F
Figure 55: Germany Parchment Paper Market Value Share Analysis, by End Use, 2021E & 2031F
Figure 56: Italy Parchment Paper Market Value Share Analysis, by Basis Weight, 2021E & 2031F
Figure 57: Italy Parchment Paper Market Value Share Analysis, by Product Type, 2021E & 2031F
Figure 58: Italy Parchment Paper Market Value Share Analysis, by End Use, 2021E & 2031F
Figure 59: France Parchment Paper Market Value Share Analysis, by Basis Weight, 2021E & 2031F
Figure 60: France Parchment Paper Market Value Share Analysis, by Product Type, 2021E & 2031F
Figure 61: France Parchment Paper Market Value Share Analysis, by End Use, 2021E & 2031F
Figure 62: United Kingdom Parchment Paper Market Value Share Analysis, by Basis Weight, 2021E & 2031F
Figure 63: United Kingdom Parchment Paper Market Value Share Analysis, by Product Type, 2021E & 2031F
Figure 64: United Kingdom Parchment Paper Market Value Share Analysis, by End Use, 2021E & 2031F
Figure 65: Spain Parchment Paper Market Value Share Analysis, by Basis Weight, 2021E & 2031F
Figure 66: Spain Parchment Paper Market Value Share Analysis, by Product Type, 2021E & 2031F
Figure 67: Spain Parchment Paper Market Value Share Analysis, by End Use, 2021E & 2031F
Figure 68: Russia Parchment Paper Market Value Share Analysis, by Basis Weight, 2021E & 2031F
Figure 69: Russia Parchment Paper Market Value Share Analysis, by Product Type, 2021E & 2031F
Figure 70: Russia Parchment Paper Market Value Share Analysis, by End Use, 2021E & 2031F
Figure 71: Poland Parchment Paper Market Value Share Analysis, by Basis Weight, 2021E & 2031F
Figure 72: Poland Parchment Paper Market Value Share Analysis, by Product Type, 2021E & 2031F
Figure 73: Poland Parchment Paper Market Value Share Analysis, by End Use, 2021E & 2031F
Figure 74: Turkey Parchment Paper Market Value Share Analysis, by Basis Weight, 2021E & 2031F
Figure 75: Turkey Parchment Paper Market Value Share Analysis, by Product Type, 2021E & 2031F
Figure 76: Turkey Parchment Paper Market Value Share Analysis, by End Use, 2021E & 2031F
Figure 77: GCC Parchment Paper Market Value Share Analysis, by Basis Weight, 2021E & 2031F
Figure 78: GCC Parchment Paper Market Value Share Analysis, by Product Type, 2021E & 2031F
Figure 79: GCC Parchment Paper Market Value Share Analysis, by End Use, 2021E & 2031F
Figure 80: South Africa Parchment Paper Market Value Share Analysis, by Basis Weight, 2021E & 2031F
Figure 81: South Africa Parchment Paper Market Value Share Analysis, by Product Type, 2021E & 2031F
Figure 82: South Africa Parchment Paper Market Value Share Analysis, by End Use, 2021E & 2031F
Figure 83: Japan Parchment Paper Market Value Share Analysis, by Basis Weight, 2021E & 2031F
Figure 84: Japan Parchment Paper Market Value Share Analysis, by Product Type, 2021E & 2031F
Figure 85: Japan Parchment Paper Market Value Share Analysis, by End Use, 2021E & 2031F
Figure 86: South Korea Parchment Paper Market Value Share Analysis, by Basis Weight, 2021E & 2031F
Figure 87: South Korea Parchment Paper Market Value Share Analysis, by Product Type, 2021E & 2031F
Figure 88: South Korea Parchment Paper Market Value Share Analysis, by End Use, 2021E & 2031F
Figure 89: India Parchment Paper Market Value Share Analysis, by Basis Weight, 2021E & 2031F
Figure 90: India Parchment Paper Market Value Share Analysis, by Product Type, 2021E & 2031F
Figure 91: India Parchment Paper Market Value Share Analysis, by End Use, 2021E & 2031F
Figure 92: China Parchment Paper Market Value Share Analysis, by Basis Weight, 2021E & 2031F
Figure 93: China Parchment Paper Market Value Share Analysis, by Product Type, 2021E & 2031F
Figure 94: China Parchment Paper Market Value Share Analysis, by End Use, 2021E & 2031F
Figure 95: Australia Parchment Paper Market Value Share Analysis, by Basis Weight, 2021E & 2031F
Figure 96: Australia Parchment Paper Market Value Share Analysis, by Product Type, 2021E & 2031F
Figure 97: Australia Parchment Paper Market Value Share Analysis, by End Use, 2021E & 2031F
Figure 98: New Zealand Parchment Paper Market Value Share Analysis, by Basis Weight, 2021E & 2031F
Figure 99: New Zealand Parchment Paper Market Value Share Analysis, by Product Type, 2021E & 2031F
Figure 100: New Zealand Parchment Paper Market Value Share Analysis, by End Use, 2021E & 2031F
Need specific information?
Request CustomizationExplore Packaging Insights
View Reports