Pellet Machine Market Size, Share & Forecast Outlook 2025 to 2035

In 2025, the global pellet machine market is estimated to be worth USD 2.5 billion and is projected to reach USD 3.8 billion by 2035, growing at a CAGR of 4.4% over the forecast period.
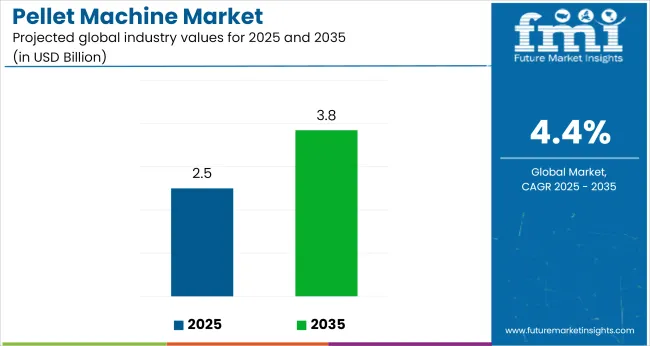
Quick Stats of Pellet Machine Market

  • Market Value (2025): USD 2.5 billion
  • Forecast Value (2035): USD 3.8 billion
  • Forecast CAGR: 4.4%
  • Leading Segment in 2025: Flat Die (61% share)
  • Key Growth Region: Europe (United Kingdom)
  • Top Player: CPM- California Pellet Mill (USA)holding 17% industry share

Pellet Machine Market

Growth is driven by the increasing demand for pelletized feed and biomass pellets in industries such as animal feed, biomass energy, and fertilizers. These machines, which convert raw materials like wood chips, agricultural waste, and feedstock into uniform, compact pellets, are becoming essential in industries requiring enhanced durability and functionality.

The pellet machine market holds a specialized position within several broader markets, with its share varying by sector. It makes up roughly 6-8% of the biomass processing equipment industry, supported by demand for biomass fuel production. In the feed processing equipment industry, its share is estimated at 10-12%, driven by consistent use in producing feed for poultry, livestock, and aquaculture.

The industry captures less than 1% of the overall machinery and equipment market, given the sector’s large scale. In the renewable energy equipment industry, pellet machines account for about 3-4%, linked to biomass energy adoption. Within the agricultural machinery market, they represent around 2-3%, primarily used for processing crop waste into pellets for reuse.

Stefan Scheiber, CEO of Bühler Group, emphasizes the impact of automation and IoT on modern pellet production, noting that fully automatic machines now account for 40% of the market. He cites Bühler’s internal data showing these systems reduce labor costs by 30% while improving nutrient retention in animal feed formulations.

Scheiber frames this shift as a move toward precision-driven manufacturing, where operational efficiency and feed quality are enhanced simultaneously. He positions Bühler’s automation portfolio as central to this transition, meeting the demand for scalable, data-enabled solutions in livestock nutrition and industrial feed processing.

Analyzing Pellet Machine Market by Top Investment Segments

The pellet machine market is expected to see strong growth in 2025, driven by increasing demand for renewable energy and biomass solutions, with a focus on flat die pellet machines, wood material, and biomass fuel applications.
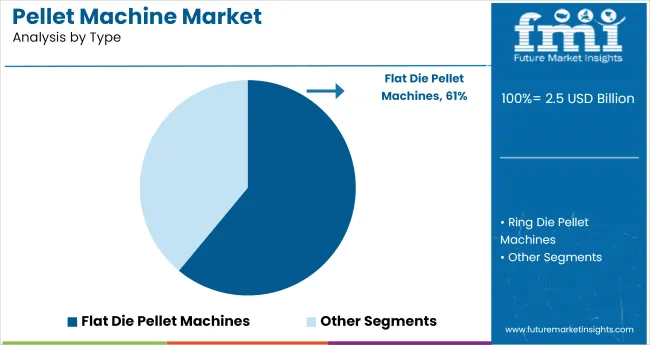
Flat Die Pellet Machines to Account for 61% Market Share in 2025

Pellet Machine Market Analysis By Type

Flat die pellet machines are set to lead the market with a 61% share in 2025, primarily due to their suitability for small-to-mid production volumes and material flexibility. These machines operate on a vertical feed mechanism, with throughput capacities ranging between 100 kg/h and 2,000 kg/h.

Their compact design makes them ideal for rural agricultural setups and decentralized biomass processing. Maintenance is minimal, and die replacement cycles exceed 500 operating hours under optimized pressure conditions.
  • Buschhoff offers mobile flat die systems with integrated shredding and batching features designed for 500-1,200 kg/h pelletizing capacities.
  • La Meccanica produces flat die pellet mills with 30-75 kW motors, suited for feedstock variability including straw, husk, and wood powder.
  • ABC Machinery supplies plug-and-play pelletizing lines with adjustable feed rates and digital temperature monitoring, used widely across Asia.

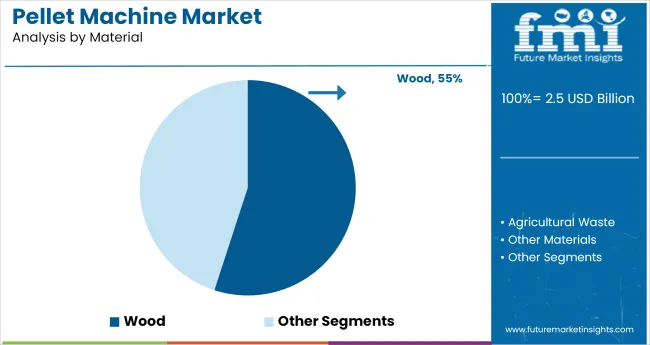
Wood to Capture 55% of Material Market Share in 2025

Pellet Machine Market Analysis By Material

Wood will continue to dominate raw material input, holding 55% of the pelletizing material market in 2025. Its consistent combustion properties (16-18 MJ/kg energy content), abundant supply chain, and suitability for long-term storage make it the primary feedstock for pellet manufacturers.

Wood residues such as sawdust, shavings, and bark are widely sourced from furniture and lumber mills. The pelletizing process for wood is mature, with standard moisture conditioning protocols maintaining 8-12% moisture content before compaction.
  • Andritz AG develops wood pelletizing lines with throughput up to 10 T/h and automated pellet cooling and sifting systems.
  • CPM Pellet Mill integrates variable frequency drives (VFDs) for torque control, ensuring consistent compression of hardwood residues.
  • Vecoplan specializes in preprocessing systems for wood chips, offering hammer mills with 6-8 mm output sizing to feed directly into flat or ring die systems.

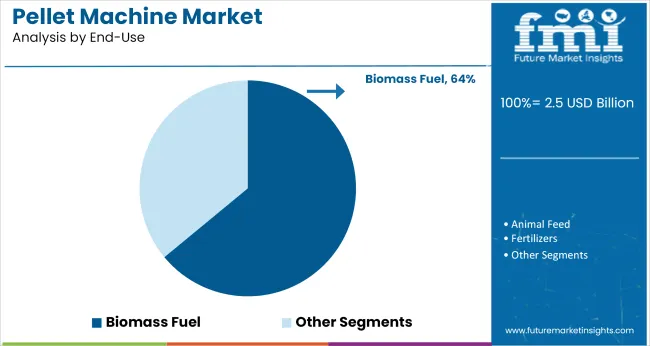
Biomass Fuel to Hold 64% of End-Use Market Share in 2025

Pellet Machine Market Analysis By End Use

Biomass fuel accounts for 64% of end-use applications for pellet machines in 2025, supported by increased renewable energy mandates across the EU, Asia-Pacific, and North America. Pellets derived from wood, husk, or agricultural waste are increasingly used in boilers, power plants, and domestic heating units.

The shift away from coal and fossil-based energy sources accelerates demand for dense, low-ash biomass pellets. Bulk users demand consistent calorific output (>16 MJ/kg), bulk density (650-700 kg/m³), and moisture content below 10% for optimal combustion. Regulatory standards like ENplus and ISO 17225 are driving quality uniformity, leading vendors to integrate sieving and de-dusting units in production lines.

  • Enviva operates vertically integrated supply chains, managing feedstock procurement, pelletizing, and logistics across North America.
  • Green Circle Bio Energy runs large-scale biomass fuel production with annual capacities exceeding 600,000 metric tons, supplying utility-scale clients.
  • Lignetics leverages regionally sourced feedstock to produce heating-grade pellets optimized for high-BTU output and minimal clinker formation.

Top Pellet Machine Market Dynamics

The industry is driven by demand across sectors like animal feed, biomass energy, and plastics. Technological advancements and Environmental responsibility efforts support growth, while high costs and supply chain issues limit expansion.

Segment-Specific Uptake Strengthens Use-Case Diversification

Pellet machines are gaining traction across feed, biomass, and plastics processing due to their throughput efficiency and standardized output. Animal feed producers are transitioning toward pelletized formulations to improve storage density and reduce feeding waste, especially in poultry and aquaculture.

In bioenergy, thermal processors in Germany and Canada are scaling pellet production to meet domestic fuel demand, with equipment rated above 2 tons/hour now accounting for 48% of new installations as of Q1 2025.

Polymer manufacturers are deploying underwater pelletizers to handle high-viscosity resins, with North Asian plants reporting 17% higher consistency in pellet size across automotive-grade materials. Equipment suppliers have integrated PLC-based controls and direct-drive motors to reduce downtime and energy input per ton.

Capital Load and Supply Chain Volatility Restrict Deployment Velocity

High procurement and installation costs continue to restrict market entry for SMEs, particularly in Sub-Saharan Africa and Southeast Asia. Turnkey pellet production lines for biomass or polymers are priced between USD 160,000 and 400,000, including feed systems, die heads, and cooling units. Financing barriers have slowed adoption outside of established industrial clusters.

On the logistics side, delays in die plate and gearbox imports disrupted commissioning timelines in key ports like Mombasa and Santos during early 2025. Freight container rates for large-format machinery rose 14% YoY by May 2025, while specialty alloy shortages impacted spare part availability. Extended lead times and maintenance intervals are affecting operating uptime and pushing buyers to delay secondary expansion phases.
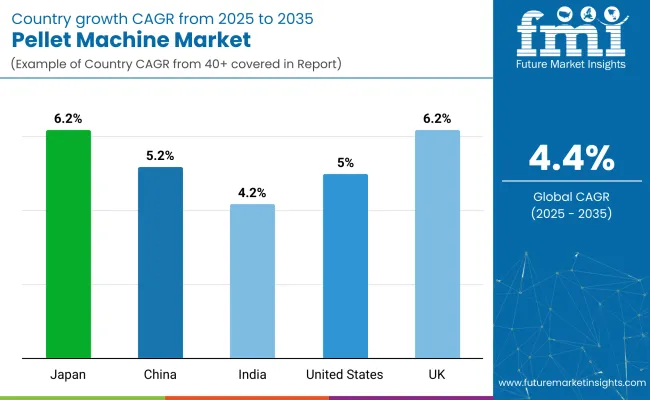
Top Countries Manufacturing, Supplying, and Scaling Pellet Machine Deployment

Pellet Machine Market Cagr Analysis By Country

Countries Estimated CAGR (%)
Japan 6.2%
United Kingdom 6.2%
United States 5.0%
China 5.2%
India 4.2%

Global demand for pellet machines is projected to grow at a 4.4% CAGR from 2025 to 2035. Japan and the United Kingdom (OECD) dominate with identical 6.2% growth rates, outperforming the global average by +41%. China (BRICS) follows at 5.2%, exceeding the baseline by +18%, while the United States (OECD) posts 5.0% (+14%).

India (BRICS) remains below trend at 4.2%, reflecting a minor lag of -5%. Growth variations align with localized drivers such as feedstock diversification in Japan, rising industrial heating applications in the UK, and biomass utilization shifts in China and the USA, India’s sub-baseline CAGR is tied to slower equipment modernization and feedstock uniformity issues, which affect throughput optimization. These trends show more consistent market acceleration in OECD economies, while BRICS members reflect divergent investment intensities and operational upgrade trajectories.

The report covers detailed analysis of 40+ countries, with the top five countries shared as a reference.

An overview of United States Pellet Machine Market Growth

The pellet machine market in the United States is projected to advance at CAGR of 5.0% through 2035, driven by rising demand across feed, fuel, and packaging sectors. Industries engaged in biomass conversion and circular economy models are adopting high-capacity machines with enhanced control systems. Major OEMs are emphasizing features such as variable speed feeding, high compaction rates, and continuous operation for industrial-scale applications.

  • Investments in pelletizers with automated moisture control systems rose by 21% in biomass processing
  • Packaging converters reported 17% more installations of compact pellet units tailored for recycling streams
  • High-volume livestock producers adopted premium-grade feed pelletizers, leading to 26% higher throughput metrics in 2024

In-depth analysis of Pellet Machine Adoption in the United Kingdom

The pellet machine industry in UK is forecast to expand at a CAGR of 6.2% through 2035, supported by transitions in energy use and environmental manufacturing protocols. Pelletizers that meet green manufacturing benchmarks, such as lower CO₂ output and minimal thermal loss are being prioritized. Strong end-use growth is seen in recycled content production, greenfiber packaging, and clean-label feed operations.

  • Energy-efficient pelletizers with <15% thermal loss rose 33% in deployment across secondary packaging lines
  • Demand for intelligent pellet-forming systems with remote diagnostics increased by 29% in bio-based polymer production
  • Equipment configured for wood pellets and energy-grade biomass witnessed a 24% jump among UK exporters

China Pellet Machine Market Trends and Growth

The pellet machine market in China is anticipated to register consistent growth of 5.2% CAGR through 2035, underpinned by strong investments in biomass fuel processing and industrial reuse cycles. Domestic manufacturers are producing mid- to large-scale machines equipped with adaptive load balancing and wear-resistant components. These systems are gaining momentum in sectors like feed milling, fertilizer compounding, and engineered wood manufacturing.

  • GEMCO and Yulong expanded production capacities by 37%, focused on feed-to-fuel transitions in tier-2 provinces
  • Machines with adaptive die-speed controls saw 32% adoption among wood and agri-waste pellet facilities
  • Installations in synthetic fertilizer processing plants rose 19% due to demand for granule uniformity and material compatibility

India Pellet Machine Market Growth and Opportunities

The industry in India is expected to experience a CAGR of 4.2% over the next decade, fueled by increased deployment in agricultural residue management and off-grid biofuel generation. The shift toward automation among mid-size processors is evident through increased integration of PLC-based fillers and pellet presses. Local producers are also tailoring systems for single-ingredient throughput and modular retrofitting.

  • Pelletizing machines used in bio-composting applications rose 31% in western and southern Indian states
  • OEM sales of modular, portable pellet machines climbed 27%, aiding farm-level feed conversion
  • Waste-to-energy initiatives led to a 22% surge in adoption of dual-use pelletizers compatible with agri-waste and husk

Japan Pellet Machine Market Outlook and Opportunities

Japan is likely to witness its pellet machine industry expand at a CAGR of 6.2% through 2035, led by advanced automation, compact design configurations, and increasing industrial robotics integration. High-performance units designed for low-noise operation and real-time monitoring are being prioritized across bioenergy, personal care, and eco-friendly materials production sectors.

  • Eco-packaging producers adopted 36% more pellet machines capable of micron-level granule precision
  • Automation-led installations in energy recycling units grew by 28%, integrating IoT-based operational oversight
  • Equipment designed for reduced particulate emission saw a 30% rise among firms aligned with Japan’s energy efficiency roadmap

Leading Pellet Machine Manufacturers, Suppliers, Distributors

Leading Player - CPM - California Pellet Mill holding 17% Industry share.
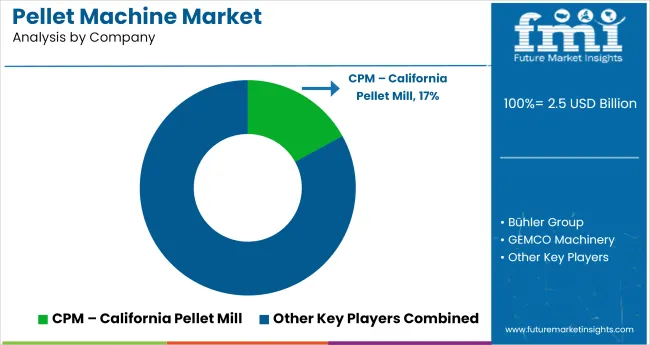
Pellet Machine Market Analysis By Company

The market is led by established players such as CPM - California Pellet Mill and Bühler Group, both of which focus on advanced pelletizing technologies. CPM, based in the USA, is renowned for its high-quality machinery and strong presence in North America. Bühler Group, headquartered in Switzerland, leverages its global reach to deliver cutting-edge solutions, backed by significant R&D investment.

The company focuses on automation and efficiency, ensuring that its pellet machines meet diverse industry demands. The companies like GEMCO Machinery and Shandong Kingoro Machinery from China offer competitive pelletizing solutions with a strong focus on cost-effectiveness and scalability.

Emerging players like Henan Richi Machinery and TCPEL Pellet Machine are growing quickly, offering tailored products with increasing focus on energy efficiency. As the market becomes more competitive, there are barriers to entry due to high initial capital investment, technological advancements, and regulatory compliance.

Recent Industry News

  • In 2025, CPM Holdings unveiled a new Direct Drive (DD) high-capacity pellet mill at the LIGNA trade fair, designed to enhance energy efficiency and performance in pelletizing operations.
  • In 2024, Enviva filed for Chapter 11 bankruptcy protection due to financial challenges and environmental concerns, triggering industry-wide discussions on the environmental wellbeing and impact of biomass energy.

Report Scope

Report Attributes Details
Current Total Market Size (2025) USD 2.5 billion
Projected Market Size (2035) USD 3.8 billion
CAGR (2025 to 2035) 4.4%
Base Year for Estimation 2024
Historical Period 2020 to 2024
Projections Period 2025 to 2035
Quantitative Units USD billion for value and million units for volume
Types Analyzed (Segment 1) Flat die pellet machines; Ring die pellet machines
Materials Analyzed (Segment 2) Wood, Agricultural waste, Other materials
End-Use Segments Covered (Segment 3) Biomass fuel, Animal feed, Fertilizers, Other uses
Regions Covered North America; Europe; Asia Pacific; Latin America; Middle East & Africa
Countries Covered United States; Canada; Mexico; Germany; United Kingdom; France; Italy; Spain; Netherlands; China; India; Japan; South Korea; Indonesia; Australia; Thailand; Malaysia; Brazil; Argentina; South Africa; Saudi Arabia; UAE; Egypt; Turkey
Key Players CPM - California Pellet Mill (USA), Bühler Group (Switzerland), GEMCO Machinery, Shandong Kingoro Machinery (China), Henan Richi Machinery (China), TCPEL Pellet Machine (China), Ecopelletmills (China), Buskirk Engineering, Kawise Machinery, and Pellet Masters.
Additional Attributes Dollar sales by machine type (flat die vs ring die); Growth of biomass fuel segment vs animal feed; Regional market demand for clean energy production and animal nutrition; Technological advancements in pellet production efficiency

Leading Players

  • CPM - California Pellet Mill (USA)
  • Bühler Group (Switzerland)
  • GEMCO Machinery
  • Shandong Kingoro Machinery (China)
  • Henan Richi Machinery (China)
  • TCPEL Pellet Machine (China)
  • Ecopelletmills (China)
  • Buskirk Engineering
  • Kawise Machinery
  • Pellet Masters

Pellet Machine Market Analyzed by Key Investment Segments

By Type:

The industry is segmented into flat die and ring die pellet machines.

By Material:

The industry covers wood, agricultural waste, and other materials.

By End-Use:

The industry includes biomass fuel, animal feed, fertilizers, and other uses.

By Region:

The industry spans North America, Europe, Asia Pacific, Latin America, and the Middle East & Africa.

Table of Content

  1. Executive Summary
    • Global Market Outlook
    • Demand-side Trends
    • Supply-side Trends
    • Technology Roadmap Analysis
    • Analysis and Recommendations
  2. Market Overview
    • Market Coverage / Taxonomy
    • Market Definition / Scope / Limitations
  3. Market Background
    • Market Dynamics
      • Drivers
      • Restraints
      • Opportunity
      • Trends
    • Scenario Forecast
      • Demand in Optimistic Scenario
      • Demand in Likely Scenario
      • Demand in Conservative Scenario
    • Opportunity Map Analysis
    • Product Life Cycle Analysis
    • Supply Chain Analysis
      • Supply Side Participants and their Roles
        • Producers
        • Mid-Level Participants (Traders/ Agents/ Brokers)
        • Wholesalers and Distributors
      • Value Added and Value Created at Node in the Supply Chain
      • List of Raw Material Suppliers
      • List of Existing and Potential Buyer’s
    • Investment Feasibility Matrix
    • Value Chain Analysis
      • Profit Margin Analysis
      • Wholesalers and Distributors
      • Retailers
    • PESTLE and Porter’s Analysis
    • Regulatory Landscape
      • By Key Regions
      • By Key Countries
    • Regional Parent Market Outlook
    • Production and Consumption Statistics
    • Import and Export Statistics
  4. Global Market Analysis 2020 to 2024 and Forecast, 2025 to 2035
    • Historical Market Size Value (USD Billion) & Volume (million units) Analysis, 2020 to 2024
    • Current and Future Market Size Value (USD Billion) & Volume (million units) Projections, 2025 to 2035
      • Y-o-Y Growth Trend Analysis
      • Absolute $ Opportunity Analysis
  5. Global Market Pricing Analysis 2020 to 2024 and Forecast 2025 to 2035
  6. Global Market Analysis 2020 to 2024 and Forecast 2025 to 2035, By Type
    • Introduction / Key Findings
    • Historical Market Size Value (USD Billion) & Volume (million units) Analysis By Type, 2020 to 2024
    • Current and Future Market Size Value (USD Billion) & Volume (million units) Analysis and Forecast By Type, 2025 to 2035
      • Flat Die Pellet Machines
      • Ring Die Pellet Machines
    • Y-o-Y Growth Trend Analysis By Type, 2020 to 2024
    • Absolute $ Opportunity Analysis By Type, 2025 to 2035
  7. Global Market Analysis 2020 to 2024 and Forecast 2025 to 2035, By Material
    • Introduction / Key Findings
    • Historical Market Size Value (USD Billion) & Volume (million units) Analysis By Material, 2020 to 2024
    • Current and Future Market Size Value (USD Billion) & Volume (million units) Analysis and Forecast By Material, 2025 to 2035
      • Wood
      • Agricultural Waste
      • Other Materials
    • Y-o-Y Growth Trend Analysis By Material, 2020 to 2024
    • Absolute $ Opportunity Analysis By Material, 2025 to 2035
  8. Global Market Analysis 2020 to 2024 and Forecast 2025 to 2035, By End Use
    • Introduction / Key Findings
    • Historical Market Size Value (USD Billion) & Volume (million units) Analysis By End Use, 2020 to 2024
    • Current and Future Market Size Value (USD Billion) & Volume (million units) Analysis and Forecast By End Use, 2025 to 2035
      • Biomass Fuel
      • Animal Feed
      • Fertilizers
      • Other Uses
    • Y-o-Y Growth Trend Analysis By End Use, 2020 to 2024
    • Absolute $ Opportunity Analysis By End Use, 2025 to 2035
  9. Global Market Analysis 2020 to 2024 and Forecast 2025 to 2035, By Region
    • Introduction
    • Historical Market Size Value (USD Billion) & Volume (million units) Analysis By Region, 2020 to 2024
    • Current Market Size Value (USD Billion) & Volume (million units) Analysis and Forecast By Region, 2025 to 2035
      • North America
      • Latin America
      • Europe
      • East Asia
      • South Asia
      • Oceania
      • MEA
    • Market Attractiveness Analysis By Region
  10. North America Market Analysis 2020 to 2024 and Forecast 2025 to 2035, By Country
    • Historical Market Size Value (USD Billion) & Volume (million units) Trend Analysis By Market Taxonomy, 2020 to 2024
    • Market Size Value (USD Billion) & Volume (million units) Forecast By Market Taxonomy, 2025 to 2035
      • By Country
        • USA
        • Canada
      • By Type
      • By Material
      • By End Use
    • Market Attractiveness Analysis
      • By Country
      • By Type
      • By Material
      • By End Use
    • Key Takeaways
  11. Latin America Market Analysis 2020 to 2024 and Forecast 2025 to 2035, By Country
    • Historical Market Size Value (USD Billion) & Volume (million units) Trend Analysis By Market Taxonomy, 2020 to 2024
    • Market Size Value (USD Billion) & Volume (million units) Forecast By Market Taxonomy, 2025 to 2035
      • By Country
        • Brazil
        • Mexico
        • Argentina
        • Chile
        • Peru
        • Rest of Latin America
      • By Type
      • By Material
      • By End Use
    • Market Attractiveness Analysis
      • By Country
      • By Type
      • By Material
      • By End Use
    • Key Takeaways
  12. Europe Market Analysis 2020 to 2024 and Forecast 2025 to 2035, By Country
    • Historical Market Size Value (USD Billion) & Volume (million units) Trend Analysis By Market Taxonomy, 2020 to 2024
    • Market Size Value (USD Billion) & Volume (million units) Forecast By Market Taxonomy, 2025 to 2035
      • By Country
        • Germany
        • Italy
        • France
        • UK
        • Spain
        • Russia
        • BENELUX
        • Rest of Europe
      • By Type
      • By Material
      • By End Use
    • Market Attractiveness Analysis
      • By Country
      • By Type
      • By Material
      • By End Use
    • Key Takeaways
  13. East Asia Market Analysis 2020 to 2024 and Forecast 2025 to 2035, By Country
    • Historical Market Size Value (USD Billion) & Volume (million units) Trend Analysis By Market Taxonomy, 2020 to 2024
    • Market Size Value (USD Billion) & Volume (million units) Forecast By Market Taxonomy, 2025 to 2035
      • By Country
        • China
        • Japan
        • South Korea
      • By Type
      • By Material
      • By End Use
    • Market Attractiveness Analysis
      • By Country
      • By Type
      • By Material
      • By End Use
    • Key Takeaways
  14. South Asia Market Analysis 2020 to 2024 and Forecast 2025 to 2035, By Country
    • Historical Market Size Value (USD Billion) & Volume (million units) Trend Analysis By Market Taxonomy, 2020 to 2024
    • Market Size Value (USD Billion) & Volume (million units) Forecast By Market Taxonomy, 2025 to 2035
      • By Country
        • India
        • Thailand
        • Malaysia
        • Indonesia
        • Rest of South Asia
      • By Type
      • By Material
      • By End Use
    • Market Attractiveness Analysis
      • By Country
      • By Type
      • By Material
      • By End Use
    • Key Takeaways
  15. Oceania Market Analysis 2020 to 2024 and Forecast 2025 to 2035, By Country
    • Historical Market Size Value (USD Billion) & Volume (million units) Trend Analysis By Market Taxonomy, 2020 to 2024
    • Market Size Value (USD Billion) & Volume (million units) Forecast By Market Taxonomy, 2025 to 2035
      • By Country
        • Australia
        • New Zealand
      • By Type
      • By Material
      • By End Use
    • Market Attractiveness Analysis
      • By Country
      • By Type
      • By Material
      • By End Use
    • Key Takeaways
  16. MEA Market Analysis 2020 to 2024 and Forecast 2025 to 2035, By Country
    • Historical Market Size Value (USD Billion) & Volume (million units) Trend Analysis By Market Taxonomy, 2020 to 2024
    • Market Size Value (USD Billion) & Volume (million units) Forecast By Market Taxonomy, 2025 to 2035
      • By Country
        • GCC
        • Rest of MEA
      • By Type
      • By Material
      • By End Use
    • Market Attractiveness Analysis
      • By Country
      • By Type
      • By Material
      • By End Use
    • Key Takeaways
  17. Key Countries Market Analysis
    • USA
      • Pricing Analysis
      • Market Share Analysis, 2024
        • By Type
        • By Material
        • By End Use
    • Canada
      • Pricing Analysis
      • Market Share Analysis, 2024
        • By Type
        • By Material
        • By End Use
    • Brazil
      • Pricing Analysis
      • Market Share Analysis, 2024
        • By Type
        • By Material
        • By End Use
    • Mexico
      • Pricing Analysis
      • Market Share Analysis, 2024
        • By Type
        • By Material
        • By End Use
    • Argentina
      • Pricing Analysis
      • Market Share Analysis, 2024
        • By Type
        • By Material
        • By End Use
  18. Market Structure Analysis
    • Competition Dashboard
    • Competition Benchmarking
    • Market Share Analysis of Top Players
      • By Regional
      • By Type
      • By Material
      • By End Use
  19. Competition Analysis
    • Competition Deep Dive
      • Andritz Group
        • Overview
        • Product Portfolio
        • Profitability by Market Segments (Product/Age /Sales Channel/Region)
        • Sales Footprint
        • Strategy Overview
          • Marketing Strategy
          • Product Strategy
          • Channel Strategy
      • CPM Holdings
        • Overview
        • Product Portfolio
        • Profitability by Market Segments (Product/Age /Sales Channel/Region)
        • Sales Footprint
        • Strategy Overview
          • Marketing Strategy
          • Product Strategy
          • Channel Strategy
      • Bühler Group
        • Overview
        • Product Portfolio
        • Profitability by Market Segments (Product/Age /Sales Channel/Region)
        • Sales Footprint
        • Strategy Overview
          • Marketing Strategy
          • Product Strategy
          • Channel Strategy
      • Maag
        • Overview
        • Product Portfolio
        • Profitability by Market Segments (Product/Age /Sales Channel/Region)
        • Sales Footprint
        • Strategy Overview
          • Marketing Strategy
          • Product Strategy
          • Channel Strategy
      • Baracco
        • Overview
        • Product Portfolio
        • Profitability by Market Segments (Product/Age /Sales Channel/Region)
        • Sales Footprint
        • Strategy Overview
          • Marketing Strategy
          • Product Strategy
          • Channel Strategy
      • Coperion
        • Overview
        • Product Portfolio
        • Profitability by Market Segments (Product/Age /Sales Channel/Region)
        • Sales Footprint
        • Strategy Overview
          • Marketing Strategy
          • Product Strategy
          • Channel Strategy
      • Diamond America
        • Overview
        • Product Portfolio
        • Profitability by Market Segments (Product/Age /Sales Channel/Region)
        • Sales Footprint
        • Strategy Overview
          • Marketing Strategy
          • Product Strategy
          • Channel Strategy
      • Farrel Pomini
        • Overview
        • Product Portfolio
        • Profitability by Market Segments (Product/Age /Sales Channel/Region)
        • Sales Footprint
        • Strategy Overview
          • Marketing Strategy
          • Product Strategy
          • Channel Strategy
      • Henan Richi Machinery
        • Overview
        • Product Portfolio
        • Profitability by Market Segments (Product/Age /Sales Channel/Region)
        • Sales Footprint
        • Strategy Overview
          • Marketing Strategy
          • Product Strategy
          • Channel Strategy
      • Fusmar Machinery
        • Overview
        • Product Portfolio
        • Profitability by Market Segments (Product/Age /Sales Channel/Region)
        • Sales Footprint
        • Strategy Overview
          • Marketing Strategy
          • Product Strategy
          • Channel Strategy
      • Namdhari Industrial Works
        • Overview
        • Product Portfolio
        • Profitability by Market Segments (Product/Age /Sales Channel/Region)
        • Sales Footprint
        • Strategy Overview
          • Marketing Strategy
          • Product Strategy
          • Channel Strategy
  20. Assumptions & Acronyms Used
  21. Research Methodology

List of Tables

  • Table 1: Global Market Value (USD Billion) Forecast by Region, 2020 to 2035
  • Table 2: Global Market Volume (million units) Forecast by Region, 2020 to 2035
  • Table 3: Global Market Value (USD Billion) Forecast by Type, 2020 to 2035
  • Table 4: Global Market Volume (million units) Forecast by Type, 2020 to 2035
  • Table 5: Global Market Value (USD Billion) Forecast by Material, 2020 to 2035
  • Table 6: Global Market Volume (million units) Forecast by Material, 2020 to 2035
  • Table 7: Global Market Value (USD Billion) Forecast by End Use, 2020 to 2035
  • Table 8: Global Market Volume (million units) Forecast by End Use, 2020 to 2035
  • Table 9: North America Market Value (USD Billion) Forecast by Country, 2020 to 2035
  • Table 10: North America Market Volume (million units) Forecast by Country, 2020 to 2035
  • Table 11: North America Market Value (USD Billion) Forecast by Type, 2020 to 2035
  • Table 12: North America Market Volume (million units) Forecast by Type, 2020 to 2035
  • Table 13: North America Market Value (USD Billion) Forecast by Material, 2020 to 2035
  • Table 14: North America Market Volume (million units) Forecast by Material, 2020 to 2035
  • Table 15: North America Market Value (USD Billion) Forecast by End Use, 2020 to 2035
  • Table 16: North America Market Volume (million units) Forecast by End Use, 2020 to 2035
  • Table 17: Latin America Market Value (USD Billion) Forecast by Country, 2020 to 2035
  • Table 18: Latin America Market Volume (million units) Forecast by Country, 2020 to 2035
  • Table 19: Latin America Market Value (USD Billion) Forecast by Type, 2020 to 2035
  • Table 20: Latin America Market Volume (million units) Forecast by Type, 2020 to 2035
  • Table 21: Latin America Market Value (USD Billion) Forecast by Material, 2020 to 2035
  • Table 22: Latin America Market Volume (million units) Forecast by Material, 2020 to 2035
  • Table 23: Latin America Market Value (USD Billion) Forecast by End Use, 2020 to 2035
  • Table 24: Latin America Market Volume (million units) Forecast by End Use, 2020 to 2035
  • Table 25: Europe Market Value (USD Billion) Forecast by Country, 2020 to 2035
  • Table 26: Europe Market Volume (million units) Forecast by Country, 2020 to 2035
  • Table 27: Europe Market Value (USD Billion) Forecast by Type, 2020 to 2035
  • Table 28: Europe Market Volume (million units) Forecast by Type, 2020 to 2035
  • Table 29: Europe Market Value (USD Billion) Forecast by Material, 2020 to 2035
  • Table 30: Europe Market Volume (million units) Forecast by Material, 2020 to 2035
  • Table 31: Europe Market Value (USD Billion) Forecast by End Use, 2020 to 2035
  • Table 32: Europe Market Volume (million units) Forecast by End Use, 2020 to 2035
  • Table 33: East Asia Market Value (USD Billion) Forecast by Country, 2020 to 2035
  • Table 34: East Asia Market Volume (million units) Forecast by Country, 2020 to 2035
  • Table 35: East Asia Market Value (USD Billion) Forecast by Type, 2020 to 2035
  • Table 36: East Asia Market Volume (million units) Forecast by Type, 2020 to 2035
  • Table 37: East Asia Market Value (USD Billion) Forecast by Material, 2020 to 2035
  • Table 38: East Asia Market Volume (million units) Forecast by Material, 2020 to 2035
  • Table 39: East Asia Market Value (USD Billion) Forecast by End Use, 2020 to 2035
  • Table 40: East Asia Market Volume (million units) Forecast by End Use, 2020 to 2035
  • Table 41: South Asia Market Value (USD Billion) Forecast by Country, 2020 to 2035
  • Table 42: South Asia Market Volume (million units) Forecast by Country, 2020 to 2035
  • Table 43: South Asia Market Value (USD Billion) Forecast by Type, 2020 to 2035
  • Table 44: South Asia Market Volume (million units) Forecast by Type, 2020 to 2035
  • Table 45: South Asia Market Value (USD Billion) Forecast by Material, 2020 to 2035
  • Table 46: South Asia Market Volume (million units) Forecast by Material, 2020 to 2035
  • Table 47: South Asia Market Value (USD Billion) Forecast by End Use, 2020 to 2035
  • Table 48: South Asia Market Volume (million units) Forecast by End Use, 2020 to 2035
  • Table 49: Oceania Market Value (USD Billion) Forecast by Country, 2020 to 2035
  • Table 50: Oceania Market Volume (million units) Forecast by Country, 2020 to 2035
  • Table 51: Oceania Market Value (USD Billion) Forecast by Type, 2020 to 2035
  • Table 52: Oceania Market Volume (million units) Forecast by Type, 2020 to 2035
  • Table 53: Oceania Market Value (USD Billion) Forecast by Material, 2020 to 2035
  • Table 54: Oceania Market Volume (million units) Forecast by Material, 2020 to 2035
  • Table 55: Oceania Market Value (USD Billion) Forecast by End Use, 2020 to 2035
  • Table 56: Oceania Market Volume (million units) Forecast by End Use, 2020 to 2035
  • Table 57: MEA Market Value (USD Billion) Forecast by Country, 2020 to 2035
  • Table 58: MEA Market Volume (million units) Forecast by Country, 2020 to 2035
  • Table 59: MEA Market Value (USD Billion) Forecast by Type, 2020 to 2035
  • Table 60: MEA Market Volume (million units) Forecast by Type, 2020 to 2035
  • Table 61: MEA Market Value (USD Billion) Forecast by Material, 2020 to 2035
  • Table 62: MEA Market Volume (million units) Forecast by Material, 2020 to 2035
  • Table 63: MEA Market Value (USD Billion) Forecast by End Use, 2020 to 2035
  • Table 64: MEA Market Volume (million units) Forecast by End Use, 2020 to 2035

List of Figures

  • Figure 1: Global Market Volume (million units) Forecast 2020 to 2035
  • Figure 2: Global Market Pricing Analysis
  • Figure 3: Global Market Value (USD Billion) Forecast 2020 to 2035
  • Figure 4: Global Market Value Share and BPS Analysis by Type, 2025 and 2035
  • Figure 5: Global Market Y-o-Y Growth Comparison by Type, 2025 to 2035
  • Figure 6: Global Market Attractiveness Analysis by Type
  • Figure 7: Global Market Value Share and BPS Analysis by Material, 2025 and 2035
  • Figure 8: Global Market Y-o-Y Growth Comparison by Material, 2025 to 2035
  • Figure 9: Global Market Attractiveness Analysis by Material
  • Figure 10: Global Market Value Share and BPS Analysis by End Use, 2025 and 2035
  • Figure 11: Global Market Y-o-Y Growth Comparison by End Use, 2025 to 2035
  • Figure 12: Global Market Attractiveness Analysis by End Use
  • Figure 13: Global Market Value (USD Billion) Share and BPS Analysis by Region, 2025 and 2035
  • Figure 14: Global Market Y-o-Y Growth Comparison by Region, 2025 to 2035
  • Figure 15: Global Market Attractiveness Analysis by Region
  • Figure 16: North America Market Incremental $ Opportunity, 2025 to 2035
  • Figure 17: Latin America Market Incremental $ Opportunity, 2025 to 2035
  • Figure 18: Europe Market Incremental $ Opportunity, 2025 to 2035
  • Figure 19: East Asia Market Incremental $ Opportunity, 2025 to 2035
  • Figure 20: South Asia Market Incremental $ Opportunity, 2025 to 2035
  • Figure 21: Oceania Market Incremental $ Opportunity, 2025 to 2035
  • Figure 22: MEA Market Incremental $ Opportunity, 2025 to 2035
  • Figure 23: North America Market Value Share and BPS Analysis by Country, 2025 and 2035
  • Figure 24: North America Market Value Share and BPS Analysis by Type, 2025 and 2035
  • Figure 25: North America Market Y-o-Y Growth Comparison by Type, 2025 to 2035
  • Figure 26: North America Market Attractiveness Analysis by Type
  • Figure 27: North America Market Value Share and BPS Analysis by Material, 2025 and 2035
  • Figure 28: North America Market Y-o-Y Growth Comparison by Material, 2025 to 2035
  • Figure 29: North America Market Attractiveness Analysis by Material
  • Figure 30: North America Market Value Share and BPS Analysis by End Use, 2025 and 2035
  • Figure 31: North America Market Y-o-Y Growth Comparison by End Use, 2025 to 2035
  • Figure 32: North America Market Attractiveness Analysis by End Use
  • Figure 33: Latin America Market Value Share and BPS Analysis by Country, 2025 and 2035
  • Figure 34: Latin America Market Value Share and BPS Analysis by Type, 2025 and 2035
  • Figure 35: Latin America Market Y-o-Y Growth Comparison by Type, 2025 to 2035
  • Figure 36: Latin America Market Attractiveness Analysis by Type
  • Figure 37: Latin America Market Value Share and BPS Analysis by Material, 2025 and 2035
  • Figure 38: Latin America Market Y-o-Y Growth Comparison by Material, 2025 to 2035
  • Figure 39: Latin America Market Attractiveness Analysis by Material
  • Figure 40: Latin America Market Value Share and BPS Analysis by End Use, 2025 and 2035
  • Figure 41: Latin America Market Y-o-Y Growth Comparison by End Use, 2025 to 2035
  • Figure 42: Latin America Market Attractiveness Analysis by End Use
  • Figure 43: Europe Market Value Share and BPS Analysis by Country, 2025 and 2035
  • Figure 44: Europe Market Value Share and BPS Analysis by Type, 2025 and 2035
  • Figure 45: Europe Market Y-o-Y Growth Comparison by Type, 2025 to 2035
  • Figure 46: Europe Market Attractiveness Analysis by Type
  • Figure 47: Europe Market Value Share and BPS Analysis by Material, 2025 and 2035
  • Figure 48: Europe Market Y-o-Y Growth Comparison by Material, 2025 to 2035
  • Figure 49: Europe Market Attractiveness Analysis by Material
  • Figure 50: Europe Market Value Share and BPS Analysis by End Use, 2025 and 2035
  • Figure 51: Europe Market Y-o-Y Growth Comparison by End Use, 2025 to 2035
  • Figure 52: Europe Market Attractiveness Analysis by End Use
  • Figure 53: East Asia Market Value Share and BPS Analysis by Country, 2025 and 2035
  • Figure 54: East Asia Market Value Share and BPS Analysis by Type, 2025 and 2035
  • Figure 55: East Asia Market Y-o-Y Growth Comparison by Type, 2025 to 2035
  • Figure 56: East Asia Market Attractiveness Analysis by Type
  • Figure 57: East Asia Market Value Share and BPS Analysis by Material, 2025 and 2035
  • Figure 58: East Asia Market Y-o-Y Growth Comparison by Material, 2025 to 2035
  • Figure 59: East Asia Market Attractiveness Analysis by Material
  • Figure 60: East Asia Market Value Share and BPS Analysis by End Use, 2025 and 2035
  • Figure 61: East Asia Market Y-o-Y Growth Comparison by End Use, 2025 to 2035
  • Figure 62: East Asia Market Attractiveness Analysis by End Use
  • Figure 63: South Asia Market Value Share and BPS Analysis by Country, 2025 and 2035
  • Figure 64: South Asia Market Value Share and BPS Analysis by Type, 2025 and 2035
  • Figure 65: South Asia Market Y-o-Y Growth Comparison by Type, 2025 to 2035
  • Figure 66: South Asia Market Attractiveness Analysis by Type
  • Figure 67: South Asia Market Value Share and BPS Analysis by Material, 2025 and 2035
  • Figure 68: South Asia Market Y-o-Y Growth Comparison by Material, 2025 to 2035
  • Figure 69: South Asia Market Attractiveness Analysis by Material
  • Figure 70: South Asia Market Value Share and BPS Analysis by End Use, 2025 and 2035
  • Figure 71: South Asia Market Y-o-Y Growth Comparison by End Use, 2025 to 2035
  • Figure 72: South Asia Market Attractiveness Analysis by End Use
  • Figure 73: Oceania Market Value Share and BPS Analysis by Country, 2025 and 2035
  • Figure 74: Oceania Market Value Share and BPS Analysis by Type, 2025 and 2035
  • Figure 75: Oceania Market Y-o-Y Growth Comparison by Type, 2025 to 2035
  • Figure 76: Oceania Market Attractiveness Analysis by Type
  • Figure 77: Oceania Market Value Share and BPS Analysis by Material, 2025 and 2035
  • Figure 78: Oceania Market Y-o-Y Growth Comparison by Material, 2025 to 2035
  • Figure 79: Oceania Market Attractiveness Analysis by Material
  • Figure 80: Oceania Market Value Share and BPS Analysis by End Use, 2025 and 2035
  • Figure 81: Oceania Market Y-o-Y Growth Comparison by End Use, 2025 to 2035
  • Figure 82: Oceania Market Attractiveness Analysis by End Use
  • Figure 83: MEA Market Value Share and BPS Analysis by Country, 2025 and 2035
  • Figure 84: MEA Market Value Share and BPS Analysis by Type, 2025 and 2035
  • Figure 85: MEA Market Y-o-Y Growth Comparison by Type, 2025 to 2035
  • Figure 86: MEA Market Attractiveness Analysis by Type
  • Figure 87: MEA Market Value Share and BPS Analysis by Material, 2025 and 2035
  • Figure 88: MEA Market Y-o-Y Growth Comparison by Material, 2025 to 2035
  • Figure 89: MEA Market Attractiveness Analysis by Material
  • Figure 90: MEA Market Value Share and BPS Analysis by End Use, 2025 and 2035
  • Figure 91: MEA Market Y-o-Y Growth Comparison by End Use, 2025 to 2035
  • Figure 92: MEA Market Attractiveness Analysis by End Use
  • Figure 93: Global Market - Tier Structure Analysis
  • Figure 94: Global Market - Company Share Analysis

Frequently Asked Questions

What is the projected size of the pellet machine industry by 2035?

The industry is expected to reach USD 3.8 billion by 2035.

What is the anticipated market size of the pellet machine market in 2025?

The market size is projected to be USD 2.5 billion in 2025.

What is the CAGR of the pellet machine industry from 2025 to 2035?

The market is expected to grow at a CAGR of 4.4%.

Who is the leading player in the pellet machine market?

Leading player is CPM - California Pellet Mill (USA) holding 17% of industry share.

Which raw material dominates the market in 2025?

Wood holds 55% of the input material share.

Explore Similar Insights

Future Market Insights

Pellet Machine Market