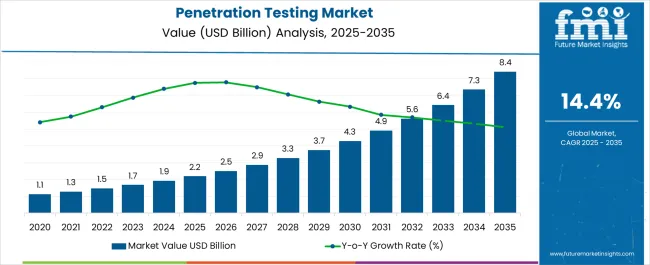
The penetration testing market is set for significant expansion, with an anticipated valuation of USD 1,913.6 million by 2024. The market displays a significant trend, featuring a CAGR of 14.4%, expected to endure until 2034. The consistent growth forecasts indicate that the global penetration testing market is poised to achieve an impressive valuation of USD 7,363.3 million by 2034.
Attributes | Key Insights |
---|---|
Market Estimated Size in 2024 | USD 1,913.6 million |
Projected Market Size in 2034 | USD 7,363.3 million |
Value-based CAGR from 2024 to 2034 | 14.4% |
The scope for global penetration testing market insights rose at a 13.3% CAGR between 2019 and 2023. The penetration testing market is anticipated to develop at a moderate CAGR of 14.4% over the forecast period from 2024 to 2034.
Attributes | Details |
---|---|
Market Value in 2019 | USD 1,018.1 million |
Market Value in 2023 | USD 1,676.6 million |
CAGR from 2019 to 2023 | 13.3% |
Between 2019 and 2023, the global penetration testing market experienced significant growth, with a Compound Annual Growth Rate (CAGR) of 13.3%. During this period, the market value increased from USD 1,018.1 million in 2019 to USD 1,676.6 million in 2023. The robust growth was driven by a heightened awareness of cybersecurity threats and the importance of identifying and addressing vulnerabilities proactively.
Looking ahead to the forecast period from 2024 to 2034, the penetration testing market is expected to expand at a moderate CAGR of 14.4%. The projection underscores the ongoing significance of cybersecurity and the sustained demand for penetration testing services. Companies are increasingly recognizing the need to safeguard their digital assets and protect sensitive data, contributing to the steady growth of this market.
The below table showcases CAGRs in terms of the five countries spearheaded by the United States, China, the United Kingdom, Germany, and Japan.
The United States | 6.5% |
---|---|
The United Kingdom | 4.5% |
Germany | 4.7% |
Japan | 14.3% |
China | 18.7% |
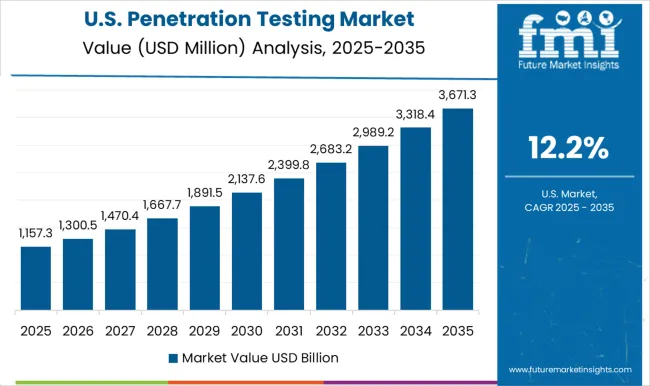
The United States expanded at a CAGR of 6.5% by 2034 in the penetration testing market. The country robust cybersecurity industry, a multitude of businesses that prioritize data protection, and stringent compliance requirements contributed to its market leadership.
As cyber threats evolved, American companies invested significantly in penetration testing to proactively identify vulnerabilities. The trend is expected to persist, with the United States playing a pivotal role in shaping the global penetration testing landscape.
China exhibited significant growth and registered a CAGR of 18.7% by 2034, making it a major player in the global penetration testing market. The country rapid digital transformation and the proliferation of online activities increased the demand for cybersecurity services, including penetration testing.
China organizations recognized the importance of safeguarding their digital assets and sensitive data, resulting in substantial market growth. As China continues to expand its digital footprint, its share of the penetration testing market is anticipated to remain substantial, reflecting the country evolving cybersecurity landscape.
The United Kingdom accounted for a CAGR of 4.5% by 2034, underscoring its commitment to cybersecurity and data protection. British businesses and government agencies prioritized penetration testing as a proactive measure to secure their digital environments.
With increasing cyber threats and compliance regulations, the demand for penetration testing services in the United Kingdom is expected to grow. This indicates the country dedication to maintaining a strong security posture and adapting to emerging cybersecurity challenges.
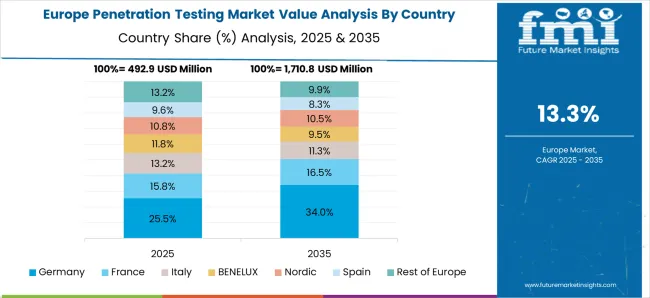
Germany expanded at a CAGR of 4.7% by 2034, reflecting the country focus on cybersecurity and data privacy. German organizations, known for their robust industrial sector, recognized the significance of identifying and mitigating vulnerabilities.
Regulatory requirements and a proactive approach to cybersecurity drove the adoption of penetration testing. As Germany cybersecurity landscape evolves, the market share for penetration testing is expected to remain substantial, reflecting the country commitment to data protection.
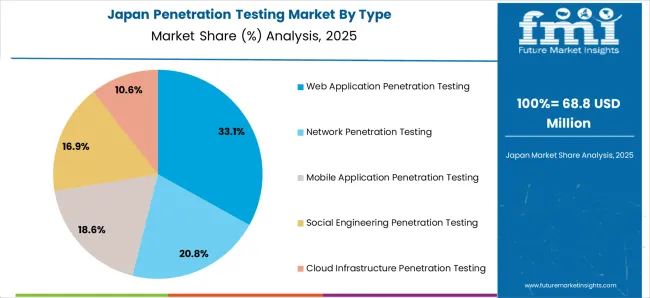
The country advanced technological landscape and extensive digitization initiatives contributed to the strong demand for penetration testing services with a CAGR of 14.3% by 2034. Japan organizations emphasized security measures to protect sensitive information and critical infrastructure.
Given Japan ongoing technological advancements and the evolving threat landscape, the penetration testing market is expected to maintain a significant presence in the country, solidifying its role as a cybersecurity leader.
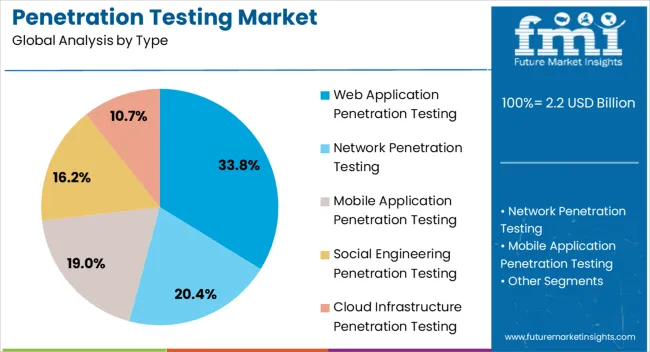
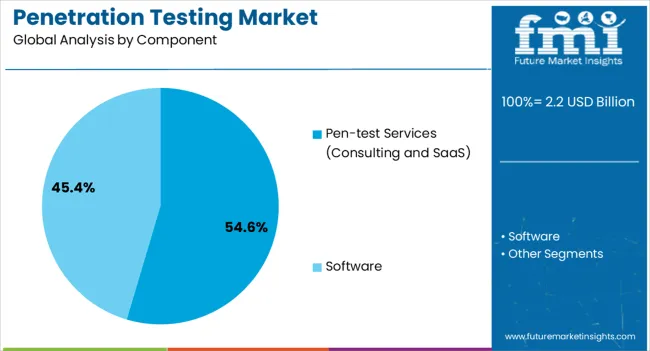
The table below highlights how network penetration testing is projected to lead the type market, expanding at a market share of 34.3% in 2024. The table further details how software is anticipated to witness a market share of 65.1% in 2024.
Category | Market Share in 2024 |
---|---|
Network Penetration Testing | 34.3% |
Software | 65.1% |
In the realm of penetration testing, network penetration testing is set to take the lead by capturing a significant market share of 34.3% in 2024. The category focuses on evaluating the security of network infrastructure, identifying vulnerabilities, and assessing the resilience of an organization network against potential cyber threats.
As networks continue to be the lifeblood of digital operations, ensuring their security remains paramount. The growing complexity of network environments, coupled with the ever-evolving cyber threat landscape, drives the demand for network penetration testing services. The market dominance underscores the critical role network security plays in safeguarding digital assets and data.
The software category is poised to grow substantially, commanding a significant market share of 65.1% in 2024. The market underscores the increasing emphasis on securing software applications and systems in an era of digital transformation. As software plays a central role in virtually every aspect of modern business operations, vulnerabilities within software can be a gateway for cyberattacks.
Penetration testing within the software domain is instrumental in identifying and addressing these vulnerabilities, ensuring that applications and systems are resilient to cyber threats. The surge in software-based solutions, including mobile apps and web platforms, intensifies the demand for software penetration testing to maintain data integrity and protect digital assets.
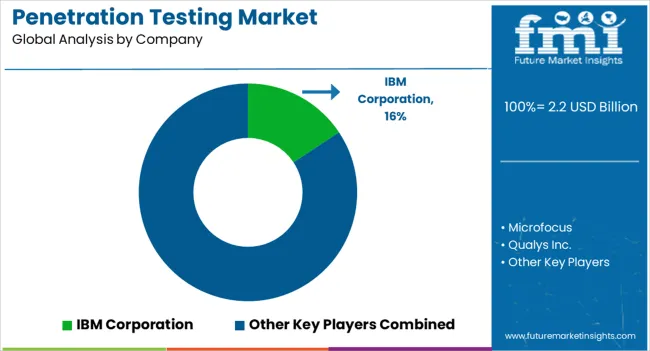
Many key penetration testing manufacturers are inclined to invest significantly in innovation, research, and development practices to uncover increased penetration testing applications. With technology, players also focus on ensuring safety, quality, and customer satisfaction to captivate an increased customer base. Some of the latest developments include
Attributes | Details |
---|---|
Estimated Market Size in 2024 | USD 1,913.6 million |
Projected Market Valuation in 2034 | USD 7,363.3 million |
CAGR Share from 2024 to 2034 | 14.4% |
Forecast Period | 2024 to 2034 |
Historical Data Available for | 2019 to 2023 |
Market Analysis | Value in USD million |
Key Regions Covered | North America; Latin America; Western Europe; Eastern Europe; South Asia and Pacific; East Asia; The Middle East & Africa |
Key Market Segments Covered | Type, Component, Enterprise Size, Vertical, Region |
Key Countries Profiled | The United States, Canada, Brazil, Mexico, Germany, The United Kingdom, France, Spain, Italy, Russia, Poland, Czech Republic, Romania, India, Bangladesh, Australia, New Zealand, China, Japan, South Korea, GCC countries, South Africa, Israel |
Key Companies Profiled | IBM Corporation; Microfocus; Qualys Inc.; Synopsys Inc.; Core Security SDI Corporation; Whitehat Security; Trustwave Holdings Inc.; Checkmarx.com LTD; VERACODE Inc.; Secure Works Inc.; Acunetix |
Table 1: Global Market Value (US$ Million) Forecast by Region, 2019 to 2034
Table 2: Global Market Value (US$ Million) Forecast by Type, 2019 to 2034
Table 3: Global Market Value (US$ Million) Forecast by Component, 2019 to 2034
Table 4: Global Market Value (US$ Million) Forecast by Enterprise Size , 2019 to 2034
Table 5: Global Market Value (US$ Million) Forecast by Vertical, 2019 to 2034
Table 6: North America Market Value (US$ Million) Forecast by Country, 2019 to 2034
Table 7: North America Market Value (US$ Million) Forecast by Type, 2019 to 2034
Table 8: North America Market Value (US$ Million) Forecast by Component, 2019 to 2034
Table 9: North America Market Value (US$ Million) Forecast by Enterprise Size , 2019 to 2034
Table 10: North America Market Value (US$ Million) Forecast by Vertical, 2019 to 2034
Table 11: Latin America Market Value (US$ Million) Forecast by Country, 2019 to 2034
Table 12: Latin America Market Value (US$ Million) Forecast by Type, 2019 to 2034
Table 13: Latin America Market Value (US$ Million) Forecast by Component, 2019 to 2034
Table 14: Latin America Market Value (US$ Million) Forecast by Enterprise Size , 2019 to 2034
Table 15: Latin America Market Value (US$ Million) Forecast by Vertical, 2019 to 2034
Table 16: Western Europe Market Value (US$ Million) Forecast by Country, 2019 to 2034
Table 17: Western Europe Market Value (US$ Million) Forecast by Type, 2019 to 2034
Table 18: Western Europe Market Value (US$ Million) Forecast by Component, 2019 to 2034
Table 19: Western Europe Market Value (US$ Million) Forecast by Enterprise Size , 2019 to 2034
Table 20: Western Europe Market Value (US$ Million) Forecast by Vertical, 2019 to 2034
Table 21: Eastern Europe Market Value (US$ Million) Forecast by Country, 2019 to 2034
Table 22: Eastern Europe Market Value (US$ Million) Forecast by Type, 2019 to 2034
Table 23: Eastern Europe Market Value (US$ Million) Forecast by Component, 2019 to 2034
Table 24: Eastern Europe Market Value (US$ Million) Forecast by Enterprise Size , 2019 to 2034
Table 25: Eastern Europe Market Value (US$ Million) Forecast by Vertical, 2019 to 2034
Table 26: South Asia and Pacific Market Value (US$ Million) Forecast by Country, 2019 to 2034
Table 27: South Asia and Pacific Market Value (US$ Million) Forecast by Type, 2019 to 2034
Table 28: South Asia and Pacific Market Value (US$ Million) Forecast by Component, 2019 to 2034
Table 29: South Asia and Pacific Market Value (US$ Million) Forecast by Enterprise Size , 2019 to 2034
Table 30: South Asia and Pacific Market Value (US$ Million) Forecast by Vertical, 2019 to 2034
Table 31: East Asia Market Value (US$ Million) Forecast by Country, 2019 to 2034
Table 32: East Asia Market Value (US$ Million) Forecast by Type, 2019 to 2034
Table 33: East Asia Market Value (US$ Million) Forecast by Component, 2019 to 2034
Table 34: East Asia Market Value (US$ Million) Forecast by Enterprise Size , 2019 to 2034
Table 35: East Asia Market Value (US$ Million) Forecast by Vertical, 2019 to 2034
Table 36: Middle East and Africa Market Value (US$ Million) Forecast by Country, 2019 to 2034
Table 37: Middle East and Africa Market Value (US$ Million) Forecast by Type, 2019 to 2034
Table 38: Middle East and Africa Market Value (US$ Million) Forecast by Component, 2019 to 2034
Table 39: Middle East and Africa Market Value (US$ Million) Forecast by Enterprise Size , 2019 to 2034
Table 40: Middle East and Africa Market Value (US$ Million) Forecast by Vertical, 2019 to 2034
Figure 1: Global Market Value (US$ Million) by Type, 2024 to 2034
Figure 2: Global Market Value (US$ Million) by Component, 2024 to 2034
Figure 3: Global Market Value (US$ Million) by Enterprise Size , 2024 to 2034
Figure 4: Global Market Value (US$ Million) by Vertical, 2024 to 2034
Figure 5: Global Market Value (US$ Million) by Region, 2024 to 2034
Figure 6: Global Market Value (US$ Million) Analysis by Region, 2019 to 2034
Figure 7: Global Market Value Share (%) and BPS Analysis by Region, 2024 to 2034
Figure 8: Global Market Y-o-Y Growth (%) Projections by Region, 2024 to 2034
Figure 9: Global Market Value (US$ Million) Analysis by Type, 2019 to 2034
Figure 10: Global Market Value Share (%) and BPS Analysis by Type, 2024 to 2034
Figure 11: Global Market Y-o-Y Growth (%) Projections by Type, 2024 to 2034
Figure 12: Global Market Value (US$ Million) Analysis by Component, 2019 to 2034
Figure 13: Global Market Value Share (%) and BPS Analysis by Component, 2024 to 2034
Figure 14: Global Market Y-o-Y Growth (%) Projections by Component, 2024 to 2034
Figure 15: Global Market Value (US$ Million) Analysis by Enterprise Size , 2019 to 2034
Figure 16: Global Market Value Share (%) and BPS Analysis by Enterprise Size , 2024 to 2034
Figure 17: Global Market Y-o-Y Growth (%) Projections by Enterprise Size , 2024 to 2034
Figure 18: Global Market Value (US$ Million) Analysis by Vertical, 2019 to 2034
Figure 19: Global Market Value Share (%) and BPS Analysis by Vertical, 2024 to 2034
Figure 20: Global Market Y-o-Y Growth (%) Projections by Vertical, 2024 to 2034
Figure 21: Global Market Attractiveness by Type, 2024 to 2034
Figure 22: Global Market Attractiveness by Component, 2024 to 2034
Figure 23: Global Market Attractiveness by Enterprise Size , 2024 to 2034
Figure 24: Global Market Attractiveness by Vertical, 2024 to 2034
Figure 25: Global Market Attractiveness by Region, 2024 to 2034
Figure 26: North America Market Value (US$ Million) by Type, 2024 to 2034
Figure 27: North America Market Value (US$ Million) by Component, 2024 to 2034
Figure 28: North America Market Value (US$ Million) by Enterprise Size , 2024 to 2034
Figure 29: North America Market Value (US$ Million) by Vertical, 2024 to 2034
Figure 30: North America Market Value (US$ Million) by Country, 2024 to 2034
Figure 31: North America Market Value (US$ Million) Analysis by Country, 2019 to 2034
Figure 32: North America Market Value Share (%) and BPS Analysis by Country, 2024 to 2034
Figure 33: North America Market Y-o-Y Growth (%) Projections by Country, 2024 to 2034
Figure 34: North America Market Value (US$ Million) Analysis by Type, 2019 to 2034
Figure 35: North America Market Value Share (%) and BPS Analysis by Type, 2024 to 2034
Figure 36: North America Market Y-o-Y Growth (%) Projections by Type, 2024 to 2034
Figure 37: North America Market Value (US$ Million) Analysis by Component, 2019 to 2034
Figure 38: North America Market Value Share (%) and BPS Analysis by Component, 2024 to 2034
Figure 39: North America Market Y-o-Y Growth (%) Projections by Component, 2024 to 2034
Figure 40: North America Market Value (US$ Million) Analysis by Enterprise Size , 2019 to 2034
Figure 41: North America Market Value Share (%) and BPS Analysis by Enterprise Size , 2024 to 2034
Figure 42: North America Market Y-o-Y Growth (%) Projections by Enterprise Size , 2024 to 2034
Figure 43: North America Market Value (US$ Million) Analysis by Vertical, 2019 to 2034
Figure 44: North America Market Value Share (%) and BPS Analysis by Vertical, 2024 to 2034
Figure 45: North America Market Y-o-Y Growth (%) Projections by Vertical, 2024 to 2034
Figure 46: North America Market Attractiveness by Type, 2024 to 2034
Figure 47: North America Market Attractiveness by Component, 2024 to 2034
Figure 48: North America Market Attractiveness by Enterprise Size , 2024 to 2034
Figure 49: North America Market Attractiveness by Vertical, 2024 to 2034
Figure 50: North America Market Attractiveness by Country, 2024 to 2034
Figure 51: Latin America Market Value (US$ Million) by Type, 2024 to 2034
Figure 52: Latin America Market Value (US$ Million) by Component, 2024 to 2034
Figure 53: Latin America Market Value (US$ Million) by Enterprise Size , 2024 to 2034
Figure 54: Latin America Market Value (US$ Million) by Vertical, 2024 to 2034
Figure 55: Latin America Market Value (US$ Million) by Country, 2024 to 2034
Figure 56: Latin America Market Value (US$ Million) Analysis by Country, 2019 to 2034
Figure 57: Latin America Market Value Share (%) and BPS Analysis by Country, 2024 to 2034
Figure 58: Latin America Market Y-o-Y Growth (%) Projections by Country, 2024 to 2034
Figure 59: Latin America Market Value (US$ Million) Analysis by Type, 2019 to 2034
Figure 60: Latin America Market Value Share (%) and BPS Analysis by Type, 2024 to 2034
Figure 61: Latin America Market Y-o-Y Growth (%) Projections by Type, 2024 to 2034
Figure 62: Latin America Market Value (US$ Million) Analysis by Component, 2019 to 2034
Figure 63: Latin America Market Value Share (%) and BPS Analysis by Component, 2024 to 2034
Figure 64: Latin America Market Y-o-Y Growth (%) Projections by Component, 2024 to 2034
Figure 65: Latin America Market Value (US$ Million) Analysis by Enterprise Size , 2019 to 2034
Figure 66: Latin America Market Value Share (%) and BPS Analysis by Enterprise Size , 2024 to 2034
Figure 67: Latin America Market Y-o-Y Growth (%) Projections by Enterprise Size , 2024 to 2034
Figure 68: Latin America Market Value (US$ Million) Analysis by Vertical, 2019 to 2034
Figure 69: Latin America Market Value Share (%) and BPS Analysis by Vertical, 2024 to 2034
Figure 70: Latin America Market Y-o-Y Growth (%) Projections by Vertical, 2024 to 2034
Figure 71: Latin America Market Attractiveness by Type, 2024 to 2034
Figure 72: Latin America Market Attractiveness by Component, 2024 to 2034
Figure 73: Latin America Market Attractiveness by Enterprise Size , 2024 to 2034
Figure 74: Latin America Market Attractiveness by Vertical, 2024 to 2034
Figure 75: Latin America Market Attractiveness by Country, 2024 to 2034
Figure 76: Western Europe Market Value (US$ Million) by Type, 2024 to 2034
Figure 77: Western Europe Market Value (US$ Million) by Component, 2024 to 2034
Figure 78: Western Europe Market Value (US$ Million) by Enterprise Size , 2024 to 2034
Figure 79: Western Europe Market Value (US$ Million) by Vertical, 2024 to 2034
Figure 80: Western Europe Market Value (US$ Million) by Country, 2024 to 2034
Figure 81: Western Europe Market Value (US$ Million) Analysis by Country, 2019 to 2034
Figure 82: Western Europe Market Value Share (%) and BPS Analysis by Country, 2024 to 2034
Figure 83: Western Europe Market Y-o-Y Growth (%) Projections by Country, 2024 to 2034
Figure 84: Western Europe Market Value (US$ Million) Analysis by Type, 2019 to 2034
Figure 85: Western Europe Market Value Share (%) and BPS Analysis by Type, 2024 to 2034
Figure 86: Western Europe Market Y-o-Y Growth (%) Projections by Type, 2024 to 2034
Figure 87: Western Europe Market Value (US$ Million) Analysis by Component, 2019 to 2034
Figure 88: Western Europe Market Value Share (%) and BPS Analysis by Component, 2024 to 2034
Figure 89: Western Europe Market Y-o-Y Growth (%) Projections by Component, 2024 to 2034
Figure 90: Western Europe Market Value (US$ Million) Analysis by Enterprise Size , 2019 to 2034
Figure 91: Western Europe Market Value Share (%) and BPS Analysis by Enterprise Size , 2024 to 2034
Figure 92: Western Europe Market Y-o-Y Growth (%) Projections by Enterprise Size , 2024 to 2034
Figure 93: Western Europe Market Value (US$ Million) Analysis by Vertical, 2019 to 2034
Figure 94: Western Europe Market Value Share (%) and BPS Analysis by Vertical, 2024 to 2034
Figure 95: Western Europe Market Y-o-Y Growth (%) Projections by Vertical, 2024 to 2034
Figure 96: Western Europe Market Attractiveness by Type, 2024 to 2034
Figure 97: Western Europe Market Attractiveness by Component, 2024 to 2034
Figure 98: Western Europe Market Attractiveness by Enterprise Size , 2024 to 2034
Figure 99: Western Europe Market Attractiveness by Vertical, 2024 to 2034
Figure 100: Western Europe Market Attractiveness by Country, 2024 to 2034
Figure 101: Eastern Europe Market Value (US$ Million) by Type, 2024 to 2034
Figure 102: Eastern Europe Market Value (US$ Million) by Component, 2024 to 2034
Figure 103: Eastern Europe Market Value (US$ Million) by Enterprise Size , 2024 to 2034
Figure 104: Eastern Europe Market Value (US$ Million) by Vertical, 2024 to 2034
Figure 105: Eastern Europe Market Value (US$ Million) by Country, 2024 to 2034
Figure 106: Eastern Europe Market Value (US$ Million) Analysis by Country, 2019 to 2034
Figure 107: Eastern Europe Market Value Share (%) and BPS Analysis by Country, 2024 to 2034
Figure 108: Eastern Europe Market Y-o-Y Growth (%) Projections by Country, 2024 to 2034
Figure 109: Eastern Europe Market Value (US$ Million) Analysis by Type, 2019 to 2034
Figure 110: Eastern Europe Market Value Share (%) and BPS Analysis by Type, 2024 to 2034
Figure 111: Eastern Europe Market Y-o-Y Growth (%) Projections by Type, 2024 to 2034
Figure 112: Eastern Europe Market Value (US$ Million) Analysis by Component, 2019 to 2034
Figure 113: Eastern Europe Market Value Share (%) and BPS Analysis by Component, 2024 to 2034
Figure 114: Eastern Europe Market Y-o-Y Growth (%) Projections by Component, 2024 to 2034
Figure 115: Eastern Europe Market Value (US$ Million) Analysis by Enterprise Size , 2019 to 2034
Figure 116: Eastern Europe Market Value Share (%) and BPS Analysis by Enterprise Size , 2024 to 2034
Figure 117: Eastern Europe Market Y-o-Y Growth (%) Projections by Enterprise Size , 2024 to 2034
Figure 118: Eastern Europe Market Value (US$ Million) Analysis by Vertical, 2019 to 2034
Figure 119: Eastern Europe Market Value Share (%) and BPS Analysis by Vertical, 2024 to 2034
Figure 120: Eastern Europe Market Y-o-Y Growth (%) Projections by Vertical, 2024 to 2034
Figure 121: Eastern Europe Market Attractiveness by Type, 2024 to 2034
Figure 122: Eastern Europe Market Attractiveness by Component, 2024 to 2034
Figure 123: Eastern Europe Market Attractiveness by Enterprise Size , 2024 to 2034
Figure 124: Eastern Europe Market Attractiveness by Vertical, 2024 to 2034
Figure 125: Eastern Europe Market Attractiveness by Country, 2024 to 2034
Figure 126: South Asia and Pacific Market Value (US$ Million) by Type, 2024 to 2034
Figure 127: South Asia and Pacific Market Value (US$ Million) by Component, 2024 to 2034
Figure 128: South Asia and Pacific Market Value (US$ Million) by Enterprise Size , 2024 to 2034
Figure 129: South Asia and Pacific Market Value (US$ Million) by Vertical, 2024 to 2034
Figure 130: South Asia and Pacific Market Value (US$ Million) by Country, 2024 to 2034
Figure 131: South Asia and Pacific Market Value (US$ Million) Analysis by Country, 2019 to 2034
Figure 132: South Asia and Pacific Market Value Share (%) and BPS Analysis by Country, 2024 to 2034
Figure 133: South Asia and Pacific Market Y-o-Y Growth (%) Projections by Country, 2024 to 2034
Figure 134: South Asia and Pacific Market Value (US$ Million) Analysis by Type, 2019 to 2034
Figure 135: South Asia and Pacific Market Value Share (%) and BPS Analysis by Type, 2024 to 2034
Figure 136: South Asia and Pacific Market Y-o-Y Growth (%) Projections by Type, 2024 to 2034
Figure 137: South Asia and Pacific Market Value (US$ Million) Analysis by Component, 2019 to 2034
Figure 138: South Asia and Pacific Market Value Share (%) and BPS Analysis by Component, 2024 to 2034
Figure 139: South Asia and Pacific Market Y-o-Y Growth (%) Projections by Component, 2024 to 2034
Figure 140: South Asia and Pacific Market Value (US$ Million) Analysis by Enterprise Size , 2019 to 2034
Figure 141: South Asia and Pacific Market Value Share (%) and BPS Analysis by Enterprise Size , 2024 to 2034
Figure 142: South Asia and Pacific Market Y-o-Y Growth (%) Projections by Enterprise Size , 2024 to 2034
Figure 143: South Asia and Pacific Market Value (US$ Million) Analysis by Vertical, 2019 to 2034
Figure 144: South Asia and Pacific Market Value Share (%) and BPS Analysis by Vertical, 2024 to 2034
Figure 145: South Asia and Pacific Market Y-o-Y Growth (%) Projections by Vertical, 2024 to 2034
Figure 146: South Asia and Pacific Market Attractiveness by Type, 2024 to 2034
Figure 147: South Asia and Pacific Market Attractiveness by Component, 2024 to 2034
Figure 148: South Asia and Pacific Market Attractiveness by Enterprise Size , 2024 to 2034
Figure 149: South Asia and Pacific Market Attractiveness by Vertical, 2024 to 2034
Figure 150: South Asia and Pacific Market Attractiveness by Country, 2024 to 2034
Figure 151: East Asia Market Value (US$ Million) by Type, 2024 to 2034
Figure 152: East Asia Market Value (US$ Million) by Component, 2024 to 2034
Figure 153: East Asia Market Value (US$ Million) by Enterprise Size , 2024 to 2034
Figure 154: East Asia Market Value (US$ Million) by Vertical, 2024 to 2034
Figure 155: East Asia Market Value (US$ Million) by Country, 2024 to 2034
Figure 156: East Asia Market Value (US$ Million) Analysis by Country, 2019 to 2034
Figure 157: East Asia Market Value Share (%) and BPS Analysis by Country, 2024 to 2034
Figure 158: East Asia Market Y-o-Y Growth (%) Projections by Country, 2024 to 2034
Figure 159: East Asia Market Value (US$ Million) Analysis by Type, 2019 to 2034
Figure 160: East Asia Market Value Share (%) and BPS Analysis by Type, 2024 to 2034
Figure 161: East Asia Market Y-o-Y Growth (%) Projections by Type, 2024 to 2034
Figure 162: East Asia Market Value (US$ Million) Analysis by Component, 2019 to 2034
Figure 163: East Asia Market Value Share (%) and BPS Analysis by Component, 2024 to 2034
Figure 164: East Asia Market Y-o-Y Growth (%) Projections by Component, 2024 to 2034
Figure 165: East Asia Market Value (US$ Million) Analysis by Enterprise Size , 2019 to 2034
Figure 166: East Asia Market Value Share (%) and BPS Analysis by Enterprise Size , 2024 to 2034
Figure 167: East Asia Market Y-o-Y Growth (%) Projections by Enterprise Size , 2024 to 2034
Figure 168: East Asia Market Value (US$ Million) Analysis by Vertical, 2019 to 2034
Figure 169: East Asia Market Value Share (%) and BPS Analysis by Vertical, 2024 to 2034
Figure 170: East Asia Market Y-o-Y Growth (%) Projections by Vertical, 2024 to 2034
Figure 171: East Asia Market Attractiveness by Type, 2024 to 2034
Figure 172: East Asia Market Attractiveness by Component, 2024 to 2034
Figure 173: East Asia Market Attractiveness by Enterprise Size , 2024 to 2034
Figure 174: East Asia Market Attractiveness by Vertical, 2024 to 2034
Figure 175: East Asia Market Attractiveness by Country, 2024 to 2034
Figure 176: Middle East and Africa Market Value (US$ Million) by Type, 2024 to 2034
Figure 177: Middle East and Africa Market Value (US$ Million) by Component, 2024 to 2034
Figure 178: Middle East and Africa Market Value (US$ Million) by Enterprise Size , 2024 to 2034
Figure 179: Middle East and Africa Market Value (US$ Million) by Vertical, 2024 to 2034
Figure 180: Middle East and Africa Market Value (US$ Million) by Country, 2024 to 2034
Figure 181: Middle East and Africa Market Value (US$ Million) Analysis by Country, 2019 to 2034
Figure 182: Middle East and Africa Market Value Share (%) and BPS Analysis by Country, 2024 to 2034
Figure 183: Middle East and Africa Market Y-o-Y Growth (%) Projections by Country, 2024 to 2034
Figure 184: Middle East and Africa Market Value (US$ Million) Analysis by Type, 2019 to 2034
Figure 185: Middle East and Africa Market Value Share (%) and BPS Analysis by Type, 2024 to 2034
Figure 186: Middle East and Africa Market Y-o-Y Growth (%) Projections by Type, 2024 to 2034
Figure 187: Middle East and Africa Market Value (US$ Million) Analysis by Component, 2019 to 2034
Figure 188: Middle East and Africa Market Value Share (%) and BPS Analysis by Component, 2024 to 2034
Figure 189: Middle East and Africa Market Y-o-Y Growth (%) Projections by Component, 2024 to 2034
Figure 190: Middle East and Africa Market Value (US$ Million) Analysis by Enterprise Size , 2019 to 2034
Figure 191: Middle East and Africa Market Value Share (%) and BPS Analysis by Enterprise Size , 2024 to 2034
Figure 192: Middle East and Africa Market Y-o-Y Growth (%) Projections by Enterprise Size , 2024 to 2034
Figure 193: Middle East and Africa Market Value (US$ Million) Analysis by Vertical, 2019 to 2034
Figure 194: Middle East and Africa Market Value Share (%) and BPS Analysis by Vertical, 2024 to 2034
Figure 195: Middle East and Africa Market Y-o-Y Growth (%) Projections by Vertical, 2024 to 2034
Figure 196: Middle East and Africa Market Attractiveness by Type, 2024 to 2034
Figure 197: Middle East and Africa Market Attractiveness by Component, 2024 to 2034
Figure 198: Middle East and Africa Market Attractiveness by Enterprise Size , 2024 to 2034
Figure 199: Middle East and Africa Market Attractiveness by Vertical, 2024 to 2034
Figure 200: Middle East and Africa Market Attractiveness by Country, 2024 to 2034
The penetration testing market is expected to reach a valuation of USD 1,913.6 million in 2024.
The United Kingdom penetration testing ecosystem is poised to expand at a 4.5% CAGR from 2024 to 2034.
The penetration testing market is set to expand by a CAGR of 14.4% by 2034.
The penetration testing market is forecasted to reach USD 7,363.3 million by 2034.
Software is preferred and are expected to rise at a market share of 65.1% in 2024.
Explore Similar Insights
Thank you!
You will receive an email from our Business Development Manager. Please be sure to check your SPAM/JUNK folder too.