Permanent Magnet Motor Market Size and Share Forecast Outlook From 2024 to 2034

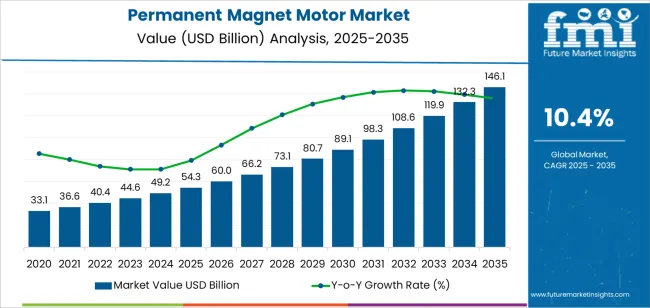
The permanent magnet motor market is valued at USD 49.2 billion in 2024 and is projected to reach USD 132 billion by 2034, exhibiting a modest CAGR of 10.40% over the forecast period.

The permanent magnet motor industry generated an estimated revenue of USD 26.5 billion in 2019. In the past four years, the market grew at a pace of 13.5% CAGR and added revenue of USD 43.90 billion. Several reasons can be attributed to this growth:

  • Increasing adoption of electric vehicles (EVs) and hybrid vehicles, utilizing permanent magnet motors in their propulsion systems
  • Growing demand for energy-efficient appliances and industrial equipment, where permanent magnet motors offer higher efficiency compared to traditional motors
  • Expansion of renewable energy generation, such as wind turbines and hydropower systems, which heavily rely on permanent magnet motors for their operation
  • Technological advancements leading to improved performance and reliability of permanent magnet motors, making them more attractive across various industries
  • Favorable government policies and regulations promoting the use of sustainable and eco-friendly technologies, including permanent magnet motors
  • Rising awareness among consumers and industries about the benefits of permanent magnet motors in terms of reduced energy consumption and lower operational costs
  • Increasing investments in research and development aimed at further enhancing the efficiency and capabilities of permanent magnet motor technology.
  • Integration of permanent magnet motors in various applications beyond traditional uses, including robotics, medical devices, and aerospace.
  • Global initiatives to reduce carbon emissions and combat climate change, pushing industries to adopt cleaner and more energy-efficient technologies like permanent magnet motors
Attributes Key Statistics
Expected Base Year Value (2024) USD 49.2 billion
Anticipated Forecast Value (2034) USD 132 billion
Estimated Growth (2024 to 2034) 10.40% CAGR

Consumption Trends Shaping the Permanent Magnet Motor Market

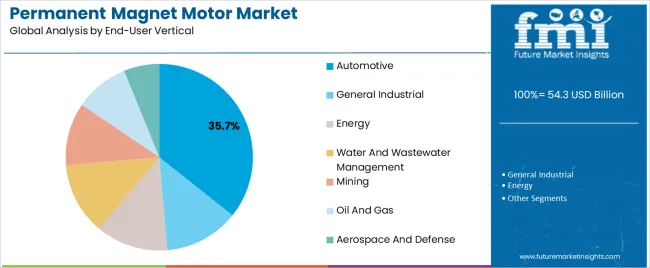
  • The global automotive sector is increasingly adopting permanent magnet motors, especially companies involved in electric vehicles (EVs) and hybrid vehicles in electric propulsion systems, traction motors, power steering systems, and pumps
  • The sales of permanent magnet motors are also growing among industries such as manufacturing, mining, construction, and materials as they offer higher efficiency, compact size, and better performance compared to traditional motors
  • Permanent magnet motors are also experiencing increasing demand from renewable energy companies, particularly in wind turbines and hydropower systems. They are used in generators and turbines to convert mechanical energy into electrical energy efficiently.
  • Heating, ventilation, and air conditioning (HVAC) systems also incorporate permanent magnet motors, in fans, blowers, and pumps for efficient air circulation and temperature control in buildings and commercial spaces
  • The growing adoption of permanent magnet motors is also observed in aerospace and defense applications, where they are used in actuators, pumps, and various systems requiring lightweight, high-performance motors with precise control capabilities
  • The sales of permanent magnet motors are also touching the skies in robotic systems and industrial automation equipment. They provide high torque-to-weight ratios, fast response times, and precise control for robotic motion and automation tasks

Factors Restraining the Demand for Permanent Magnet Motors

The permanent magnet motor industry is anticipated to surpass a global valuation of USD USD 132 billion by the year 2034, with a growth rate of 10.40% CAGR. While the market is expected to experience remarkable growth, several restraining factors could adversely affect its development:

  • Operating and installing permanent magnetic motors in factory units requires specialized expertise and skill. The lack of a skilled workforce is a major hurdle for businesses in underdeveloped parts of the world.
  • Competing technologies such as induction motors or switched reluctance motors also significantly hinder the widespread adoption of permanent magnetic motors in industries across the world
  • Integrating permanent magnet motors into existing systems with permanent magnet motors also requires significant retrofitting or redesign. This factor also contributes to the negative market growth for permanent magnet motors.

Permanent Magnet Motor Industry Analysis by Top Investment Segments

DC Permanent Magnetic Motors to Revolutionize the Global Industrial Sector

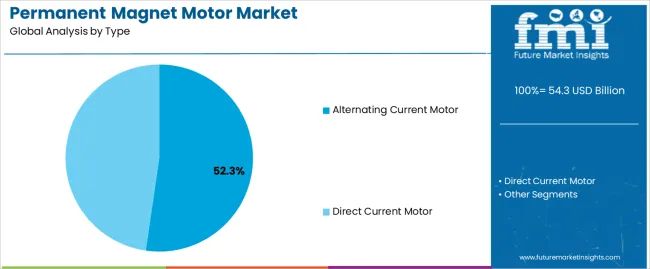
Depending on the motor type, the permanent magnet motor industry is bifurcated into DC and AC motors. The DC motors segment is anticipated to grow at a remarkable CAGR of 10.10%.

  • The demand for DC permanent magnet motors is skyrocketing among manufacturing units due to their high efficiency, compact size, and precise control, which are transforming various industrial processes and applications.
  • Direct current permanent magnetic motors are enhancing productivity, reducing energy consumption, and enabling innovative solutions across manufacturing, automation, robotics, and renewable energy industries
  • The adoption of direct current permanent magnetic motors is very likely to follow an upward trajectory as companies increasingly seek sustainable and cost-effective solutions in their factory units.
Attributes Details
Motor Type Direct Current
CAGR 10.10%

Ferrite Permanent Magnetic Motors’ Sales to Touch the Skies in the Future

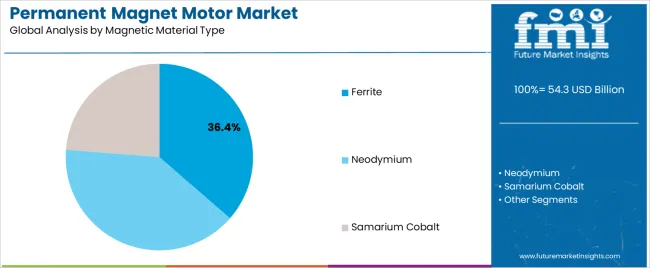
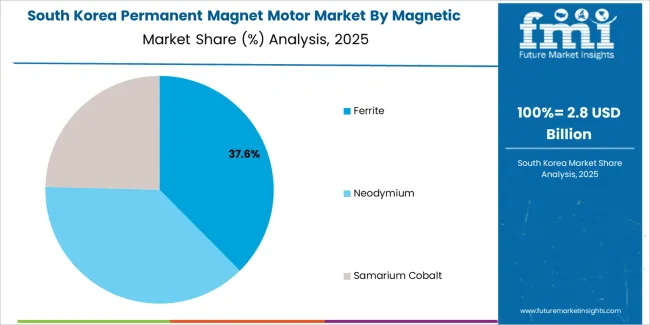
The permanent magnet motor industry is categorized by materials into ferrite, neodymium, and samarium cobalt. The ferrite segment dominates the market and is anticipated to grow at an outstanding CAGR of 9.80%.

  • Businesses are increasingly preferring permanent magnet motors due to cost-effectiveness, durability, and resistance to demagnetization.
  • Their demand is also growing as they offer a perfect solution for various industrial and consumer applications, including automotive, appliances, electronics, and renewable energy systems.
Attributes Details
Materials Ferrite
CAGR 9.80%

Analysis of Top Countries, Manufacturing and Deploying Permanent Magnet Motors

The section provides an analysis of the permanent magnet motor industry by country, including Japan, China, the United States, South Korea, and the United Kingdom. The table presents the CAGR for each country, indicating the expected growth of the market in through 2034.

Countries CAGR
South Korea 12.10%
The United Kingdom 11.80%
China 11.10%
The United States 10.70%
Japan 8.80%

Permanent Magnet Motor Market in South Korea

South Korea is one of the leading countries in this market. The South Korean permanent magnet motor industry is anticipated to retain its dominance by progressing at an annual growth rate of 12.10% till 2034.

  • Permanent magnetic motors are one of the important components in wind power and electric vehicles, and the South Korean government has been actively promoting the development and adoption of renewable energy technologies. This naturally generates significant demand for these motors in the country.
  • South Korea is home to major automotive manufacturers like Hyundai and Kia, which are increasingly investing in electric vehicle production. This expansion also creates a perfect environment for the growth of the permanent magnetic motor market in South Korea.

Permanent Magnet Motor Market in the United Kingdom

The United Kingdom also dominates the permanent magnet motor industry. The United Kingdom's permanent magnet motor market is anticipated to retain its dominance by progressing at an annual growth rate of 11.80% till 2034.

  • Similar to South Korea, the United Kingdom’s government is concerned about its sustainability goals and carbon emissions. This is why a considerable number of wind turbines, tidal energy systems, and other renewable energy projects that extensively use permanent magnet motors are found in the country.
  • Apart from this, the United Kingdom's industrial sector is transforming with the adoption of Industry 4.0 technologies. Permanent magnet motors play a crucial role in industrial automation, amplifying their adoption across various manufacturing processes.

Permanent Magnet Motor Market in China

China’s permanent magnet motor market is anticipated to exhibit a CAGR of 11.10% till 2034.

  • China has the world’s most comprehensive market for renewable energy, with significant investments in wind power, solar energy, and electric vehicles. Permanent magnetic motors are required in these industries to ensure efficient energy conversion and utilization.
  • China is also the largest manufacturer of permanent magnet motors. This also makes businesses easily adopt these motors in their factory unit. Besides this, government subsidies and grants also help these companies in the adoption.

Permanent Magnet Motor Market in the United States

The United States is also one of the leading countries in the global permanent magnet motor industry, which is anticipated to register a CAGR of 10.70% through 2034.

  • In recent years, there has been a growing emphasis on clean energy and sustainability in the United States. Government initiatives, such as tax credits for renewable energy projects and investments in electric vehicle infrastructure, are driving the demand for permanent magnet motors in various applications
  • The United States is home to many innovative companies and research institutions that are developing advanced permanent magnet motor technologies. The presence of these companies is also driving the market growth for permanent magnet motors in the country.

Permanent Magnet Motor Market in Japan

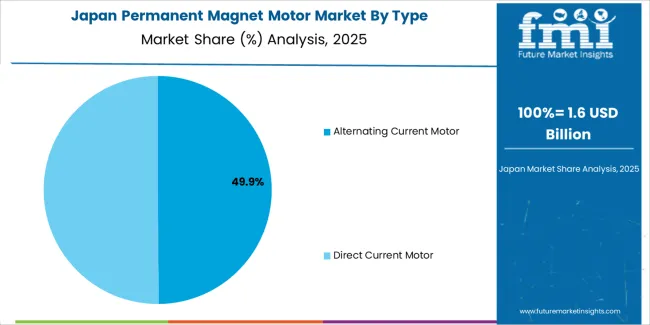
The demand for permanent magnet motors in Japan is projected to rise at an 8.80% CAGR through 2034.

  • Major Japanese automakers like Toyota, Nissan, and Honda are investing heavily in electric and hybrid vehicles. Permanent magnet motors play a crucial role in these vehicles, and the growth of the electric vehicle market in Japan boosts the demand for these motors
  • Japan, as a country, is very particular about its energy resources, as it is an island country with very limited natural resources. Permanent magnet motors are integral components of renewable energy systems such as wind turbines and solar tracking systems. This is driving their demand in the Land of the Rising Sun.

Key Players and Market Concentration in the Permanent Magnet Motor Industry

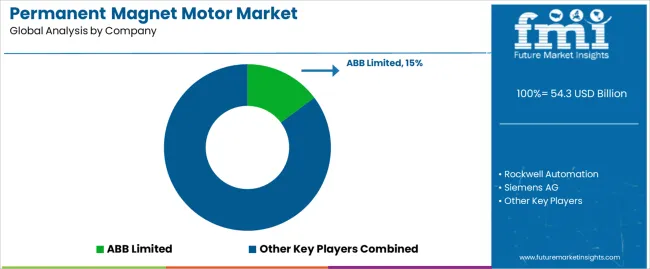
The global market for permanent magnet motors is filled with international and domestic countries. ABB Limited, Rockwell Automation, Siemens AG, Franklin Electric Company Inc., and Allied Motion Technologies Inc.

are prominent companies in the permanent magnet motor industry. These companies invest heavily in developing motors with increased efficiency, enhanced functionality, and smart features.

Key players in the market are also collaborating with government and non-government environmental entities to improve their reputation as socially responsible entities, attracting environmentally conscious consumers to the market.

Recent Developments
  • In November 2023, General Motors and Stellantis backed Niron Magnetics in developing rare-earth-free permanent magnets for EVs. Despite skepticism from experts, a USD 33 million investment aimed to mass-produce iron-nitride magnets for future GM electric vehicles.
  • In June 2023, Chengdu Line 7 in China saw a successful demonstration of metro train traction equipment, featuring a silicon carbide traction converter and permanent magnet synchronous motor. Developed by Alstom NUG Propulsion System Co, the technology delivered a 30% energy saving and reduced weight and noise.
  • In August 2023, NORD unveiled new design enhancements and larger frame sizes for their permanent magnet synchronous motor line, catering to diverse industry needs. The additions included a size 90 TENV variant, boasting enhanced corrosion resistance and efficiency for demanding applications like food and pharmaceuticals.

Leading Suppliers in the Global Permanent Magnet Motor Market

  • ABB Limited
  • Rockwell Automation
  • Siemens AG
  • Franklin Electric Company Inc.
  • Allied Motion Technologies Inc.
  • NORD Drivesystems
  • Mitsubishi Electric Corporation
  • Toshiba Corporation
  • Yaskawa Electric Corporation
  • Regal Beloit Corporation
  • WEG Electric Corp.
  • Nidec Corporation
  • Johnson Electric Holdings Limited
  • Maxon Motor AG
  • Danfoss Group
  • Parker Hannifin Corporation
  • Emerson Electric Co.
  • Hitachi, Ltd.
  • Bonfiglioli Riduttori S.p.A.
  • Schneider Electric SE

Key Shifting Preferences Covered in the Permanent Magnet Motor Market Report

  • Manufacturers of Permanent Magnet Synchronous Motors in India
  • Pricing Strategy for 5KW Permanent Magnet Synchronous Motors in India
  • Future of Permanent Magnet Motor Industry
  • Efficiency of Permanent Magnet Motors as compared to Conventional Motors
  • Applications of Permanent Magnet Motors in the EV Industry
  • Factors affecting the cost of Permanent Magnet Motors for the Global EV Industry

Top Segments Studied in the Permanent Magnet Motor Market

By Motor Type:

  • Direct Current Motor
  • Alternating Current Motor

By Magnetic Material Type:

  • Ferrite
  • Neodymium
  • Samarium Cobalt

By End-user Vertical:

  • General Industrial
  • Automotive
  • Energy
  • Water and Wastewater Management
  • Mining
  • Oil and Gas
  • Aerospace and Defense

By Region:

  • North America
  • Latin America
  • Asia Pacific
  • Middle East and Africa (MEA)
  • Europe

Table of Content

  • 1. Executive Summary
  • 2. Market Overview
  • 3. Market Background
  • 4. Global Market Analysis 2019 to 2023 and Forecast, 2024 to 2034
  • 5. Global Market Analysis 2019 to 2023 and Forecast 2024 to 2034, By Motor Type
    • 5.1. Direct Current Motor
    • 5.2. Alternating Current Motor
  • 6. Global Market Analysis 2019 to 2023 and Forecast 2024 to 2034, By Magnetic Material Type
    • 6.1. Ferrite
    • 6.2. Neodymium
    • 6.3. Samarium Cobalt
  • 7. Global Market Analysis 2019 to 2023 and Forecast 2024 to 2034, By End-user Vertical
    • 7.1. General Industrial
    • 7.2. Automotive
    • 7.3. Energy
    • 7.4. Water and Wastewater Management
    • 7.5. Mining
    • 7.6. Oil and Gas
    • 7.7. Aerospace and Defense
  • 8. Global Market Analysis 2019 to 2023 and Forecast 2024 to 2034, By Region
  • 9. North America Market Analysis 2019 to 2023 and Forecast 2024 to 2034, By Country
  • 10. Latin America Market Analysis 2019 to 2023 and Forecast 2024 to 2034, By Country
  • 11. Western Europe Market Analysis 2019 to 2023 and Forecast 2024 to 2034, By Country
  • 12. Eastern Europe Market Analysis 2019 to 2023 and Forecast 2024 to 2034, By Country
  • 13. South Asia and Pacific Market Analysis 2019 to 2023 and Forecast 2024 to 2034, By Country
  • 14. East Asia Market Analysis 2019 to 2023 and Forecast 2024 to 2034, By Country
  • 15. Middle East and Africa Market Analysis 2019 to 2023 and Forecast 2024 to 2034, By Country
  • 16. Key Countries Market Analysis
  • 17. Market Structure Analysis
  • 18. Competition Analysis
    • 18.1. Danaher Corporation
    • 18.2. Siemens AG
    • 18.3. Rockwell Automation Inc.
    • 18.4. Ametek Inc.
    • 18.5. Toshiba Corporation
    • 18.6. Baldor Electric Company Inc.
    • 18.7. Autotrol Corporation
    • 18.8. Allied Motion Technologies Inc.
    • 18.9. Johnson Electric Holdings Ltd.
    • 18.10. Franklin Electric Co. Inc.
  • 19. Assumptions & Acronyms Used
  • 20. Research Methodology

List of Tables

Table 1: Global Market Value (US$ Million) Forecast by Region, 2019 to 2034

Table 2: Global Market Volume (Units) Forecast by Region, 2019 to 2034

Table 3: Global Market Value (US$ Million) Forecast by Motor Type, 2019 to 2034

Table 4: Global Market Volume (Units) Forecast by Motor Type, 2019 to 2034

Table 5: Global Market Value (US$ Million) Forecast by Magnetic Material Type, 2019 to 2034

Table 6: Global Market Volume (Units) Forecast by Magnetic Material Type, 2019 to 2034

Table 7: Global Market Value (US$ Million) Forecast by End-user Vertical, 2019 to 2034

Table 8: Global Market Volume (Units) Forecast by End-user Vertical, 2019 to 2034

Table 9: North America Market Value (US$ Million) Forecast by Country, 2019 to 2034

Table 10: North America Market Volume (Units) Forecast by Country, 2019 to 2034

Table 11: North America Market Value (US$ Million) Forecast by Motor Type, 2019 to 2034

Table 12: North America Market Volume (Units) Forecast by Motor Type, 2019 to 2034

Table 13: North America Market Value (US$ Million) Forecast by Magnetic Material Type, 2019 to 2034

Table 14: North America Market Volume (Units) Forecast by Magnetic Material Type, 2019 to 2034

Table 15: North America Market Value (US$ Million) Forecast by End-user Vertical, 2019 to 2034

Table 16: North America Market Volume (Units) Forecast by End-user Vertical, 2019 to 2034

Table 17: Latin America Market Value (US$ Million) Forecast by Country, 2019 to 2034

Table 18: Latin America Market Volume (Units) Forecast by Country, 2019 to 2034

Table 19: Latin America Market Value (US$ Million) Forecast by Motor Type, 2019 to 2034

Table 20: Latin America Market Volume (Units) Forecast by Motor Type, 2019 to 2034

Table 21: Latin America Market Value (US$ Million) Forecast by Magnetic Material Type, 2019 to 2034

Table 22: Latin America Market Volume (Units) Forecast by Magnetic Material Type, 2019 to 2034

Table 23: Latin America Market Value (US$ Million) Forecast by End-user Vertical, 2019 to 2034

Table 24: Latin America Market Volume (Units) Forecast by End-user Vertical, 2019 to 2034

Table 25: Western Europe Market Value (US$ Million) Forecast by Country, 2019 to 2034

Table 26: Western Europe Market Volume (Units) Forecast by Country, 2019 to 2034

Table 27: Western Europe Market Value (US$ Million) Forecast by Motor Type, 2019 to 2034

Table 28: Western Europe Market Volume (Units) Forecast by Motor Type, 2019 to 2034

Table 29: Western Europe Market Value (US$ Million) Forecast by Magnetic Material Type, 2019 to 2034

Table 30: Western Europe Market Volume (Units) Forecast by Magnetic Material Type, 2019 to 2034

Table 31: Western Europe Market Value (US$ Million) Forecast by End-user Vertical, 2019 to 2034

Table 32: Western Europe Market Volume (Units) Forecast by End-user Vertical, 2019 to 2034

Table 33: Eastern Europe Market Value (US$ Million) Forecast by Country, 2019 to 2034

Table 34: Eastern Europe Market Volume (Units) Forecast by Country, 2019 to 2034

Table 35: Eastern Europe Market Value (US$ Million) Forecast by Motor Type, 2019 to 2034

Table 36: Eastern Europe Market Volume (Units) Forecast by Motor Type, 2019 to 2034

Table 37: Eastern Europe Market Value (US$ Million) Forecast by Magnetic Material Type, 2019 to 2034

Table 38: Eastern Europe Market Volume (Units) Forecast by Magnetic Material Type, 2019 to 2034

Table 39: Eastern Europe Market Value (US$ Million) Forecast by End-user Vertical, 2019 to 2034

Table 40: Eastern Europe Market Volume (Units) Forecast by End-user Vertical, 2019 to 2034

Table 41: South Asia and Pacific Market Value (US$ Million) Forecast by Country, 2019 to 2034

Table 42: South Asia and Pacific Market Volume (Units) Forecast by Country, 2019 to 2034

Table 43: South Asia and Pacific Market Value (US$ Million) Forecast by Motor Type, 2019 to 2034

Table 44: South Asia and Pacific Market Volume (Units) Forecast by Motor Type, 2019 to 2034

Table 45: South Asia and Pacific Market Value (US$ Million) Forecast by Magnetic Material Type, 2019 to 2034

Table 46: South Asia and Pacific Market Volume (Units) Forecast by Magnetic Material Type, 2019 to 2034

Table 47: South Asia and Pacific Market Value (US$ Million) Forecast by End-user Vertical, 2019 to 2034

Table 48: South Asia and Pacific Market Volume (Units) Forecast by End-user Vertical, 2019 to 2034

Table 49: East Asia Market Value (US$ Million) Forecast by Country, 2019 to 2034

Table 50: East Asia Market Volume (Units) Forecast by Country, 2019 to 2034

Table 51: East Asia Market Value (US$ Million) Forecast by Motor Type, 2019 to 2034

Table 52: East Asia Market Volume (Units) Forecast by Motor Type, 2019 to 2034

Table 53: East Asia Market Value (US$ Million) Forecast by Magnetic Material Type, 2019 to 2034

Table 54: East Asia Market Volume (Units) Forecast by Magnetic Material Type, 2019 to 2034

Table 55: East Asia Market Value (US$ Million) Forecast by End-user Vertical, 2019 to 2034

Table 56: East Asia Market Volume (Units) Forecast by End-user Vertical, 2019 to 2034

Table 57: Middle East and Africa Market Value (US$ Million) Forecast by Country, 2019 to 2034

Table 58: Middle East and Africa Market Volume (Units) Forecast by Country, 2019 to 2034

Table 59: Middle East and Africa Market Value (US$ Million) Forecast by Motor Type, 2019 to 2034

Table 60: Middle East and Africa Market Volume (Units) Forecast by Motor Type, 2019 to 2034

Table 61: Middle East and Africa Market Value (US$ Million) Forecast by Magnetic Material Type, 2019 to 2034

Table 62: Middle East and Africa Market Volume (Units) Forecast by Magnetic Material Type, 2019 to 2034

Table 63: Middle East and Africa Market Value (US$ Million) Forecast by End-user Vertical, 2019 to 2034

Table 64: Middle East and Africa Market Volume (Units) Forecast by End-user Vertical, 2019 to 2034

List of Figures

Figure 1: Global Market Value (US$ Million) by Motor Type, 2024 to 2034

Figure 2: Global Market Value (US$ Million) by Magnetic Material Type, 2024 to 2034

Figure 3: Global Market Value (US$ Million) by End-user Vertical, 2024 to 2034

Figure 4: Global Market Value (US$ Million) by Region, 2024 to 2034

Figure 5: Global Market Value (US$ Million) Analysis by Region, 2019 to 2034

Figure 6: Global Market Volume (Units) Analysis by Region, 2019 to 2034

Figure 7: Global Market Value Share (%) and BPS Analysis by Region, 2024 to 2034

Figure 8: Global Market Y-o-Y Growth (%) Projections by Region, 2024 to 2034

Figure 9: Global Market Value (US$ Million) Analysis by Motor Type, 2019 to 2034

Figure 10: Global Market Volume (Units) Analysis by Motor Type, 2019 to 2034

Figure 11: Global Market Value Share (%) and BPS Analysis by Motor Type, 2024 to 2034

Figure 12: Global Market Y-o-Y Growth (%) Projections by Motor Type, 2024 to 2034

Figure 13: Global Market Value (US$ Million) Analysis by Magnetic Material Type, 2019 to 2034

Figure 14: Global Market Volume (Units) Analysis by Magnetic Material Type, 2019 to 2034

Figure 15: Global Market Value Share (%) and BPS Analysis by Magnetic Material Type, 2024 to 2034

Figure 16: Global Market Y-o-Y Growth (%) Projections by Magnetic Material Type, 2024 to 2034

Figure 17: Global Market Value (US$ Million) Analysis by End-user Vertical, 2019 to 2034

Figure 18: Global Market Volume (Units) Analysis by End-user Vertical, 2019 to 2034

Figure 19: Global Market Value Share (%) and BPS Analysis by End-user Vertical, 2024 to 2034

Figure 20: Global Market Y-o-Y Growth (%) Projections by End-user Vertical, 2024 to 2034

Figure 21: Global Market Attractiveness by Motor Type, 2024 to 2034

Figure 22: Global Market Attractiveness by Magnetic Material Type, 2024 to 2034

Figure 23: Global Market Attractiveness by End-user Vertical, 2024 to 2034

Figure 24: Global Market Attractiveness by Region, 2024 to 2034

Figure 25: North America Market Value (US$ Million) by Motor Type, 2024 to 2034

Figure 26: North America Market Value (US$ Million) by Magnetic Material Type, 2024 to 2034

Figure 27: North America Market Value (US$ Million) by End-user Vertical, 2024 to 2034

Figure 28: North America Market Value (US$ Million) by Country, 2024 to 2034

Figure 29: North America Market Value (US$ Million) Analysis by Country, 2019 to 2034

Figure 30: North America Market Volume (Units) Analysis by Country, 2019 to 2034

Figure 31: North America Market Value Share (%) and BPS Analysis by Country, 2024 to 2034

Figure 32: North America Market Y-o-Y Growth (%) Projections by Country, 2024 to 2034

Figure 33: North America Market Value (US$ Million) Analysis by Motor Type, 2019 to 2034

Figure 34: North America Market Volume (Units) Analysis by Motor Type, 2019 to 2034

Figure 35: North America Market Value Share (%) and BPS Analysis by Motor Type, 2024 to 2034

Figure 36: North America Market Y-o-Y Growth (%) Projections by Motor Type, 2024 to 2034

Figure 37: North America Market Value (US$ Million) Analysis by Magnetic Material Type, 2019 to 2034

Figure 38: North America Market Volume (Units) Analysis by Magnetic Material Type, 2019 to 2034

Figure 39: North America Market Value Share (%) and BPS Analysis by Magnetic Material Type, 2024 to 2034

Figure 40: North America Market Y-o-Y Growth (%) Projections by Magnetic Material Type, 2024 to 2034

Figure 41: North America Market Value (US$ Million) Analysis by End-user Vertical, 2019 to 2034

Figure 42: North America Market Volume (Units) Analysis by End-user Vertical, 2019 to 2034

Figure 43: North America Market Value Share (%) and BPS Analysis by End-user Vertical, 2024 to 2034

Figure 44: North America Market Y-o-Y Growth (%) Projections by End-user Vertical, 2024 to 2034

Figure 45: North America Market Attractiveness by Motor Type, 2024 to 2034

Figure 46: North America Market Attractiveness by Magnetic Material Type, 2024 to 2034

Figure 47: North America Market Attractiveness by End-user Vertical, 2024 to 2034

Figure 48: North America Market Attractiveness by Country, 2024 to 2034

Figure 49: Latin America Market Value (US$ Million) by Motor Type, 2024 to 2034

Figure 50: Latin America Market Value (US$ Million) by Magnetic Material Type, 2024 to 2034

Figure 51: Latin America Market Value (US$ Million) by End-user Vertical, 2024 to 2034

Figure 52: Latin America Market Value (US$ Million) by Country, 2024 to 2034

Figure 53: Latin America Market Value (US$ Million) Analysis by Country, 2019 to 2034

Figure 54: Latin America Market Volume (Units) Analysis by Country, 2019 to 2034

Figure 55: Latin America Market Value Share (%) and BPS Analysis by Country, 2024 to 2034

Figure 56: Latin America Market Y-o-Y Growth (%) Projections by Country, 2024 to 2034

Figure 57: Latin America Market Value (US$ Million) Analysis by Motor Type, 2019 to 2034

Figure 58: Latin America Market Volume (Units) Analysis by Motor Type, 2019 to 2034

Figure 59: Latin America Market Value Share (%) and BPS Analysis by Motor Type, 2024 to 2034

Figure 60: Latin America Market Y-o-Y Growth (%) Projections by Motor Type, 2024 to 2034

Figure 61: Latin America Market Value (US$ Million) Analysis by Magnetic Material Type, 2019 to 2034

Figure 62: Latin America Market Volume (Units) Analysis by Magnetic Material Type, 2019 to 2034

Figure 63: Latin America Market Value Share (%) and BPS Analysis by Magnetic Material Type, 2024 to 2034

Figure 64: Latin America Market Y-o-Y Growth (%) Projections by Magnetic Material Type, 2024 to 2034

Figure 65: Latin America Market Value (US$ Million) Analysis by End-user Vertical, 2019 to 2034

Figure 66: Latin America Market Volume (Units) Analysis by End-user Vertical, 2019 to 2034

Figure 67: Latin America Market Value Share (%) and BPS Analysis by End-user Vertical, 2024 to 2034

Figure 68: Latin America Market Y-o-Y Growth (%) Projections by End-user Vertical, 2024 to 2034

Figure 69: Latin America Market Attractiveness by Motor Type, 2024 to 2034

Figure 70: Latin America Market Attractiveness by Magnetic Material Type, 2024 to 2034

Figure 71: Latin America Market Attractiveness by End-user Vertical, 2024 to 2034

Figure 72: Latin America Market Attractiveness by Country, 2024 to 2034

Figure 73: Western Europe Market Value (US$ Million) by Motor Type, 2024 to 2034

Figure 74: Western Europe Market Value (US$ Million) by Magnetic Material Type, 2024 to 2034

Figure 75: Western Europe Market Value (US$ Million) by End-user Vertical, 2024 to 2034

Figure 76: Western Europe Market Value (US$ Million) by Country, 2024 to 2034

Figure 77: Western Europe Market Value (US$ Million) Analysis by Country, 2019 to 2034

Figure 78: Western Europe Market Volume (Units) Analysis by Country, 2019 to 2034

Figure 79: Western Europe Market Value Share (%) and BPS Analysis by Country, 2024 to 2034

Figure 80: Western Europe Market Y-o-Y Growth (%) Projections by Country, 2024 to 2034

Figure 81: Western Europe Market Value (US$ Million) Analysis by Motor Type, 2019 to 2034

Figure 82: Western Europe Market Volume (Units) Analysis by Motor Type, 2019 to 2034

Figure 83: Western Europe Market Value Share (%) and BPS Analysis by Motor Type, 2024 to 2034

Figure 84: Western Europe Market Y-o-Y Growth (%) Projections by Motor Type, 2024 to 2034

Figure 85: Western Europe Market Value (US$ Million) Analysis by Magnetic Material Type, 2019 to 2034

Figure 86: Western Europe Market Volume (Units) Analysis by Magnetic Material Type, 2019 to 2034

Figure 87: Western Europe Market Value Share (%) and BPS Analysis by Magnetic Material Type, 2024 to 2034

Figure 88: Western Europe Market Y-o-Y Growth (%) Projections by Magnetic Material Type, 2024 to 2034

Figure 89: Western Europe Market Value (US$ Million) Analysis by End-user Vertical, 2019 to 2034

Figure 90: Western Europe Market Volume (Units) Analysis by End-user Vertical, 2019 to 2034

Figure 91: Western Europe Market Value Share (%) and BPS Analysis by End-user Vertical, 2024 to 2034

Figure 92: Western Europe Market Y-o-Y Growth (%) Projections by End-user Vertical, 2024 to 2034

Figure 93: Western Europe Market Attractiveness by Motor Type, 2024 to 2034

Figure 94: Western Europe Market Attractiveness by Magnetic Material Type, 2024 to 2034

Figure 95: Western Europe Market Attractiveness by End-user Vertical, 2024 to 2034

Figure 96: Western Europe Market Attractiveness by Country, 2024 to 2034

Figure 97: Eastern Europe Market Value (US$ Million) by Motor Type, 2024 to 2034

Figure 98: Eastern Europe Market Value (US$ Million) by Magnetic Material Type, 2024 to 2034

Figure 99: Eastern Europe Market Value (US$ Million) by End-user Vertical, 2024 to 2034

Figure 100: Eastern Europe Market Value (US$ Million) by Country, 2024 to 2034

Figure 101: Eastern Europe Market Value (US$ Million) Analysis by Country, 2019 to 2034

Figure 102: Eastern Europe Market Volume (Units) Analysis by Country, 2019 to 2034

Figure 103: Eastern Europe Market Value Share (%) and BPS Analysis by Country, 2024 to 2034

Figure 104: Eastern Europe Market Y-o-Y Growth (%) Projections by Country, 2024 to 2034

Figure 105: Eastern Europe Market Value (US$ Million) Analysis by Motor Type, 2019 to 2034

Figure 106: Eastern Europe Market Volume (Units) Analysis by Motor Type, 2019 to 2034

Figure 107: Eastern Europe Market Value Share (%) and BPS Analysis by Motor Type, 2024 to 2034

Figure 108: Eastern Europe Market Y-o-Y Growth (%) Projections by Motor Type, 2024 to 2034

Figure 109: Eastern Europe Market Value (US$ Million) Analysis by Magnetic Material Type, 2019 to 2034

Figure 110: Eastern Europe Market Volume (Units) Analysis by Magnetic Material Type, 2019 to 2034

Figure 111: Eastern Europe Market Value Share (%) and BPS Analysis by Magnetic Material Type, 2024 to 2034

Figure 112: Eastern Europe Market Y-o-Y Growth (%) Projections by Magnetic Material Type, 2024 to 2034

Figure 113: Eastern Europe Market Value (US$ Million) Analysis by End-user Vertical, 2019 to 2034

Figure 114: Eastern Europe Market Volume (Units) Analysis by End-user Vertical, 2019 to 2034

Figure 115: Eastern Europe Market Value Share (%) and BPS Analysis by End-user Vertical, 2024 to 2034

Figure 116: Eastern Europe Market Y-o-Y Growth (%) Projections by End-user Vertical, 2024 to 2034

Figure 117: Eastern Europe Market Attractiveness by Motor Type, 2024 to 2034

Figure 118: Eastern Europe Market Attractiveness by Magnetic Material Type, 2024 to 2034

Figure 119: Eastern Europe Market Attractiveness by End-user Vertical, 2024 to 2034

Figure 120: Eastern Europe Market Attractiveness by Country, 2024 to 2034

Figure 121: South Asia and Pacific Market Value (US$ Million) by Motor Type, 2024 to 2034

Figure 122: South Asia and Pacific Market Value (US$ Million) by Magnetic Material Type, 2024 to 2034

Figure 123: South Asia and Pacific Market Value (US$ Million) by End-user Vertical, 2024 to 2034

Figure 124: South Asia and Pacific Market Value (US$ Million) by Country, 2024 to 2034

Figure 125: South Asia and Pacific Market Value (US$ Million) Analysis by Country, 2019 to 2034

Figure 126: South Asia and Pacific Market Volume (Units) Analysis by Country, 2019 to 2034

Figure 127: South Asia and Pacific Market Value Share (%) and BPS Analysis by Country, 2024 to 2034

Figure 128: South Asia and Pacific Market Y-o-Y Growth (%) Projections by Country, 2024 to 2034

Figure 129: South Asia and Pacific Market Value (US$ Million) Analysis by Motor Type, 2019 to 2034

Figure 130: South Asia and Pacific Market Volume (Units) Analysis by Motor Type, 2019 to 2034

Figure 131: South Asia and Pacific Market Value Share (%) and BPS Analysis by Motor Type, 2024 to 2034

Figure 132: South Asia and Pacific Market Y-o-Y Growth (%) Projections by Motor Type, 2024 to 2034

Figure 133: South Asia and Pacific Market Value (US$ Million) Analysis by Magnetic Material Type, 2019 to 2034

Figure 134: South Asia and Pacific Market Volume (Units) Analysis by Magnetic Material Type, 2019 to 2034

Figure 135: South Asia and Pacific Market Value Share (%) and BPS Analysis by Magnetic Material Type, 2024 to 2034

Figure 136: South Asia and Pacific Market Y-o-Y Growth (%) Projections by Magnetic Material Type, 2024 to 2034

Figure 137: South Asia and Pacific Market Value (US$ Million) Analysis by End-user Vertical, 2019 to 2034

Figure 138: South Asia and Pacific Market Volume (Units) Analysis by End-user Vertical, 2019 to 2034

Figure 139: South Asia and Pacific Market Value Share (%) and BPS Analysis by End-user Vertical, 2024 to 2034

Figure 140: South Asia and Pacific Market Y-o-Y Growth (%) Projections by End-user Vertical, 2024 to 2034

Figure 141: South Asia and Pacific Market Attractiveness by Motor Type, 2024 to 2034

Figure 142: South Asia and Pacific Market Attractiveness by Magnetic Material Type, 2024 to 2034

Figure 143: South Asia and Pacific Market Attractiveness by End-user Vertical, 2024 to 2034

Figure 144: South Asia and Pacific Market Attractiveness by Country, 2024 to 2034

Figure 145: East Asia Market Value (US$ Million) by Motor Type, 2024 to 2034

Figure 146: East Asia Market Value (US$ Million) by Magnetic Material Type, 2024 to 2034

Figure 147: East Asia Market Value (US$ Million) by End-user Vertical, 2024 to 2034

Figure 148: East Asia Market Value (US$ Million) by Country, 2024 to 2034

Figure 149: East Asia Market Value (US$ Million) Analysis by Country, 2019 to 2034

Figure 150: East Asia Market Volume (Units) Analysis by Country, 2019 to 2034

Figure 151: East Asia Market Value Share (%) and BPS Analysis by Country, 2024 to 2034

Figure 152: East Asia Market Y-o-Y Growth (%) Projections by Country, 2024 to 2034

Figure 153: East Asia Market Value (US$ Million) Analysis by Motor Type, 2019 to 2034

Figure 154: East Asia Market Volume (Units) Analysis by Motor Type, 2019 to 2034

Figure 155: East Asia Market Value Share (%) and BPS Analysis by Motor Type, 2024 to 2034

Figure 156: East Asia Market Y-o-Y Growth (%) Projections by Motor Type, 2024 to 2034

Figure 157: East Asia Market Value (US$ Million) Analysis by Magnetic Material Type, 2019 to 2034

Figure 158: East Asia Market Volume (Units) Analysis by Magnetic Material Type, 2019 to 2034

Figure 159: East Asia Market Value Share (%) and BPS Analysis by Magnetic Material Type, 2024 to 2034

Figure 160: East Asia Market Y-o-Y Growth (%) Projections by Magnetic Material Type, 2024 to 2034

Figure 161: East Asia Market Value (US$ Million) Analysis by End-user Vertical, 2019 to 2034

Figure 162: East Asia Market Volume (Units) Analysis by End-user Vertical, 2019 to 2034

Figure 163: East Asia Market Value Share (%) and BPS Analysis by End-user Vertical, 2024 to 2034

Figure 164: East Asia Market Y-o-Y Growth (%) Projections by End-user Vertical, 2024 to 2034

Figure 165: East Asia Market Attractiveness by Motor Type, 2024 to 2034

Figure 166: East Asia Market Attractiveness by Magnetic Material Type, 2024 to 2034

Figure 167: East Asia Market Attractiveness by End-user Vertical, 2024 to 2034

Figure 168: East Asia Market Attractiveness by Country, 2024 to 2034

Figure 169: Middle East and Africa Market Value (US$ Million) by Motor Type, 2024 to 2034

Figure 170: Middle East and Africa Market Value (US$ Million) by Magnetic Material Type, 2024 to 2034

Figure 171: Middle East and Africa Market Value (US$ Million) by End-user Vertical, 2024 to 2034

Figure 172: Middle East and Africa Market Value (US$ Million) by Country, 2024 to 2034

Figure 173: Middle East and Africa Market Value (US$ Million) Analysis by Country, 2019 to 2034

Figure 174: Middle East and Africa Market Volume (Units) Analysis by Country, 2019 to 2034

Figure 175: Middle East and Africa Market Value Share (%) and BPS Analysis by Country, 2024 to 2034

Figure 176: Middle East and Africa Market Y-o-Y Growth (%) Projections by Country, 2024 to 2034

Figure 177: Middle East and Africa Market Value (US$ Million) Analysis by Motor Type, 2019 to 2034

Figure 178: Middle East and Africa Market Volume (Units) Analysis by Motor Type, 2019 to 2034

Figure 179: Middle East and Africa Market Value Share (%) and BPS Analysis by Motor Type, 2024 to 2034

Figure 180: Middle East and Africa Market Y-o-Y Growth (%) Projections by Motor Type, 2024 to 2034

Figure 181: Middle East and Africa Market Value (US$ Million) Analysis by Magnetic Material Type, 2019 to 2034

Figure 182: Middle East and Africa Market Volume (Units) Analysis by Magnetic Material Type, 2019 to 2034

Figure 183: Middle East and Africa Market Value Share (%) and BPS Analysis by Magnetic Material Type, 2024 to 2034

Figure 184: Middle East and Africa Market Y-o-Y Growth (%) Projections by Magnetic Material Type, 2024 to 2034

Figure 185: Middle East and Africa Market Value (US$ Million) Analysis by End-user Vertical, 2019 to 2034

Figure 186: Middle East and Africa Market Volume (Units) Analysis by End-user Vertical, 2019 to 2034

Figure 187: Middle East and Africa Market Value Share (%) and BPS Analysis by End-user Vertical, 2024 to 2034

Figure 188: Middle East and Africa Market Y-o-Y Growth (%) Projections by End-user Vertical, 2024 to 2034

Figure 189: Middle East and Africa Market Attractiveness by Motor Type, 2024 to 2034

Figure 190: Middle East and Africa Market Attractiveness by Magnetic Material Type, 2024 to 2034

Figure 191: Middle East and Africa Market Attractiveness by End-user Vertical, 2024 to 2034

Figure 192: Middle East and Africa Market Attractiveness by Country, 2024 to 2034

Frequently Asked Questions

How much is the Permanent Magnet Motor Market currently worth?

The global permanent magnet motor market is expected to be worth USD 49.20 billion by 2024.

What is the sales forecast for Permanent Magnet Motors through 2034?

The market for permanent magnet motors is expected to reach USD 132 billion by 2034.

At what rate is the Permanent Magnet Motor Market growing across the world?

The permanent magnet motor industry is expanding at a CAGR of 10.40% from 2024 to 2034.

Who are the key manufacturing companies for Permanent Magnet Motors?

ABB Limited, Rockwell Automation, Siemens AG, Franklin Electric Company Inc., and Allied Motion Technologies Inc. are some of the major players in the market.

What was the overall global value of the Permanent Magnet Motor Market in 2023?

The global valuation for the permanent magnet motor market in 2023 was USD 43.90 billion.

Explore Electrification Components Insights

Future Market Insights

Permanent Magnet Motor Market