
- Market Size (2026)
- USD 309.0 Mn
- Forecast (2036)
- USD 569.3 Mn
- CAGR (2026 to 2036)
- 6.3%
PET Preform Inspection Systems Market Summary
The PET preform inspection systems market is valued at USD 309.0 million in 2026 and is projected to reach USD 569.3 million by 2036, growing at a 6.3% CAGR as per FMI research.
The global PET preform inspection systems market was valued at USD 290.7 million in 2025 and is estimated to reach USD 309.0 million in 2026. Growing at 6.3% CAGR between 2026-2036, the market is anticipated to reach USD 569.3 million by 2036. As per FMI research, inline production inspection is likely to account for leading share, worth 67.0% of total revenue in 2026. Suppliers already rate inspection at line speed, with INTRAVIS listing its PreWatcher Inline at up to 72,000 objects per hour on 8 cameras [1]. SACMI presented its PVS Robot at K 2025, where a SCARA robot and an automated format magazine let preforms from different presses be inspected without manual format changes [2]. Bottle weight is falling at the same time, and FMI notes that beverage fillers are tightening preform quality checks as bottle weight reduction increases the risk of line rejects [3].
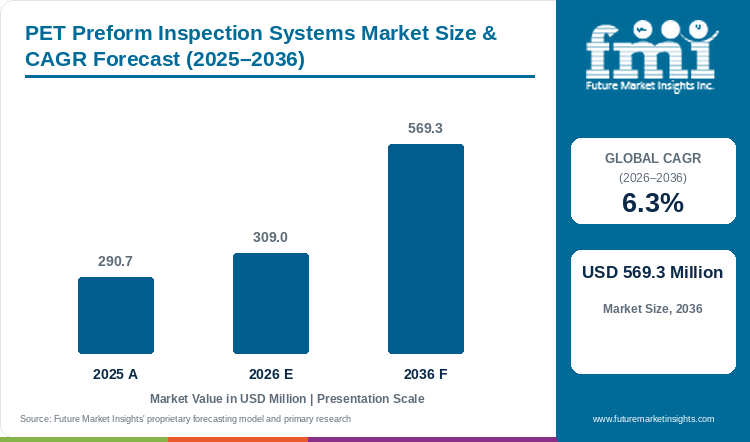
Table 1: Market Size and Forecast for the PET Preform Inspection Systems Market (USD Million), 2025 to 2036
| Market size and forecast | Value |
|---|---|
| 2025 market size | USD 290.7 million |
| Estimated market size in 2026 | USD 309.0 million |
| Projected market size by 2036 | USD 569.3 million |
| CAGR (2026 to 2036) | 6.3% |
| Added revenue, 2026 to 2036 | USD 260.3 million |
Key Market Trends & Insights
- By deployment: Inline production inspection is likely to hold leading share of the PET preform inspection systems market in 2026, representing 67.0% of total market revenue.
- By end use: Beverage preforms are likely to lead with a market share of 76.0% in 2026.
- By inspection technology: Multi-view camera systems are set to hold sway, accounting for 65.0% of the market in 2026.
Regional Highlights
- Fastest-growing countries: China and India are expected to record the highest growth rate of all profiled markets, each with a projected CAGR of 6.6% between 2026 and 2036.
- Growth across other countries: Brazil is projected to expand at a CAGR of 6.4%, followed by the USA at 6.3%. Germany, France and Japan are each set to grow at 6.2% CAGR, and the UK at 6.1%.
Inspection speed follows the production line it serves. INTRAVIS rates PreWatcher Inline at up to 72,000 objects per hour on 8 cameras and its PreMon monitoring system at up to 128,000 per hour on 5 cameras [1]. PreMon is placed directly after injection moulding and reports contamination, discolouration and geometric defects for immediate production-quality feedback [4]. Pressco Technology rates Intellispec at up to 2,500 per minute, with thread measurement at operator-defined points to 0.03 mm, and IMD lists its IMDvista PECO V3 at up to 90,000 preforms per hour [1].
Off-line inspection follows a different logic. SACMI presented the PVS Robot at K 2025 as a follow-up to the PVS002, rated at up to 1,200 pieces per hour without weighing [2]. For existing plants, SACMI’s CVS OneCam embedded vision system targets low-complexity applications and revamps, with recipe changeovers that do not stop the line [2].
The value of inspection rises with the volume it protects. Preforms feed PET bottles production, which FMI sizes at USD 48.0 billion in 2026 with a 3.8% CAGR through 2036 [5], and FMI puts the PET preform market at USD 18.3 billion in 2026 [3]. Filling-end demand adds to that base, with FMI projecting bottled water at about USD 320 billion in 2026 and a 5.0% CAGR to 2036 [6]. Passing inspection does not remove every risk. BMT reported in August 2026 that preforms within specification on dimensional, weight and polarised-light tests can still heat and stretch differently, and that one manufacturer with a problematic material batch needed six visits from a process technician in two months, against six in the whole of the previous year [7].
Table 2: Supporting Industry Indicators for the PET Preform Inspection Systems Market (mixed units), 2025 to 2026, mixed years
| Indicator | Metric | Why it matters | Source |
|---|---|---|---|
| Inline rating | INTRAVIS PreWatcher Inline is rated at up to 72,000 objects per hour on 8 cameras. | Sets the throughput that inline screening has to match. | PETplanet Insider, Market Survey 05/2025, 14 May 2025 [1] |
| Post-moulding monitoring | INTRAVIS PreMon is rated at up to 128,000 objects per hour on 5 cameras and detects contamination, discolouration and geometric defects. | Placing inspection directly after injection moulding shortens the feedback loop to the mould. | PETplanet Insider, Market Survey 05/2025, 14 May 2025 [1]; PETnology, INTRAVIS at K 2025, 19 August 2025 [4] |
| Off-line rating | INTRAVIS PreWatcher Offline is rated at up to 100,000 objects per hour on 18 cameras, and Sample-PreWatcher at up to 1,200 per hour with weight check. | Camera count and speed differ by deployment type. | PETplanet Insider, Market Survey 05/2025, 14 May 2025 [1] |
| Thread measurement | Pressco Technology’s Intellispec is rated at up to 2,500 per minute and measures the thread at operator-defined points to 0.03 mm. | Measurement precision sets the tolerance a buyer can specify on the thread. | PETplanet Insider, Market Survey 05/2025, 14 May 2025 [1] |
| Robotic off-line cell | SACMI’s PVS Robot is rated at up to 1,200 pieces per hour without weighing and uses a SCARA robot with an automated format warehouse. | Preforms from different presses are inspected without manual format changes. | smart-molding, SACMI at K 2025, 22 October 2025 [2] |
| Embedded vision | SACMI’s CVS OneCam detects contamination, colour and profile variations and structural defects, with recipe changeovers that do not stop the line. | A compact option for revamping existing plants. | smart-molding, SACMI at K 2025, 22 October 2025 [2] |
| Preform variability | BMT reports that preforms within specification on dimensional, weight and polarised-light tests can still heat and stretch differently. | Inspection scope has to match the decision it supports. | PETnology, BMT preform analysis, 4 August 2026 [7] |
| Bottle market | FMI sizes the PET bottles market at USD 48.0 billion in 2026 with a 3.8% CAGR through 2036. | Preform inspection protects bottle production. | Future Market Insights, PET Bottles Market [5] |
| Preform market | FMI sizes the PET preform market at USD 18.3 billion in 2026 with a 4.4% CAGR, and beverage at 60.0% of application sales. | Sets the preform volume base that inspection serves. | Future Market Insights, PET Preform Market [3] |
| Imaging category | FMI projects the machine vision market at USD 11.57 billion in 2026 with an 8.1% CAGR through 2036. | Imaging hardware and software supply the sensing layer. | Future Market Insights, Machine Vision Market [8] |
| Brazil resin output | Brazil produced 807 thousand tonnes of virgin PET resin in 2025, with revenue of R$ 10.3 billion. | Resin output indicates the preform volume that Brazilian lines process. | ABIPET, press release, 28 April 2026 [9] |
| Japan bottle shipments | Japan shipped 26.7 billion PET bottles weighing 595,000 tonnes in fiscal 2023, with a lightweighting rate of 28.4%. | Lighter bottles narrow the tolerance for preform defects. | Plastic Waste Management Institute, 2024 PET Bottle Recycling Annual Report, 15 January 2025 [10] |
Demand Intensity Analysis
Demand scales with line speed and the number of views per preform, not only with preform count. INTRAVIS rates PreWatcher Inline at 72,000 objects per hour, which is 20 per second, on 8 cameras, or 9,000 objects per camera per hour. It rates PreMon at 128,000 per hour on 5 cameras, or 25,600 per camera [1]. A robotic off-line cell at 1,200 per hour covers 1.7% of the 72,000 per hour inline rate [2], so off-line units serve sampling and inline units serve full-flow screening. On the revenue side, FMI’s 2026 estimate of USD 309.0 million is about 1.7% of FMI’s USD 18.3 billion estimate for the PET preform market [3]. Bottle weight sets the tolerance. Japan’s 26.7 billion bottles shipped in fiscal 2023 weighed 595,000 tonnes, an average of about 22.3 g, and the lightweighting rate stood at 28.4% [10].
Table 3: Demand Intensity Metrics for the PET Preform Inspection Systems Market (mixed units; specifications 2025, revenue 2026, bottle shipments fiscal 2023),
| Demand intensity metric | Value | Basis |
|---|---|---|
| Inline throughput | 72,000 objects per hour, or 20 per second | PETplanet Insider, Market Survey 05/2025, 14 May 2025 [1] |
| Objects per camera, inline system | 9,000 per hour on 8 cameras | PETplanet Insider, Market Survey 05/2025, 14 May 2025 [1] |
| Objects per camera, PreMon | 25,600 per hour on 5 cameras at 128,000 per hour | PETplanet Insider, Market Survey 05/2025, 14 May 2025 [1] |
| Pressco Intellispec rating | 2,500 per minute, or 150,000 per hour | PETplanet Insider, Market Survey 05/2025, 14 May 2025 [1] |
| Robotic off-line cell against inline rate | 1,200 per hour against 72,000 per hour, a ratio of 1.7% | smart-molding, SACMI at K 2025, 22 October 2025 [2]; PETplanet Insider, Market Survey 05/2025, 14 May 2025 [1] |
| Inline production inspection revenue, 2026 | USD 207.0 million, against USD 102.0 million for other deployments | FMI estimate: 67.0% and 33.0% of USD 309.0 million |
| Beverage preform revenue, 2026 | USD 234.8 million, against USD 74.2 million for other end uses | FMI estimate: 76.0% and 24.0% of USD 309.0 million |
| Multi-view camera system revenue, 2026 | USD 200.9 million, against USD 108.2 million for other technologies | FMI estimate: 65.0% and 35.0% of USD 309.0 million |
| Inspection systems revenue against PET preform market, 2026 | About 1.7% | FMI 2026 estimates of USD 309.0 million and USD 18.3 billion, Future Market Insights, PET Preform Market [3] |
| Average PET bottle weight, Japan, fiscal 2023 | About 22.3 g, from 595,000 tonnes across 26.7 billion bottles | Plastic Waste Management Institute, 2024 PET Bottle Recycling Annual Report, 15 January 2025 [10] |
| Systems needed for Japan’s bottle volume | About 42 inline systems at 72,000 per hour running 8,760 hours a year, for 26.7 billion bottles | PETplanet Insider, Market Survey 05/2025, 14 May 2025 [1]; Plastic Waste Management Institute, 15 January 2025 [10] |
Country Comparison
China and India lead at 6.6%, while the other six countries sit within 0.3 points of each other, from 6.1% for the UK to 6.4% for Brazil. The spread across the eight countries is 0.5 percentage points. The production base behind each rate differs. Brazil produced 807 thousand tonnes of virgin PET resin in 2025 [9], and Japan shipped 26.7 billion PET bottles in fiscal 2023 [10]. Brazil’s rate is 0.2 points above Japan’s, so volume alone does not separate the two.
Analyst Perspective
“The investment case improves when inspection helps the plant find the cause of a repeated defect. Rejecting bad preforms is useful. Connecting those rejects with a cavity or process condition can make the system more valuable to production managers.”
- Nandini Roy Choudhury, Principal Analyst at Future Market Insights
How is the PET Preform Inspection Systems Market segmented?
The market is segmented by deployment, end use, inspection technology, and region. Inline production inspection is projected at 67.0%, beverage preforms at 76.0%, and multi-view camera systems at 65.0% in 2026.
- By deployment: inline production inspection, offline sampling inspection, and laboratory inspection.
- By end use: beverage preforms, food-container preforms, and personal-care and other preforms.
- By inspection technology: multi-view camera systems, combined optical and dimensional systems, and single-view specialist systems.
- By region: North America, Latin America, Europe, East Asia, South Asia and Pacific, and Middle East and Africa.
Why does Inline Production Inspection lead the Deployment category?
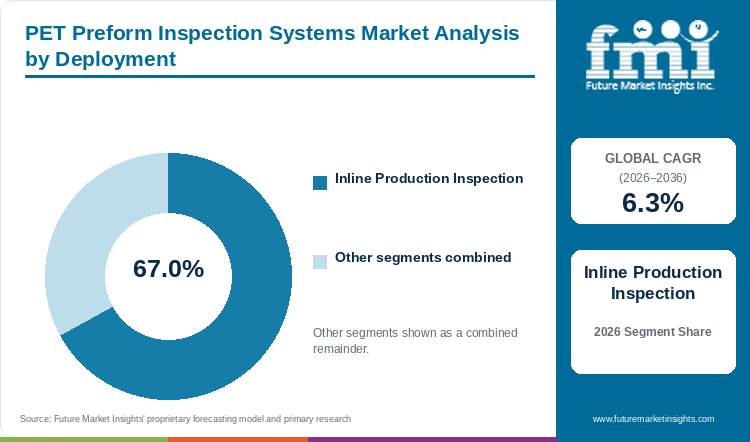
Based on deployment, inline production inspection is projected to account for 67.0% in 2026, driven by checking every preform within the production flow.
Inline screening has to present each preform and remove a rejected item without disturbing adjacent parts. INTRAVIS rates PreWatcher Inline at up to 72,000 objects per hour [1], and Pressco Technology rates Intellispec at up to 2,500 per minute [1]. Fit with the surrounding Packaging Machinery determines whether checking can continue at those speeds. PreMon’s position directly after injection moulding gives immediate production-quality feedback to the moulding step [4].
- Full-flow checking is expected to keep inline systems as the larger deployment [1].
- Detection quality is anticipated to be judged at the customer’s operating speed.
Why do Beverage Preforms lead the End Use category?
By end use, beverage preforms are projected to account for 76.0% in 2026, supported by large bottle runs and cavity-level process feedback.
Beverage preforms feed large bottle runs, so a repeated cavity defect can create substantial downstream waste. FMI puts beverage at 60.0% of PET preform application sales in 2026 and notes that beverage fillers are tightening preform quality checks as bottle weight reduction increases the risk of line rejects [3]. ABIPET reports that PET holds more than 70% of soft drink packaging and more than 95% of mineral water packaging in Brazil [9]. Inspection records can direct correction at the upstream Injection Molding Machine operation, and cavity number is among the parameters INTRAVIS lists for its preform systems [1].
- Large bottle runs are expected to keep beverage preforms ahead of other end uses [3].
- Tracing repeated defects to a mould cavity is anticipated to direct corrective work before a large bottle run [1].
Why do Multi-View Camera Systems lead the Inspection Technology category?
By inspection technology, multi-view camera systems are projected to account for 65.0% in 2026, driven by the need to view threads, bodies and gates in one handling cycle.
Threads, bodies and gates need different views of the preform, and a multi-camera arrangement can cover these regions within the same handling cycle. INTRAVIS lists 17 cameras on PreWatcher Offline, 8 on PreWatcher Inline and 5 on PreMon [1]. Pressco Technology’s Intellispec measures the thread at several points defined by the operator, down to 0.03 mm [1]. In each case illumination and consistent part orientation determine whether the views reveal the intended defects.
- Several views per preform are expected to keep multi-view camera systems as the larger technology [1].
- More cameras do not automatically improve the result if illumination and part presentation are unsuitable.
What are the drivers, restraints, and opportunities in the PET Preform Inspection Systems Market?
The key driver is early defect detection, the restraint is part presentation and hidden variability, and cavity-level feedback provides the opportunity.
- Driver: Screening can keep recurring moulding defects from consuming downstream bottle-making capacity.
- Restraint: Unstable presentation, poorly tuned acceptance limits, and variability that passes standard tests may slow purchases.
- Opportunity: Connecting defect patterns with cavity information is creating demand beyond simple rejection.
Early Defect Detection Protects Downstream Capacity
A preform may carry a sealing or body defect before it reaches the blowing stage, and detecting that condition earlier changes where waste is removed. INTRAVIS’s PreMon sits directly after injection moulding and gives immediate production-quality feedback [4]. Fillers are tightening preform quality checks as bottle weight reduction raises the risk of line rejects [3]. Rising checks per preform are expected to drive the PET preform inspection systems market growth.
Part Presentation and Hidden Variability Limit Practical Value
The system must present each part consistently to the camera or measurement station, and variation in orientation can create both missed defects and false rejects. Passing inspection also does not guarantee blowing performance. BMT reported that variations introduced during injection moulding changed the thermal behaviour of preforms that met specification, which caused inconsistent blowing [7]. Throughput separates the workflows as well: SACMI rates its PVS002C at up to 1,100 preforms per hour and its PVS156A at up to 1,200, against up to 36,000 for the PVS10L [1]. Presentation limits and inspection scope may slow purchases and hamper the PET preform inspection systems market growth.
Cavity-Level Feedback and Machine Vision Open New Opportunities
Cavity identification gives production managers a way to locate repeated defects. INTRAVIS lists cavity number among the parameters its preform systems read [1], and its IntraVisualizer software centralizes quality data for trend monitoring, deviation analysis and maintenance intervals [4]. Machine Vision supplies the imaging layer, which FMI projects at USD 11.57 billion in 2026 with an 8.1% CAGR through 2036 [8]. SACMI’s CVS OneCam adds a low-complexity option for existing plants [2]. These functions connect rejects with moulding decisions, which is expected to create demand beyond simple rejection.
Which country CAGRs are profiled in the PET Preform Inspection Systems Market?
Table 4: Country CAGRs for the PET Preform Inspection Systems Market (%), 2026 to 2036
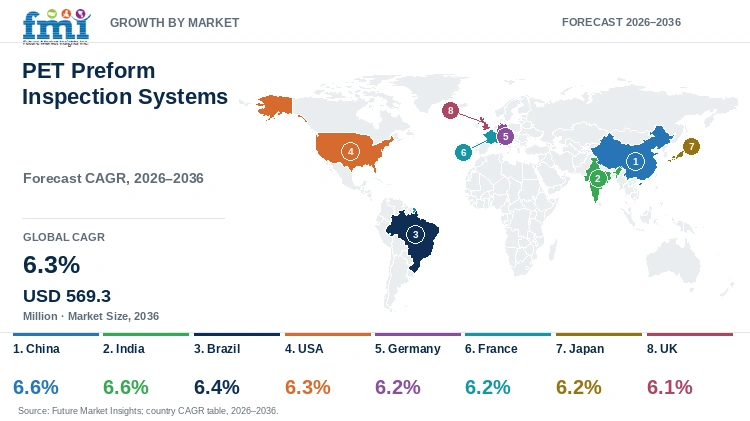
| Country | CAGR |
|---|---|
| China | 6.6% |
| India | 6.6% |
| Brazil | 6.4% |
| USA | 6.3% |
| Germany | 6.2% |
| France | 6.2% |
| Japan | 6.2% |
| UK | 6.1% |
Country-wise Analysis
- China: The PET preform inspection systems market in China is projected to grow at a 6.6% CAGR through 2036. Large beverage and packaging operations provide opportunities for automated inspection equipment. China exported 341.8 million kg of plastic bottles under HS 392330 in 2024. Preform manufacturers handling different bottle sizes need inspection equipment that can accommodate frequent format changes. SACMI's PVS Robot addresses this requirement through an automated format magazine. The system helps operators change between preform formats without extensive manual adjustments. Recording defects by mould cavity can also help maintenance teams identify recurring problems and correct them before more defective preforms are produced.
- India: Catching defective preforms before they enter the bottle-blowing process can reduce material waste and unnecessary production costs. This is particularly relevant for India's expanding bottled beverage and rigid packaging industries. The PET preform inspection systems market is expected to grow at a 6.6% CAGR through 2036. New production lines provide opportunities to install automated inspection equipment from the beginning. Existing manufacturers may also invest in these systems when manual checks become insufficient for their operating volumes. Equipment cost and maintenance requirements will influence purchasing decisions. Plants producing large quantities of preforms are more likely to recover their investment through lower rejection rates and reduced downstream waste.
- Brazil: PET accounts for more than 70% of soft drink packaging and over 95% of mineral water packaging in Brazil. Domestic virgin PET resin production reached 807 thousand tonnes in 2025. These figures indicate the importance of PET packaging to the country's beverage industry. Demand for preform inspection systems is projected to increase at a 6.4% CAGR through 2036. Manufacturers using high-volume preform lines can benefit from identifying defects before the parts reach bottle-blowing equipment. However, reliable maintenance support is important when plants change moulds or production formats. Suppliers able to provide local servicing and assistance with equipment adjustments may find more opportunities among established packaging manufacturers.
- USA: Beverage manufacturers in the United States are paying attention to the quality of recycled PET used in packaging. Imports accounted for 23.0% of the country's recycled PET supply in 2024. Preform inspection equipment can help manufacturers identify visual and dimensional defects during production. Repeated defects from the same mould cavity may indicate a problem that requires maintenance rather than the rejection of individual preforms alone. The US PET preform inspection systems market is forecast to grow at a 6.3% CAGR through 2036. Some demand will come from manufacturers replacing older inspection systems. Other purchases will involve adding automated checks to existing production lines as quality requirements change.
- Germany: Germany's PET preform inspection systems market is expected to expand at a 6.2% CAGR through 2036. European recycled-content requirements are adding to the quality considerations faced by beverage packaging manufacturers. Preform producers need to maintain consistent dimensions and identify visual defects before the bottle-blowing stage. Inspection systems that record recurring defects can help production teams identify problems with particular mould cavities. This information is useful when adjusting moulding equipment or planning maintenance. German manufacturers may therefore invest in better inspection capabilities even when they are not adding new production lines. Equipment upgrades can improve the quality checks already in place at established facilities.
- France: Under the EU Single-Use Plastics Directive, PET beverage bottles must contain at least 25% recycled plastic from 2025. Manufacturers in France must meet this requirement while maintaining the quality of finished bottles. The PET preform inspection systems market is projected to grow at a 6.2% CAGR through 2036. Camera-based equipment needs consistent lighting and preform positioning to identify defects accurately. Poor positioning can affect inspection results and lead to unnecessary rejection of acceptable preforms. Packaging manufacturers will therefore need systems that remain reliable throughout long production runs. Equipment suppliers offering accurate inspection and dependable handling systems can benefit from quality-related investments at existing plants.
- Japan: Japan shipped 26.7 billion PET bottles weighing approximately 595,000 tonnes in fiscal 2023. The country's PET bottle lightweighting rate reached 28.4% during the same period. Producing lighter bottles places greater importance on controlling preform weight and dimensions. Variations during moulding can affect the finished bottle and create problems during subsequent processing. The Japanese PET preform inspection systems market is forecast to grow at a 6.2% CAGR through 2036. Inline inspection can identify visible defects during production while laboratory measurements provide more detailed checks where needed. Manufacturers working with lightweight bottle designs may require both methods to maintain consistent product quality.
- UK: The PET preform inspection systems market in the UK is projected to grow at a 6.1% CAGR through 2036. Deposit-return preparations and imported rigid packaging form part of the country's changing beverage packaging market. For domestic preform manufacturers, inspection equipment must continue working accurately when production moves between different bottle formats. A change in preform size can require adjustments to the handling equipment and camera settings. Poorly adjusted systems may reject acceptable parts or allow defects to pass through. Manufacturers upgrading older production lines will need dependable technical support during these changes. Equipment suppliers that can provide servicing and help operators identify recurring faults may benefit from replacement and upgrade orders.
Who are the notable companies in the PET Preform Inspection Systems Market?
INTRAVIS, Pressco Technology, SACMI, and IMD are the companies with preform inspection products profiled in this market.
PET preform inspection systems market includes camera-based full-flow system suppliers and robotic off-line system suppliers. INTRAVIS lists PreWatcher Offline, PreWatcher Inline, Sample-PreWatcher and PreMon systems [1]. Pressco Technology lists Intellispec [1], IMD lists IMDvista PECO V3 and PECO LUX [1], and SACMI lists the PVS Robot [2].
- INTRAVIS: PreWatcher Offline, PreWatcher Inline, Sample-PreWatcher and PreMon systems covering geometry, contamination, short shots, colour, thread area, sealing surface, gate and dome, and cavity number [1].
- Pressco Technology: Intellispec preform inspection at up to 2,500 preforms per minute, with thread measurement to 0.03 mm [1].
- SACMI: PVS Robot for automated off-line inspection at up to 1,200 preforms per hour without weighing [2].
- IMD: IMDvista PECO V3 rated at up to 90,000 preforms per hour, and PECO LUX matched to injection moulding machine speed [1].
Competitive Benchmarking: PET Preform Inspection Systems Market
Table 5: Competitive Benchmarking for the PET Preform Inspection Systems Market (product listings), 2025 to 2026, mixed years
| Company | Inspection product | Positioning | Rated speed | Source |
|---|---|---|---|---|
| INTRAVIS | PreWatcher Offline, PreWatcher Inline, Sample-PreWatcher, PreMon | Inline, off-line, sampling and post-moulding monitoring | Up to 128,000 objects per hour (PreMon) | PETplanet Insider, Market Survey 05/2025, 14 May 2025 [1] |
| Pressco Technology | Intellispec | Preform inspection with operator-defined thread measurement to 0.03 mm | Up to 2,500 per minute | PETplanet Insider, Market Survey 05/2025, 14 May 2025 [1] |
| SACMI | PVS Robot, PVS10L, PVS002C, PVS156A, PVS003 | Robotic off-line inspection and higher-speed PVS series | p to 1,200 per hour (PVS Robot); up to 36,000 per hour (PVS10L) | smart-molding, SACMI at K 2025, 22 October 2025 [2]; PETplanet Insider, Market Survey 05/2025, 14 May 2025 [1] |
| IMD | IMDvista PECO V3, PECO LUX | Preform inspection, with PECO LUX matched to moulding machine speed | Up to 90,000 per hour (PECO V3) | PETplanet Insider, Market Survey 05/2025, 14 May 2025 [1] |
Key Developments in the PET Preform Inspection Systems Market
- In October 2025, SACMI presented the PVS Robot at K 2025 in Düsseldorf, combining a SCARA robot with an automated format warehouse so that preforms from different presses can be inspected without manual format changes [2].
- In October 2025, SACMI presented the CVS OneCam embedded vision system at K 2025 for low-complexity inspection and plant revamps, with recipe changeovers that do not stop the line [2].
- In August 2025, INTRAVIS announced that it would show PreMon, a high-volume preform monitoring system placed directly after injection moulding, with Sipa at K 2025 [4].
Key Players in the PET Preform Inspection Systems Market
Camera-Based Full-Flow System Suppliers
- INTRAVIS
- Pressco Technology
- IMD
Robotic Off-Line System Suppliers
- SACMI
PET Preform Inspection Systems Market - Report Scope
Table 6: Report Scope for the PET Preform Inspection Systems Market (descriptive), 2025 to 2036
| Coverage field | Report scope |
|---|---|
| Market breakdown | Deployment, end use, inspection technology, and region |
| Quantitative units | USD million |
| Market definition | Dedicated optical or dimensional systems used to inspect PET preforms before bottle or container conversion, including control-system revenue. Preform moulding machines and finished-bottle inspection sold as a separate system are excluded. |
| Regions covered | North America, Latin America, Europe, East Asia, South Asia and Pacific, Middle East and Africa |
| Countries covered | China, India, Brazil, USA, Germany, France, Japan, UK |
| Key companies profiled | INTRAVIS, Pressco Technology, SACMI, IMD |
| Forecast period | 2026 to 2036 |
| Approach | Secondary research with market modelling |
PET Preform Inspection Systems Market - Research Methodology
Table 7: Research Methodology for the PET Preform Inspection Systems Market (descriptive), 2025 to 2036
| Method | Approach |
|---|---|
| Desk Research | Desk research includes trade-press reports, manufacturer product information, association reports, FMI market pages, and company announcements. |
| Market Sizing and Forecasting | Market values and segment shares are FMI estimates. The 2025 base of USD 290.7 million is rolled forward at a 6.3% CAGR to USD 569.3 million in 2036. Country growth rates are FMI estimates. |
| Technical Evidence | Supplier specifications, trade-press reports, and product announcements show what preform inspection systems must do. Commercial implications are FMI analysis. |
| Competitive Assessment | Companies are included where public information lists a preform inspection product. |
| Data Validation | Specification and production figures are cross-checked against published manufacturer and association documents. |
PET Preform Inspection Systems Market by Segments
PET Preform Inspection Systems Market segmented by Deployment:
- Inline Production Inspection
- Offline Sampling Inspection
- Laboratory Inspection
PET Preform Inspection Systems Market segmented by End Use:
- Beverage Preforms
- Food-Container Preforms
- Personal-Care and Other Preforms
PET Preform Inspection Systems Market segmented by Inspection Technology:
- Multi-View Camera Systems
- Combined Optical and Dimensional Systems
- Single-View Specialist Systems
PET Preform Inspection Systems Market by Region
- North America
- United States
- Canada
- Latin America
- Brazil
- Mexico
- Rest of Latin America
- Europe
- Germany
- United Kingdom
- France
- Italy
- Rest of Europe
- East Asia
- China
- Japan
- South Korea
- South Asia and Pacific
- India
- Australia
- Rest of South Asia and Pacific
- Middle East and Africa
- GCC Countries
- South Africa
- Rest of Middle East and Africa
Research Sources and Bibliography
- [1] PETplanet Insider: Market Survey 05/2025: Preform production and inspection (14 May 2025)
- [2] smart-molding: SACMI at K 2025: PVS Robot preform inspection and CVS OneCam (22 October 2025)
- [3] Packaging Europe: Where is Europe’s PET industry at in 2025? (18 February 2025)
- [4] PETnology: K 2025: INTRAVIS showcases intelligent inspection systems for preforms, medical applications and in-mold labels (19 August 2025)
- [5] PETnology: BMT analysis reveals why PET preforms that pass inspection can still fail on the bottle line (4 August 2026)
- [6] ABIPET: Setor de embalagens PET consolida crescimento, press release distributed by PR Newswire (28 April 2026)
- [7] Plastic Waste Management Institute: 2024 PET Bottle Recycling Annual Report, as reported by Zenbird Media (15 January 2025)
This Report Answers
- How large is the PET Preform Inspection Systems Market in 2026 and what value is forecast for 2036?
- Why does inline production inspection hold the larger share of deployment?
- How do beverage preforms influence inspection demand?
- Why do multi-view camera systems lead inspection technology?
- Which countries have the highest growth outlook?
- Which companies list preform inspection products?
Table of Content
- Key Takeaways
- Market Size and CAGR
- Top Growth Driver
- Fastest Growing Segment
- Leading Region
- Key Companies
- Emerging Opportunities
- Executive Summary
- Global Market Outlook
- Demand-side Trends
- Supply-side Trends
- Technology Roadmap Analysis
- Analysis and Recommendations
- Analyst Perspective (What is happening? Why now? What should investors know?)
- Key Questions Answered
- How large is the market?
- What is the CAGR?
- What are key trends?
- Which region dominates?
- Who are the leaders?
Read More...
- Market Overview
- Market Coverage / Taxonomy
- Market Definition / Scope / Limitations
- Research Methodology
- Chapter Orientation
- Analytical Lens and Working Hypotheses
- Market Structure, Signals, and Trend Drivers
- Benchmarking and Cross-market Comparability
- Market Sizing, Forecasting, and Opportunity Mapping
- Research Design and Evidence Framework
- Desk Research Programme (Secondary Evidence)
- Expert Input and Fieldwork (Primary Evidence)
- Tooling, Models, and Reference Databases
- Data Engineering and Model Build
- Quality Assurance and Audit Trail
- Market Background
- Market Dynamics (Drivers, Restraints, Opportunity, Trends)
- Scenario Forecast (Optimistic, Likely, Conservative)
- Impact Analysis
- AI Impact
- Sustainability Impact
- Regulatory Impact
- Technology Impact
- Consumer / Buyer Analysis
- Purchase Drivers
- Adoption Barriers
- Buyer Journey
- Opportunity Map Analysis
- Product Life Cycle Analysis
- Supply Chain Analysis
- Investment Feasibility Matrix
- Value Chain Analysis
- PESTLE and Porter's Analysis
- Regulatory Landscape
- Regional Parent Market Outlook
- Production and Consumption Statistics
- Import and Export Statistics
- Global Market Analysis and Forecast, 2021 to 2036
- Historical Market Size Value (USD Million) Analysis, 2021 to 2025
- Current and Future Market Size Value (USD Million) Projections, 2026 to 2036
- Y-o-Y Growth Trend Analysis
- Absolute $ Opportunity Analysis
- Global Market Pricing Analysis, 2021 to 2036
- Global Market Analysis and Forecast, By Deployment, 2021 to 2036
- Introduction / Key Findings
- Historical Market Size Value (USD Million) Analysis By Deployment, 2021 to 2025
- Current and Future Market Size Value (USD Million) Analysis and Forecast By Deployment, 2026 to 2036
- Inline Production Inspection
- Offline Sampling Inspection
- Laboratory Inspection
- Y-o-Y Growth Trend Analysis By Deployment, 2021 to 2025
- Absolute $ Opportunity Analysis By Deployment, 2026 to 2036
- Global Market Analysis and Forecast, By End Use, 2021 to 2036
- Introduction / Key Findings
- Historical Market Size Value (USD Million) Analysis By End Use, 2021 to 2025
- Current and Future Market Size Value (USD Million) Analysis and Forecast By End Use, 2026 to 2036
- Beverage Preforms
- Food-Container Preforms
- Personal-Care and Other Preforms
- Y-o-Y Growth Trend Analysis By End Use, 2021 to 2025
- Absolute $ Opportunity Analysis By End Use, 2026 to 2036
- Global Market Analysis and Forecast, By Inspection Technology, 2021 to 2036
- Introduction / Key Findings
- Historical Market Size Value (USD Million) Analysis By Inspection Technology, 2021 to 2025
- Current and Future Market Size Value (USD Million) Analysis and Forecast By Inspection Technology, 2026 to 2036
- Multi-View Camera Systems
- Combined Optical and Dimensional Systems
- Single-View Specialist Systems
- Y-o-Y Growth Trend Analysis By Inspection Technology, 2021 to 2025
- Absolute $ Opportunity Analysis By Inspection Technology, 2026 to 2036
- Global Market Analysis and Forecast, By Region, 2021 to 2036
- Introduction
- Historical Market Size Value (USD Million) Analysis By Region, 2021 to 2025
- Current Market Size Value (USD Million) Analysis and Forecast By Region, 2026 to 2036
- North America
- Latin America
- Europe
- East Asia
- South Asia and Pacific
- Middle East and Africa
- Market Attractiveness Analysis By Region
- North America Market Analysis and Forecast, By Country, 2021 to 2036
- Historical Market Size Value (USD Million) Trend Analysis By Market Taxonomy, 2021 to 2025
- Market Size Value (USD Million) Forecast By Market Taxonomy, 2026 to 2036
- By Country
- United States
- Canada
- By Deployment
- By End Use
- By Inspection Technology
- By Country
- Market Attractiveness Analysis
- By Country
- By Deployment
- By End Use
- By Inspection Technology
- Key Takeaways
- Latin America Market Analysis and Forecast, By Country
- Historical Market Size Value (USD Million) Trend Analysis By Market Taxonomy, 2021 to 2025
- Market Size Value (USD Million) Forecast By Market Taxonomy, 2026 to 2036
- By Country
- Brazil
- Mexico
- Rest of Latin America
- By Deployment
- By End Use
- By Inspection Technology
- By Country
- Market Attractiveness Analysis
- By Country
- By Deployment
- By End Use
- By Inspection Technology
- Key Takeaways
- Europe Market Analysis and Forecast, By Country
- Historical Market Size Value (USD Million) Trend Analysis By Market Taxonomy, 2021 to 2025
- Market Size Value (USD Million) Forecast By Market Taxonomy, 2026 to 2036
- By Country
- Germany
- United Kingdom
- France
- Italy
- Rest of Europe
- By Deployment
- By End Use
- By Inspection Technology
- By Country
- Market Attractiveness Analysis
- By Country
- By Deployment
- By End Use
- By Inspection Technology
- Key Takeaways
- East Asia Market Analysis and Forecast, By Country
- Historical Market Size Value (USD Million) Trend Analysis By Market Taxonomy, 2021 to 2025
- Market Size Value (USD Million) Forecast By Market Taxonomy, 2026 to 2036
- By Country
- China
- Japan
- South Korea
- By Deployment
- By End Use
- By Inspection Technology
- By Country
- Market Attractiveness Analysis
- By Country
- By Deployment
- By End Use
- By Inspection Technology
- Key Takeaways
- South Asia and Pacific Market Analysis and Forecast, By Country
- Historical Market Size Value (USD Million) Trend Analysis By Market Taxonomy, 2021 to 2025
- Market Size Value (USD Million) Forecast By Market Taxonomy, 2026 to 2036
- By Country
- India
- Australia
- Rest of South Asia and Pacific
- By Deployment
- By End Use
- By Inspection Technology
- By Country
- Market Attractiveness Analysis
- By Country
- By Deployment
- By End Use
- By Inspection Technology
- Key Takeaways
- Middle East and Africa Market Analysis and Forecast, By Country
- Historical Market Size Value (USD Million) Trend Analysis By Market Taxonomy, 2021 to 2025
- Market Size Value (USD Million) Forecast By Market Taxonomy, 2026 to 2036
- By Country
- GCC Countries
- South Africa
- Rest of Middle East and Africa
- By Deployment
- By End Use
- By Inspection Technology
- By Country
- Market Attractiveness Analysis
- By Country
- By Deployment
- By End Use
- By Inspection Technology
- Key Takeaways
- Key Countries Market Analysis
- United States
- Pricing Analysis
- Market Share Analysis, 2025
- By Deployment
- By End Use
- By Inspection Technology
- Canada
- Pricing Analysis
- Market Share Analysis, 2025
- By Deployment
- By End Use
- By Inspection Technology
- Mexico
- Pricing Analysis
- Market Share Analysis, 2025
- By Deployment
- By End Use
- By Inspection Technology
- Brazil
- Pricing Analysis
- Market Share Analysis, 2025
- By Deployment
- By End Use
- By Inspection Technology
- Germany
- Pricing Analysis
- Market Share Analysis, 2025
- By Deployment
- By End Use
- By Inspection Technology
- United Kingdom
- Pricing Analysis
- Market Share Analysis, 2025
- By Deployment
- By End Use
- By Inspection Technology
- Italy
- Pricing Analysis
- Market Share Analysis, 2025
- By Deployment
- By End Use
- By Inspection Technology
- France
- Pricing Analysis
- Market Share Analysis, 2025
- By Deployment
- By End Use
- By Inspection Technology
- India
- Pricing Analysis
- Market Share Analysis, 2025
- By Deployment
- By End Use
- By Inspection Technology
- China
- Pricing Analysis
- Market Share Analysis, 2025
- By Deployment
- By End Use
- By Inspection Technology
- Japan
- Pricing Analysis
- Market Share Analysis, 2025
- By Deployment
- By End Use
- By Inspection Technology
- South Korea
- Pricing Analysis
- Market Share Analysis, 2025
- By Deployment
- By End Use
- By Inspection Technology
- South Africa
- Pricing Analysis
- Market Share Analysis, 2025
- By Deployment
- By End Use
- By Inspection Technology
- United States
- Market Structure Analysis
- Competition Dashboard
- Competition Benchmarking
- Market Share Analysis of Top Players
- By Regional
- By Deployment
- By End Use
- By Inspection Technology
- Emerging Startups
- Innovation Benchmarking
- Competition Analysis
- Competition Deep Dive
- INTRAVIS
- Overview
- Product Portfolio
- Profitability by Market Segments
- Sales Footprint
- Strategy Overview
- Marketing Strategy
- Product Strategy
- Channel Strategy
- Pressco Technology
- SACMI
- IMD
- INTRAVIS
- Case Studies
- Success Stories
- Recent Developments
- Competition Deep Dive
- Assumptions & Acronyms Used
List of Tables
- Table 1: Global Market Value (USD Million) Forecast by Region, 2021 to 2036
- Table 2: Global Market Value (USD Million) Forecast by Deployment, 2021 to 2036
- Table 3: Global Market Value (USD Million) Forecast by End Use, 2021 to 2036
- Table 4: Global Market Value (USD Million) Forecast by Inspection Technology, 2021 to 2036
- Table 5: North America Market Value (USD Million) Forecast by Country, 2021 to 2036
- Table 6: North America Market Value (USD Million) Forecast by Deployment, 2021 to 2036
- Table 7: North America Market Value (USD Million) Forecast by End Use, 2021 to 2036
- Table 8: North America Market Value (USD Million) Forecast by Inspection Technology, 2021 to 2036
- Table 9: Latin America Market Value (USD Million) Forecast by Country, 2021 to 2036
- Table 10: Latin America Market Value (USD Million) Forecast by Deployment, 2021 to 2036
- Table 11: Latin America Market Value (USD Million) Forecast by End Use, 2021 to 2036
- Table 12: Latin America Market Value (USD Million) Forecast by Inspection Technology, 2021 to 2036
- Table 13: Europe Market Value (USD Million) Forecast by Country, 2021 to 2036
- Table 14: Europe Market Value (USD Million) Forecast by Deployment, 2021 to 2036
- Table 15: Europe Market Value (USD Million) Forecast by End Use, 2021 to 2036
- Table 16: Europe Market Value (USD Million) Forecast by Inspection Technology, 2021 to 2036
- Table 17: East Asia Market Value (USD Million) Forecast by Country, 2021 to 2036
- Table 18: East Asia Market Value (USD Million) Forecast by Deployment, 2021 to 2036
- Table 19: East Asia Market Value (USD Million) Forecast by End Use, 2021 to 2036
- Table 20: East Asia Market Value (USD Million) Forecast by Inspection Technology, 2021 to 2036
- Table 21: South Asia and Pacific Market Value (USD Million) Forecast by Country, 2021 to 2036
- Table 22: South Asia and Pacific Market Value (USD Million) Forecast by Deployment, 2021 to 2036
- Table 23: South Asia and Pacific Market Value (USD Million) Forecast by End Use, 2021 to 2036
- Table 24: South Asia and Pacific Market Value (USD Million) Forecast by Inspection Technology, 2021 to 2036
- Table 25: Middle East and Africa Market Value (USD Million) Forecast by Country, 2021 to 2036
- Table 26: Middle East and Africa Market Value (USD Million) Forecast by Deployment, 2021 to 2036
- Table 27: Middle East and Africa Market Value (USD Million) Forecast by End Use, 2021 to 2036
- Table 28: Middle East and Africa Market Value (USD Million) Forecast by Inspection Technology, 2021 to 2036
List of Figures
- Figure 1: Global Market Pricing Analysis
- Figure 2: Global Market Value (USD Million) Forecast 2021-2036
- Figure 3: Global Market Value Share and BPS Analysis by Deployment, 2026 and 2036
- Figure 4: Global Market Y-o-Y Growth Comparison by Deployment, 2026-2036
- Figure 5: Global Market Attractiveness Analysis by Deployment
- Figure 6: Global Market Value Share and BPS Analysis by End Use, 2026 and 2036
- Figure 7: Global Market Y-o-Y Growth Comparison by End Use, 2026-2036
- Figure 8: Global Market Attractiveness Analysis by End Use
- Figure 9: Global Market Value Share and BPS Analysis by Inspection Technology, 2026 and 2036
- Figure 10: Global Market Y-o-Y Growth Comparison by Inspection Technology, 2026-2036
- Figure 11: Global Market Attractiveness Analysis by Inspection Technology
- Figure 12: Global Market Value (USD Million) Share and BPS Analysis by Region, 2026 and 2036
- Figure 13: Global Market Y-o-Y Growth Comparison by Region, 2026-2036
- Figure 14: Global Market Attractiveness Analysis by Region
- Figure 15: North America Market Incremental Dollar Opportunity, 2026-2036
- Figure 16: Latin America Market Incremental Dollar Opportunity, 2026-2036
- Figure 17: Europe Market Incremental Dollar Opportunity, 2026-2036
- Figure 18: East Asia Market Incremental Dollar Opportunity, 2026-2036
- Figure 19: South Asia and Pacific Market Incremental Dollar Opportunity, 2026-2036
- Figure 20: Middle East and Africa Market Incremental Dollar Opportunity, 2026-2036
- Figure 21: North America Market Value Share and BPS Analysis by Country, 2026 and 2036
- Figure 22: North America Market Value Share and BPS Analysis by Deployment, 2026 and 2036
- Figure 23: North America Market Y-o-Y Growth Comparison by Deployment, 2026-2036
- Figure 24: North America Market Attractiveness Analysis by Deployment
- Figure 25: North America Market Value Share and BPS Analysis by End Use, 2026 and 2036
- Figure 26: North America Market Y-o-Y Growth Comparison by End Use, 2026-2036
- Figure 27: North America Market Attractiveness Analysis by End Use
- Figure 28: North America Market Value Share and BPS Analysis by Inspection Technology, 2026 and 2036
- Figure 29: North America Market Y-o-Y Growth Comparison by Inspection Technology, 2026-2036
- Figure 30: North America Market Attractiveness Analysis by Inspection Technology
- Figure 31: Latin America Market Value Share and BPS Analysis by Country, 2026 and 2036
- Figure 32: Latin America Market Value Share and BPS Analysis by Deployment, 2026 and 2036
- Figure 33: Latin America Market Y-o-Y Growth Comparison by Deployment, 2026-2036
- Figure 34: Latin America Market Attractiveness Analysis by Deployment
- Figure 35: Latin America Market Value Share and BPS Analysis by End Use, 2026 and 2036
- Figure 36: Latin America Market Y-o-Y Growth Comparison by End Use, 2026-2036
- Figure 37: Latin America Market Attractiveness Analysis by End Use
- Figure 38: Latin America Market Value Share and BPS Analysis by Inspection Technology, 2026 and 2036
- Figure 39: Latin America Market Y-o-Y Growth Comparison by Inspection Technology, 2026-2036
- Figure 40: Latin America Market Attractiveness Analysis by Inspection Technology
- Figure 41: Europe Market Value Share and BPS Analysis by Country, 2026 and 2036
- Figure 42: Europe Market Value Share and BPS Analysis by Deployment, 2026 and 2036
- Figure 43: Europe Market Y-o-Y Growth Comparison by Deployment, 2026-2036
- Figure 44: Europe Market Attractiveness Analysis by Deployment
- Figure 45: Europe Market Value Share and BPS Analysis by End Use, 2026 and 2036
- Figure 46: Europe Market Y-o-Y Growth Comparison by End Use, 2026-2036
- Figure 47: Europe Market Attractiveness Analysis by End Use
- Figure 48: Europe Market Value Share and BPS Analysis by Inspection Technology, 2026 and 2036
- Figure 49: Europe Market Y-o-Y Growth Comparison by Inspection Technology, 2026-2036
- Figure 50: Europe Market Attractiveness Analysis by Inspection Technology
- Figure 51: East Asia Market Value Share and BPS Analysis by Country, 2026 and 2036
- Figure 52: East Asia Market Value Share and BPS Analysis by Deployment, 2026 and 2036
- Figure 53: East Asia Market Y-o-Y Growth Comparison by Deployment, 2026-2036
- Figure 54: East Asia Market Attractiveness Analysis by Deployment
- Figure 55: East Asia Market Value Share and BPS Analysis by End Use, 2026 and 2036
- Figure 56: East Asia Market Y-o-Y Growth Comparison by End Use, 2026-2036
- Figure 57: East Asia Market Attractiveness Analysis by End Use
- Figure 58: East Asia Market Value Share and BPS Analysis by Inspection Technology, 2026 and 2036
- Figure 59: East Asia Market Y-o-Y Growth Comparison by Inspection Technology, 2026-2036
- Figure 60: East Asia Market Attractiveness Analysis by Inspection Technology
- Figure 61: South Asia and Pacific Market Value Share and BPS Analysis by Country, 2026 and 2036
- Figure 62: South Asia and Pacific Market Value Share and BPS Analysis by Deployment, 2026 and 2036
- Figure 63: South Asia and Pacific Market Y-o-Y Growth Comparison by Deployment, 2026-2036
- Figure 64: South Asia and Pacific Market Attractiveness Analysis by Deployment
- Figure 65: South Asia and Pacific Market Value Share and BPS Analysis by End Use, 2026 and 2036
- Figure 66: South Asia and Pacific Market Y-o-Y Growth Comparison by End Use, 2026-2036
- Figure 67: South Asia and Pacific Market Attractiveness Analysis by End Use
- Figure 68: South Asia and Pacific Market Value Share and BPS Analysis by Inspection Technology, 2026 and 2036
- Figure 69: South Asia and Pacific Market Y-o-Y Growth Comparison by Inspection Technology, 2026-2036
- Figure 70: South Asia and Pacific Market Attractiveness Analysis by Inspection Technology
- Figure 71: Middle East and Africa Market Value Share and BPS Analysis by Country, 2026 and 2036
- Figure 72: Middle East and Africa Market Value Share and BPS Analysis by Deployment, 2026 and 2036
- Figure 73: Middle East and Africa Market Y-o-Y Growth Comparison by Deployment, 2026-2036
- Figure 74: Middle East and Africa Market Attractiveness Analysis by Deployment
- Figure 75: Middle East and Africa Market Value Share and BPS Analysis by End Use, 2026 and 2036
- Figure 76: Middle East and Africa Market Y-o-Y Growth Comparison by End Use, 2026-2036
- Figure 77: Middle East and Africa Market Attractiveness Analysis by End Use
- Figure 78: Middle East and Africa Market Value Share and BPS Analysis by Inspection Technology, 2026 and 2036
- Figure 79: Middle East and Africa Market Y-o-Y Growth Comparison by Inspection Technology, 2026-2036
- Figure 80: Middle East and Africa Market Attractiveness Analysis by Inspection Technology
- Figure 81: Global Market - Tier Structure Analysis
- Figure 82: Global Market - Company Share Analysis
Frequently Asked Questions
How large is the PET Preform Inspection Systems Market expected to be in 2026?
Future Market Insights estimates that the PET preform inspection systems market will reach USD 309.0 million in 2026. The market is projected to expand further and reach USD 569.3 million by 2036.
What CAGR is forecast for the PET Preform Inspection Systems Market through 2036?
As per FMI, the PET preform inspection systems market is projected to grow at a 6.3% CAGR from 2026 to 2036. Growth is supported by early defect detection and cavity-level feedback.
Which deployment holds a notable share of the PET preform inspection systems market in 2026?
Future Market Insights projects inline production inspection to hold 67.0% of deployment revenue in 2026. The segment benefits from continuous part flow.
Which end use holds a notable share in 2026?
FMI finds that beverage preforms will hold 76.0% of end-use revenue in 2026. Large bottle runs make a repeated cavity defect costly.
Which countries have a notable expansion outlook?
Future Market Insights predicts China and India to expand at a 6.6% CAGR during the 2026 to 2036 assessment period. Brazil follows at 6.4%.
Which companies are active in the PET Preform Inspection Systems Market during 2026?
As per FMI analysis, companies with preform inspection products include INTRAVIS, Pressco Technology, SACMI, and IMD. Their products differ in rated speed, camera count, and deployment.
Preview the report firsthand - request a free sample
Get SampleGet the brochure for pricing and purchase details.
Get PDF
