

- Market Size (2026)
- USD 178.9 Mn
- Forecast (2036)
- USD 531.4 Mn
- CAGR (2026 to 2036)
- 11.5%
How big is Photonic Interconnect Field Diagnostics Services Market in 2026?
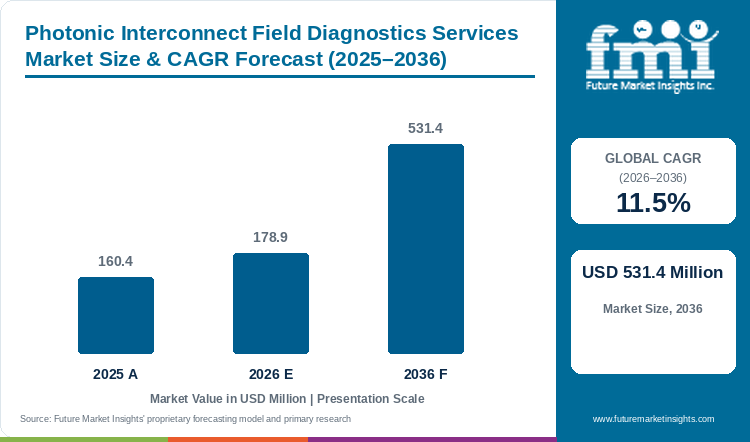
The market was valued at USD 160.4 Million in 2025 and is expected to reach USD 178.9 Million in 2026, with growth at an 11.5% CAGR from 2026 to 2036 taking its value to USD 531.4 Million by 2036.
Field diagnostics establishes whether an installed optical path is ready for acceptance or helps locate the cause of a failure after it enters use. Contamination, component damage and faults appearing only under traffic require different corrective work, so technicians need access to the path and a reliable association between each reading, fiber and port. A traceable result can avoid unnecessary replacements and repeated investigation by teams responsible for different parts of the link, while commissioning records provide a baseline for later maintenance. Assignments follow rack and fabric readiness: Japan’s operating ABCI 3.0 environment presents different access conditions from South Korea’s computing-center procurement process. Providers therefore need to connect measurement with repair and retesting against the customer’s agreed requirements. Service revenue comes from that contracted field work, with announced computing capacity providing project context rather than a measure of completed assignments. [5]
Key Market Trends & Insights
- 800G holds 38.0% of link speed in 2026, with technicians reviewing the installed architecture and thresholds rather than assuming a 400G procedure remains sufficient.
- Commissioning & certification holds 28.0% of service type in 2026, requiring identifiable acceptance evidence beyond the presence of light on the path.
- Inter-rack / scale-out holds 36.0% of deployment location in 2026, reflecting the many optical paths carrying communication between racks in a scale-out fabric.
- Hyperscale AI data centers account for 48.0% of data center type in 2026, where a defective path can delay network release for otherwise ready computing resources.
Regional Highlights
- UAE has the highest profiled CAGR at 13.0% during 2026–2036.
- The next two profiled growth rates are South Korea at 12.7% and Japan at 12.4% over the same period.
Market Size & Forecast
| Metric | Value |
|---|---|
| 2025 market value | USD 160.4 Million |
| 2026 market estimate | USD 178.9 Million |
| 2036 market forecast | USD 531.4 Million |
| Forecast CAGR, 2026–2036 | 11.5% |
The market covers contracted field services for optical-link commissioning, diagnostics, interoperability checks, cleaning, inspection and managed optical operations in the specified AI infrastructure settings. Standalone test instruments and unrelated network services are excluded.
Field optical diagnostics can affect utilization of data-center power indirectly when a network fault leaves energized accelerator capacity unable to complete useful work.
Infrastructure readiness and acceptance
| Documented operating context | Source |
|---|---|
| EXFO announced a test solution for fiber-dense data centers in February 2025. | [1] |
| VIAVI introduced an 800G transport module for the OneAdvisor 800 field tester in March 2025. | [2] |
| IEEE’s 802.3df project defines the standards context for 800 Gb/s Ethernet. | [3] |
| IEC 61300-3-35 addresses visual inspection of fiber-optic connectors and transceivers. | [4] |
Analyst Perspective
A useful optical service follows the installed path from inspection to an identified repair and repeat test, preserving fiber and port identity throughout. That record gives the operator a baseline for later maintenance and makes a failed measurement actionable when several contractors or equipment suppliers share responsibility for the network.
- Sudip Saha, Principal Analyst at Future Market Insights
How is the photonic interconnect field diagnostics services market segmented?
Link Speed covers 800G, 400G, 1.6T and 3.2T and above. Service Type covers Commissioning & certification, Link diagnostics, Reliability / interoperability testing, Cleaning & inspection and Managed optical operations. Deployment Location covers Inter-rack / scale-out, Intra-rack / scale-up, Spine-leaf fabric and Campus / DCI. Data Center Type covers Hyperscale AI data centers, Colocation AI facilities, Enterprise AI/HPC and Research / sovereign compute. Route to Market covers OEM direct, Network system integrators, Fiber/cabling specialists and Test & managed-service providers.
Integration with data-center infrastructure management helps connect a measured fiber defect to the physical asset record and the affected service.
Why does 800G lead link speed demand?
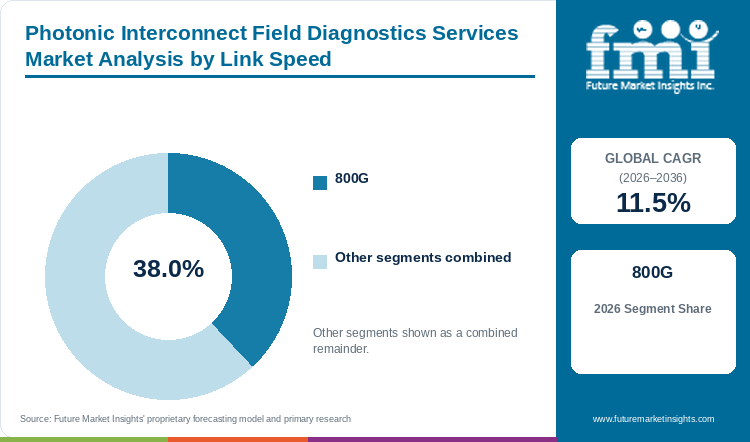
800G: 38.0% of link speed in 2026.
An 800G designation leaves the technician to identify the lane arrangement, transceiver and fiber combination before selecting a field method. Parts of a 400G process may remain useful, although acceptance thresholds and adapters need review against the installed architecture. Emerging 1.6T interfaces add tool and qualification questions, while 3.2T and above depends more on future deployment choices; for current work, the advantage comes from matching a traceable measurement setup to the actual path.
- The 800G segment accounts for 38.0% of link speed in 2026.
- A field procedure should identify the installed optical architecture before the technician selects measurement settings or interprets a failed result.
Why does Commissioning & certification lead service type demand?
Commissioning & certification: 28.0% of service type in 2026.
Commissioning provides a documented starting point for an optical path through agreed loss and polarity results attached to identifiable fibers and ports. A failure must lead to assigned repair and retesting so the operator receives a usable baseline for distinguishing later faults from conditions present at handover. Cleaning, inspection and interoperability checks answer related but different questions, making a clear scope useful for understanding what acceptance has demonstrated and what still requires investigation.
- The Commissioning & certification segment accounts for 28.0% of service type in 2026.
- Short measurement cycles are useful only when technicians preserve fiber identity and apply the same reference method throughout the job.
What are the drivers, restraints, and opportunities in the photonic interconnect field diagnostics services market?
Higher link speeds increase the value of field diagnosis
An optical defect can prevent an otherwise ready GPU cluster from carrying useful traffic. Operators therefore need physical-path checks before network acceptance and a reliable diagnosis when faults appear later. The service is paid work on the installed network rather than a test-instrument sale. Providers that can repeat measurements consistently across dense fiber routes reduce uncertainty during handover. They also help owners avoid trial-and-error replacement of expensive components. The practical demand comes from restoring or accepting a usable link with the least necessary disruption to the surrounding installation.
Connector condition and test ambiguity complicate repairs
A field method needs to account for access to dense installed fibers, with adapters and technician training affecting cost as connector styles vary. Inconsistent references can make teams disagree about the same link, while inspection alone leaves some live-performance questions unanswered. A scope defining the measurements and escalation point gives the result a repair purpose instead of leading to repeated visits without a decision.
Traceable workflows improve multi-vendor troubleshooting
Retained certification results can show what changed after handover, particularly when several contractors have modified different parts of an optical route. Linking that history to the asset inventory helps a failed measurement reach the responsible repair team, provided records remain usable across technicians and instruments. Reproducibility and path identity therefore need to be preserved as faster measurement workflows are introduced.
Optical diagnosis is adjacent to AI infrastructure commissioning, with a narrower focus on identifying faults after or during the acceptance process.
Which country and market CAGRs are profiled for photonic interconnect field diagnostics services?
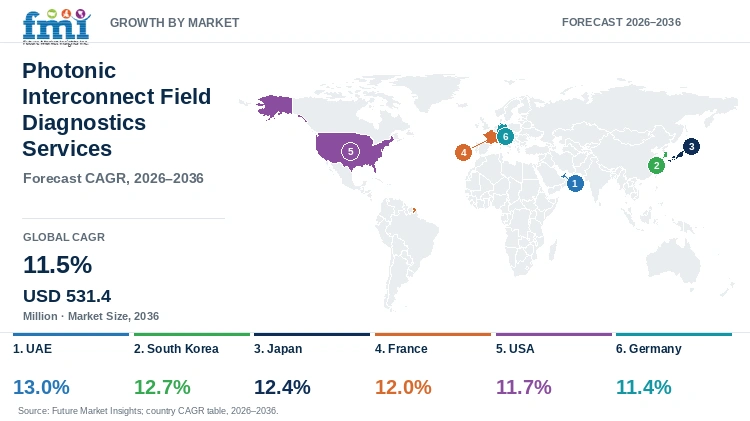
| Country | CAGR |
|---|---|
| UAE | 13.0% |
| South Korea | 12.7% |
| Japan | 12.4% |
| France | 12.0% |
| USA | 11.7% |
| Germany | 11.4% |
Country-wise Analysis
UAE
- Prospective UAE projects such as Stargate UAE may create phased optical-acceptance assignments as racks and switches become ready, with fiber routes sometimes crossing construction packages. Agreed access and responsibility help technicians direct contamination, damage or configuration findings to the correct party. The UAE has the fastest profiled forecast, at a 13.0% CAGR from 2026 to 2036, with service work dependent on those installation milestones.
South Korea
- South Korea’s national computing-center procurement affects when contractors can enter the site and what the integrator must provide for acceptance. Records need to follow physical fiber routes and retain the settings required to repeat a measurement, especially where delivery and operation sit with separate parties. This contracting context accompanies the country’s 12.7% CAGR forecast for 2026 to 2036.
Japan
- Japan’s ABCI 3.0 offers an operating research-compute setting where changes must fit workload schedules and maintenance windows. Dense campus fiber also calls for clear escalation between passive cabling and active equipment, allowing the operator to arrange corrective work without restarting the investigation with each team. Japan is forecast to grow at a 12.4% CAGR from 2026 to 2036 within this field-service context.
France
- French field assignments can involve either acceptance of a completed link or investigation of reduced performance, making channel identity important throughout inspection and retesting. A record of what changed between failed and passing results helps installers and equipment suppliers resolve shared responsibility. Consistent reporting across sites therefore belongs alongside instrument capability when buyers assess providers within France’s 12.0% CAGR forecast for 2026 to 2036.
USA
- American expansion programs create assignments as individual sites reach equipment and power milestones, requiring methods that different technicians can reproduce. Separating a passive-path fault from transceiver or live-network behavior makes the result useful to the relevant repair team while limiting disruption to neighboring links. The USA’s 11.7% CAGR forecast for 2026 to 2036 reflects service demand tied to that acceptance and restoration work.
Germany
- Scheduled workloads and controlled maintenance windows shape optical work in German research and HPC installations, where a diagnostic record may also support a warranty discussion. Preserving connector condition and measurement settings gives the buyer a reproducible basis for assigning corrective work across contractors. Germany is forecast to grow at an 11.4% CAGR from 2026 to 2036, with refresh schedules and support contracts determining when field access is required.
Who are the notable companies in the photonic interconnect field diagnostics services market?
EXFO; VIAVI Solutions; AFL; Fluke Networks; VeEX
Instrument manufacturers and field-service teams contribute different parts of optical fault diagnosis. The buyer needs a method that moves from measurement to an identified repair rather than stopping at a failed reading. Portable capability matters alongside technician access and a record that the network team can use.
Competitive Benchmarking: Photonic Interconnect Field Diagnostics Services Market
| Participant | Commercial focus | Buyer qualification priority |
|---|---|---|
| EXFO | Optical field-test platforms and support | Repeatable loss measurement and records |
| VIAVI Solutions | Optical and transport test platforms | Multi-fiber and high-speed test coverage |
| AFL | Fiber inspection and test solutions | Connector workflow and field usability |
| Fluke Networks | Cabling certification systems | Traceable acceptance results |
| VeEX | Network and optical test equipment | Protocol support and field troubleshooting |
Key Developments in the Photonic Interconnect Field Diagnostics Services Market
- EXFO announced a test solution for fiber-dense data centers in February 2025. [1]
- VIAVI introduced an 800G transport module for the OneAdvisor 800 field tester in March 2025. [2]
Key Players in the Photonic Interconnect Field Diagnostics Services Market
- EXFO
- VIAVI Solutions
- AFL
- Fluke Networks
- VeEX
Photonic Interconnect Field Diagnostics Services Market - Report Scope
| Coverage field | Report scope |
|---|---|
| Market breakdown | Link Speed; Service Type; Deployment Location; Data Center Type; Route to Market; Region |
| Quantitative unit | USD Million |
| Market definition | The market covers contracted field services for optical-link commissioning, diagnostics, interoperability checks, cleaning, inspection and managed optical operations in the specified AI infrastructure settings. Standalone test instruments and unrelated network services are excluded. |
| Regions covered | North America; Latin America; Western Europe; Eastern Europe; East Asia; South Asia and Pacific; Middle East and Africa |
| Countries / markets profiled | UAE; South Korea; Japan; France; USA; Germany |
| Key companies profiled | EXFO; VIAVI Solutions; AFL; Fluke Networks; VeEX |
| Base year / forecast period | 2026 / 2026–2036 |
| Estimate coverage | 2025 and 2026 market estimates; 2036 forecast; segment shares and country / market CAGRs. |
Photonic Interconnect Field Diagnostics Services Market - Research Methodology
| Method | Application |
|---|---|
| Market definition | The analysis follows the stated product or service boundary and distinguishes direct category revenue from adjacent activities. |
| Secondary research | Official technical, regulatory, research and company publications provide the documented operating context and recent developments cited in this report. |
| Forecast and segmentation | Market estimates, segment shares and geographic forecasts are presented as analytical estimates within the stated commercial scope. |
| Competitive assessment | Participants are compared by their relevant products or services, commercial role and buyer qualification requirements. |
| Interpretation | The assessment considers purchasing conditions and the scope of the documented product, service or performance claim. |
Photonic Interconnect Field Diagnostics Services Market by Segments
Link Speed
- 800G
- 400G
- 1.6T
- 3.2T and above
Service Type
- Commissioning & certification
- Link diagnostics
- Reliability / interoperability testing
- Cleaning & inspection
- Managed optical operations
Deployment Location
- Inter-rack / scale-out
- Intra-rack / scale-up
- Spine-leaf fabric
- Campus / DCI
Data Center Type
- Hyperscale AI data centers
- Colocation AI facilities
- Enterprise AI/HPC
- Research / sovereign compute
Route to Market
- OEM direct
- Network system integrators
- Fiber/cabling specialists
- Test & managed-service providers
Photonic Interconnect Field Diagnostics Services Market by Region
- North America
- United States
- Canada
- Latin America
- Brazil
- Mexico
- Argentina
- Chile
- Western Europe
- Germany
- France
- United Kingdom
- Italy
- Spain
- Benelux
- Nordics
- Eastern Europe
- Poland
- Czech Republic
- Romania
- Hungary
- East Asia
- China
- Japan
- South Korea
- South Asia and Pacific
- India
- ASEAN
- Australia and New Zealand
- Middle East and Africa
- GCC Countries
- South Africa
- Türkiye
- Israel
Research Sources and Bibliography
- [1] EXFO. (2025, February 3). EXFO Responds to AI-driven Usage Demands on Fiber-dense Data Centers with Innovative Test Solution.
- [2] VIAVI Solutions. (2025, March 18). VIAVI Adds 800G Module to OneAdvisor 800 Family of Field Testers.
- [3] IEEE 802.3 Ethernet Working Group. (2024, February 20). IEEE P802.3df 400 Gb/s and 800 Gb/s Ethernet Task Force.
- [4] International Electrotechnical Commission. (2022, September 16). IEC 61300-3-35:2022: Visual Inspection of Fibre Optic Connectors and Fibre-stub Transceivers.
- [5] Future Market Insights. (2026). Photonic Interconnect Field Diagnostics Services Market: Global industry analysis and opportunity assessment, 2026–2036.
This Report Answers
- How large is the photonic interconnect field diagnostics services market in 2026?
- What value and CAGR are forecast through 2036?
- Which link speed segment leads in 2026?
- Which service type segment has the largest share?
- Which profiled country or market has the fastest forecast growth?
- Which participants are covered in the competitive assessment?
Frequently Asked Questions
How large is the photonic interconnect field diagnostics services market in 2026?
The market was valued at USD 160.4 Million in 2025 and is expected to reach USD 178.9 Million in 2026.
What value and CAGR are forecast through 2036?
The market is projected to reach USD 531.4 Million by 2036, with an 11.5% CAGR during 2026–2036.
Which link speed segment leads in 2026?
The 800G segment accounts for 38.0% of link speed in 2026.
Which service type segment has the largest share?
The Commissioning & certification segment accounts for 28.0% of service type in 2026.
Which profiled country or market has the fastest forecast growth?
UAE has the highest profiled CAGR at 13.0% during 2026–2036.
Which participants are covered in the competitive assessment?
The assessment covers EXFO, VIAVI Solutions, AFL, Fluke Networks and VeEX.
Preview the report firsthand - request a free sample
Get SampleGet the brochure for pricing and purchase details.
Get PDFTable of Content
- Key Takeaways
- Market Size and CAGR
- Top Growth Driver
- Fastest Growing Segment
- Leading Region
- Key Companies
- Emerging Opportunities
- Executive Summary
- Global Market Outlook
- Demand-side Trends
- Supply-side Trends
- Technology Roadmap Analysis
- Analysis and Recommendations
- Analyst Perspective (What is happening? Why now? What should investors know?)
- Key Questions Answered
- How large is the market?
- What is the CAGR?
- What are key trends?
- Which region dominates?
- Who are the leaders?
- Market Overview
- Market Coverage / Taxonomy
- Market Definition / Scope / Limitations
- Research Methodology
- Chapter Orientation
- Analytical Lens and Working Hypotheses
- Market Structure, Signals, and Trend Drivers
- Benchmarking and Cross-market Comparability
- Market Sizing, Forecasting, and Opportunity Mapping
- Research Design and Evidence Framework
- Desk Research Programme (Secondary Evidence)
- Expert Input and Fieldwork (Primary Evidence)
- Tooling, Models, and Reference Databases
- Data Engineering and Model Build
- Quality Assurance and Audit Trail
- Market Background
- Market Dynamics (Drivers, Restraints, Opportunity, Trends)
- Scenario Forecast (Optimistic, Likely, Conservative)
- Impact Analysis
- AI Impact
- Sustainability Impact
- Regulatory Impact
- Technology Impact
- Consumer / Buyer Analysis
- Purchase Drivers
- Adoption Barriers
- Buyer Journey
- Opportunity Map Analysis
- Product Life Cycle Analysis
- Supply Chain Analysis
- Investment Feasibility Matrix
- Value Chain Analysis
- PESTLE and Porter's Analysis
- Regulatory Landscape
- Regional Parent Market Outlook
- Production and Consumption Statistics
- Import and Export Statistics
- Global Market Analysis and Forecast, 2021 to 2036
- Historical Market Size Value (USD Million) Analysis, 2021 to 2025
- Current and Future Market Size Value (USD Million) Projections, 2026 to 2036
- Y-o-Y Growth Trend Analysis
- Absolute $ Opportunity Analysis
- Global Market Pricing Analysis, 2021 to 2036
- Global Market Analysis and Forecast, By Link Speed, 2021 to 2036
- Introduction / Key Findings
- Historical Market Size Value (USD Million) Analysis By Link Speed, 2021 to 2025
- Current and Future Market Size Value (USD Million) Analysis and Forecast By Link Speed, 2026 to 2036
- 800G
- 400G
- 1.6T
- 3.2T and above
- Y-o-Y Growth Trend Analysis By Link Speed, 2021 to 2025
- Absolute $ Opportunity Analysis By Link Speed, 2026 to 2036
- Global Market Analysis and Forecast, By Service Type, 2021 to 2036
- Introduction / Key Findings
- Historical Market Size Value (USD Million) Analysis By Service Type, 2021 to 2025
- Current and Future Market Size Value (USD Million) Analysis and Forecast By Service Type, 2026 to 2036
- Commissioning & certification
- Link diagnostics
- Reliability / interoperability testing
- Cleaning & inspection
- Managed optical operations
- Y-o-Y Growth Trend Analysis By Service Type, 2021 to 2025
- Absolute $ Opportunity Analysis By Service Type, 2026 to 2036
- Global Market Analysis and Forecast, By Deployment Location, 2021 to 2036
- Introduction / Key Findings
- Historical Market Size Value (USD Million) Analysis By Deployment Location, 2021 to 2025
- Current and Future Market Size Value (USD Million) Analysis and Forecast By Deployment Location, 2026 to 2036
- Inter-rack / scale-out
- Intra-rack / scale-up
- Spine-leaf fabric
- Campus / DCI
- Y-o-Y Growth Trend Analysis By Deployment Location, 2021 to 2025
- Absolute $ Opportunity Analysis By Deployment Location, 2026 to 2036
- Global Market Analysis and Forecast, By Data Center Type, 2021 to 2036
- Introduction / Key Findings
- Historical Market Size Value (USD Million) Analysis By Data Center Type, 2021 to 2025
- Current and Future Market Size Value (USD Million) Analysis and Forecast By Data Center Type, 2026 to 2036
- Hyperscale AI data centers
- Colocation AI facilities
- Enterprise AI/HPC
- Research / sovereign compute
- Y-o-Y Growth Trend Analysis By Data Center Type, 2021 to 2025
- Absolute $ Opportunity Analysis By Data Center Type, 2026 to 2036
- Global Market Analysis and Forecast, By Route to Market, 2021 to 2036
- Introduction / Key Findings
- Historical Market Size Value (USD Million) Analysis By Route to Market, 2021 to 2025
- Current and Future Market Size Value (USD Million) Analysis and Forecast By Route to Market, 2026 to 2036
- OEM direct
- Network system integrators
- Fiber/cabling specialists
- Test & managed-service providers
- Y-o-Y Growth Trend Analysis By Route to Market, 2021 to 2025
- Absolute $ Opportunity Analysis By Route to Market, 2026 to 2036
- Global Market Analysis and Forecast, By Region, 2021 to 2036
- Introduction
- Historical Market Size Value (USD Million) Analysis By Region, 2021 to 2025
- Current Market Size Value (USD Million) Analysis and Forecast By Region, 2026 to 2036
- North America
- Latin America
- Western Europe
- Eastern Europe
- East Asia
- South Asia and Pacific
- Middle East and Africa
- Market Attractiveness Analysis By Region
- North America Market Analysis and Forecast, By Country, 2021 to 2036
- Historical Market Size Value (USD Million) Trend Analysis By Market Taxonomy, 2021 to 2025
- Market Size Value (USD Million) Forecast By Market Taxonomy, 2026 to 2036
- By Country
- United States
- Canada
- By Link Speed
- By Service Type
- By Deployment Location
- By Data Center Type
- By Route to Market
- By Country
- Market Attractiveness Analysis
- By Country
- By Link Speed
- By Service Type
- By Deployment Location
- By Data Center Type
- By Route to Market
- Key Takeaways
- Latin America Market Analysis and Forecast, By Country
- Historical Market Size Value (USD Million) Trend Analysis By Market Taxonomy, 2021 to 2025
- Market Size Value (USD Million) Forecast By Market Taxonomy, 2026 to 2036
- By Country
- Brazil
- Mexico
- Argentina
- Chile
- By Link Speed
- By Service Type
- By Deployment Location
- By Data Center Type
- By Route to Market
- By Country
- Market Attractiveness Analysis
- By Country
- By Link Speed
- By Service Type
- By Deployment Location
- By Data Center Type
- By Route to Market
- Key Takeaways
- Western Europe Market Analysis and Forecast, By Country
- Historical Market Size Value (USD Million) Trend Analysis By Market Taxonomy, 2021 to 2025
- Market Size Value (USD Million) Forecast By Market Taxonomy, 2026 to 2036
- By Country
- Germany
- France
- United Kingdom
- Italy
- Spain
- Benelux
- Nordics
- By Link Speed
- By Service Type
- By Deployment Location
- By Data Center Type
- By Route to Market
- By Country
- Market Attractiveness Analysis
- By Country
- By Link Speed
- By Service Type
- By Deployment Location
- By Data Center Type
- By Route to Market
- Key Takeaways
- Eastern Europe Market Analysis and Forecast, By Country
- Historical Market Size Value (USD Million) Trend Analysis By Market Taxonomy, 2021 to 2025
- Market Size Value (USD Million) Forecast By Market Taxonomy, 2026 to 2036
- By Country
- Poland
- Czech Republic
- Romania
- Hungary
- By Link Speed
- By Service Type
- By Deployment Location
- By Data Center Type
- By Route to Market
- By Country
- Market Attractiveness Analysis
- By Country
- By Link Speed
- By Service Type
- By Deployment Location
- By Data Center Type
- By Route to Market
- Key Takeaways
- East Asia Market Analysis and Forecast, By Country
- Historical Market Size Value (USD Million) Trend Analysis By Market Taxonomy, 2021 to 2025
- Market Size Value (USD Million) Forecast By Market Taxonomy, 2026 to 2036
- By Country
- China
- Japan
- South Korea
- By Link Speed
- By Service Type
- By Deployment Location
- By Data Center Type
- By Route to Market
- By Country
- Market Attractiveness Analysis
- By Country
- By Link Speed
- By Service Type
- By Deployment Location
- By Data Center Type
- By Route to Market
- Key Takeaways
- South Asia and Pacific Market Analysis and Forecast, By Country
- Historical Market Size Value (USD Million) Trend Analysis By Market Taxonomy, 2021 to 2025
- Market Size Value (USD Million) Forecast By Market Taxonomy, 2026 to 2036
- By Country
- India
- ASEAN
- Australia and New Zealand
- By Link Speed
- By Service Type
- By Deployment Location
- By Data Center Type
- By Route to Market
- By Country
- Market Attractiveness Analysis
- By Country
- By Link Speed
- By Service Type
- By Deployment Location
- By Data Center Type
- By Route to Market
- Key Takeaways
- Middle East and Africa Market Analysis and Forecast, By Country
- Historical Market Size Value (USD Million) Trend Analysis By Market Taxonomy, 2021 to 2025
- Market Size Value (USD Million) Forecast By Market Taxonomy, 2026 to 2036
- By Country
- GCC Countries
- South Africa
- Türkiye
- Israel
- By Link Speed
- By Service Type
- By Deployment Location
- By Data Center Type
- By Route to Market
- By Country
- Market Attractiveness Analysis
- By Country
- By Link Speed
- By Service Type
- By Deployment Location
- By Data Center Type
- By Route to Market
- Key Takeaways
- Key Countries Market Analysis
- United States
- Pricing Analysis
- Market Share Analysis, 2025
- By Link Speed
- By Service Type
- By Deployment Location
- By Data Center Type
- By Route to Market
- Canada
- Pricing Analysis
- Market Share Analysis, 2025
- By Link Speed
- By Service Type
- By Deployment Location
- By Data Center Type
- By Route to Market
- Mexico
- Pricing Analysis
- Market Share Analysis, 2025
- By Link Speed
- By Service Type
- By Deployment Location
- By Data Center Type
- By Route to Market
- Brazil
- Pricing Analysis
- Market Share Analysis, 2025
- By Link Speed
- By Service Type
- By Deployment Location
- By Data Center Type
- By Route to Market
- Chile
- Pricing Analysis
- Market Share Analysis, 2025
- By Link Speed
- By Service Type
- By Deployment Location
- By Data Center Type
- By Route to Market
- Germany
- Pricing Analysis
- Market Share Analysis, 2025
- By Link Speed
- By Service Type
- By Deployment Location
- By Data Center Type
- By Route to Market
- United Kingdom
- Pricing Analysis
- Market Share Analysis, 2025
- By Link Speed
- By Service Type
- By Deployment Location
- By Data Center Type
- By Route to Market
- Italy
- Pricing Analysis
- Market Share Analysis, 2025
- By Link Speed
- By Service Type
- By Deployment Location
- By Data Center Type
- By Route to Market
- Spain
- Pricing Analysis
- Market Share Analysis, 2025
- By Link Speed
- By Service Type
- By Deployment Location
- By Data Center Type
- By Route to Market
- France
- Pricing Analysis
- Market Share Analysis, 2025
- By Link Speed
- By Service Type
- By Deployment Location
- By Data Center Type
- By Route to Market
- India
- Pricing Analysis
- Market Share Analysis, 2025
- By Link Speed
- By Service Type
- By Deployment Location
- By Data Center Type
- By Route to Market
- ASEAN
- Pricing Analysis
- Market Share Analysis, 2025
- By Link Speed
- By Service Type
- By Deployment Location
- By Data Center Type
- By Route to Market
- Australia and New Zealand
- Pricing Analysis
- Market Share Analysis, 2025
- By Link Speed
- By Service Type
- By Deployment Location
- By Data Center Type
- By Route to Market
- China
- Pricing Analysis
- Market Share Analysis, 2025
- By Link Speed
- By Service Type
- By Deployment Location
- By Data Center Type
- By Route to Market
- Japan
- Pricing Analysis
- Market Share Analysis, 2025
- By Link Speed
- By Service Type
- By Deployment Location
- By Data Center Type
- By Route to Market
- South Korea
- Pricing Analysis
- Market Share Analysis, 2025
- By Link Speed
- By Service Type
- By Deployment Location
- By Data Center Type
- By Route to Market
- Poland
- Pricing Analysis
- Market Share Analysis, 2025
- By Link Speed
- By Service Type
- By Deployment Location
- By Data Center Type
- By Route to Market
- Hungary
- Pricing Analysis
- Market Share Analysis, 2025
- By Link Speed
- By Service Type
- By Deployment Location
- By Data Center Type
- By Route to Market
- Türkiye
- Pricing Analysis
- Market Share Analysis, 2025
- By Link Speed
- By Service Type
- By Deployment Location
- By Data Center Type
- By Route to Market
- South Africa
- Pricing Analysis
- Market Share Analysis, 2025
- By Link Speed
- By Service Type
- By Deployment Location
- By Data Center Type
- By Route to Market
- UAE
- Pricing Analysis
- Market Share Analysis, 2025
- By Link Speed
- By Service Type
- By Deployment Location
- By Data Center Type
- By Route to Market
- United States
- Market Structure Analysis
- Competition Dashboard
- Competition Benchmarking
- Market Share Analysis of Top Players
- By Regional
- By Link Speed
- By Service Type
- By Deployment Location
- By Data Center Type
- By Route to Market
- Emerging Startups
- Innovation Benchmarking
- Competition Analysis
- Competition Deep Dive
- EXFO
- Overview
- Product Portfolio
- Profitability by Market Segments
- Sales Footprint
- Strategy Overview
- Marketing Strategy
- Product Strategy
- Channel Strategy
- VIAVI Solutions
- AFL
- Fluke Networks
- VeEX
- EXFO
- Case Studies
- Success Stories
- Recent Developments
- Competition Deep Dive
- Assumptions & Acronyms Used


