Near-Field Tag Antennas Market Size and Share Forecast Outlook 2025 to 2035

The global near-field tag antennas market is valued at USD 392.2 million and projected to reach USD 945.8 million, an absolute increase of USD 553.6 million. The overall growth of 141.2% equates to a CAGR of 9.2%, with the total market size expected to expand by 2.41X. Year-over-year analysis illustrates a consistent upward path, with demand being shaped by trends in RFID applications, retail automation, logistics optimization, and consumer electronics.

Top trends shaping this expansion include the integration of near-field antennas in retail point-of-sale and inventory systems, where real-time tracking improves accuracy and reduces shrinkage. Another driver is the surge in logistics automation, where package-level identification and contactless scanning systems demand reliable, compact antennas. The adoption of contactless payment infrastructure and NFC-enabled consumer electronics further reinforces growth, as device manufacturers emphasize faster, more secure transactions. Healthcare and pharmaceuticals also represent emerging areas, where near-field antennas are deployed for patient monitoring, equipment identification, and secure drug tracking. From 2025 to 2026, year-over-year growth is expected to be moderate, reflecting early adoption by retailers and logistics companies investing in RFID-enabled automation. By 2027 and 2028, the annual expansion rate will accelerate as large-scale deployments in supply chain hubs and consumer electronics increase. The near-field tag antennas market will reach approximately half of its forecasted expansion by 2030, with strong year-over-year momentum supported by Asia Pacific manufacturing hubs and North American retail consolidation.

Between 2030 and 2033, annual growth continues at a steady pace, bolstered by wider acceptance in sectors such as healthcare, where regulatory compliance and secure data transfer become mandatory. During this period, incremental revenue gains are larger compared to the earlier phase, reflecting mass adoption and replacement cycles for outdated systems. By 2034 and 2035, growth stabilizes as mature markets in Europe and North America consolidate, while emerging economies in Latin America, the Middle East, and Africa provide new incremental demand.

The year-over-year profile confirms that early adoption cycles are followed by accelerated expansion and eventual stabilization as technologies mature. Peaks align with phases of mass deployment in retail and logistics, while troughs are shallow, reflecting a market with durable demand. Trends in digitization, IoT integration, and contactless consumer experiences underpin consistent year-over-year increases, ensuring a predictable and resilient growth path through 2035.
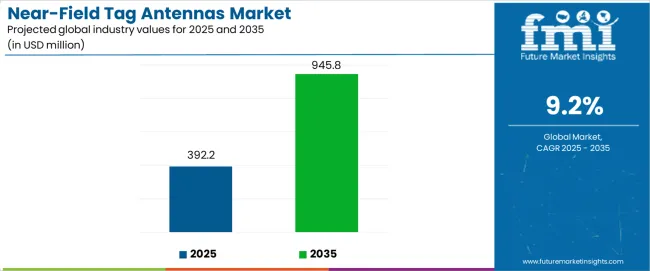
Quick Stats for Near-Field Tag Antennas Market

  • Near-Field Tag Antennas Market Value (2025): USD 392.2 million
  • Near-Field Tag Antennas Market Forecast Value (2035): USD 945.8 million
  • Near-Field Tag Antennas Market Forecast CAGR: 9.2%
  • Leading Type in Near-Field Tag Antennas Market: Passive Antenna (79%)
  • Key Growth Regions in Near-Field Tag Antennas Market: China, India, and Germany
  • Key Players in Near-Field Tag Antennas Market: Zebra Technologies, IFM Efector, Laird Technologies, Harting, Molex, Abracon

Near Field Tag Antennas Market Industry Value Analysis

Between 2025 and 2030, the near-field tag antennas market is projected to expand from USD 392.2 million to USD 609.1 million, resulting in a value increase of USD 216.9 million, which represents 39.2% of the total forecast growth for the decade. This phase of development will be shaped by increasing adoption of IoT connectivity technologies, rising demand for high-frequency rfID applications, and growing emphasis on automated inventory management systems with enhanced tracking capabilities. Technology integrators are expanding their antenna portfolio capabilities to address the growing demand for asset tracking applications, supply chain optimization, and industrial automation requirements.

Near-Field Tag Antennas Market Key Takeaways

Metric Value
Estimated Value in (2025E) USD 392.2 million
Forecast Value in (2035F) USD 945.8 million
Forecast CAGR (2025 to 2035) 9.2%

From 2030 to 2035, the near-field tag antennas market is forecast to grow from USD 609.1 million to USD 945.8 million, adding another USD 336.7 million, which constitutes 60.8% of the overall ten-year expansion. This period is expected to be characterized by the expansion of advanced NFC technologies, the integration of ai-powered tracking systems, and the development of multi-protocol antenna platforms with enhanced communication capabilities. The growing adoption of smart retail solutions will drive demand for near-field tag antennas with superior read range and compatibility with various rfID standards across commercial operations.

Between 2020 and 2025, the near-field tag antennas market experienced robust growth, driven by increasing demand for contactless payment solutions and growing recognition of rfID technology as essential tools for efficient inventory management across retail, healthcare, and logistics applications. The near-field tag antennas market developed as companies recognized the potential for antennas to enhance tracking accuracy while maintaining cost-effective identification protocols and enabling automated data capture. Technological advancement in antenna design and frequency optimization began emphasizing the critical importance of maintaining read reliability and signal strength in diverse operational environments.

Why is the Near-Field Tag Antennas Market Growing?

Market expansion is being supported by the increasing global demand for rfID identification solutions and the corresponding need for automated systems that can provide superior read accuracy and communication efficiency while enabling reduced manual scanning and enhanced inventory visibility across various retail and industrial applications. Modern supply chain operations and inventory management specialists are increasingly focused on implementing antenna technologies that can deliver reliable tag identification, prevent data loss, and provide consistent communication performance throughout complex warehouse environments and diverse product tracking conditions. Near-field tag antennas' proven ability to deliver exceptional read precision against interference challenges, enable high-speed operations, and support cost-effective identification protocols make them essential components for contemporary logistics and retail automation operations.

The growing emphasis on inventory accuracy and operational automation is driving demand for near-field tag antennas that can support large-scale rfID implementations, improve supply chain visibility, and enable automated tracking systems. Companies' preference for technology that combines effective tag identification with operational speed and data reliability is creating opportunities for innovative antenna implementations. The rising influence of IoT connectivity and smart inventory practices is also contributing to increased demand for near-field tag antennas that can provide multi-protocol support, real-time data transmission capabilities, and reliable performance across extended operational ranges.

Opportunity Pathways - Near-Field Tag Antennas Market

The near-field tag antennas market is poised for rapid growth and transformation. As industries across retail, healthcare, logistics, and manufacturing seek solutions that deliver exceptional read performance, operational efficiency, and system integration capabilities, near-field tag antennas are gaining prominence not just as specialized components but as strategic enablers of modern inventory management and asset tracking practices.

Rising rfID adoption in Asia-Pacific and expanding IoT initiatives globally amplify demand, while manufacturers are leveraging innovations in antenna design systems, frequency optimization controls, and integrated communication technologies.

Pathways like high-frequency antenna platforms, ai-powered identification systems, and specialized application solutions promise strong margin uplift, especially in enterprise-level segments. Geographic expansion and technology integration will capture volume, particularly where local retail practices and inventory automation adoption are critical. Regulatory support around data accuracy requirements, traceability standards, and operational efficiency mandates give structural support.

  • Pathway A - High-Frequency Antenna Platforms (≥900MHz). Enterprise retailers and logistics providers increasingly require near-field tag antennas with high-frequency capabilities for enhanced read range and reduced interference susceptibility. Antenna manufacturers who develop platforms with superior frequency performance can command premium pricing. Expected revenue pool: USD 285 million - USD 420 million.
  • Pathway B - Multi-Protocol Integration and IoT Connectivity. Growing demand for antennas supporting multiple rfID standards, NFC compatibility, and IoT communication protocols drives need for advanced integration technologies with seamless connectivity capabilities. Opportunity: USD 190 million - USD 285 million.
  • Pathway C - Industrial Automation Applications. Advanced near-field tag antennas capable of handling harsh industrial environments, high-temperature operations, and specialized mounting configurations enable performance improvements and expanded service capabilities for manufacturing integrators. Revenue lift: USD 142 million - USD 210 million.
  • Pathway D - Smart Retail Integration. Expanding reach into comprehensive retail management systems with point-of-sale integration, inventory optimization, and customer analytics capabilities. Retail operations will seek partners who supply integrated antenna solutions with complete omnichannel functionality. Pool: USD 175 million - USD 265 million.
  • Pathway E - Geographic Expansion & Regional Manufacturing. Strong growth in APAC, particularly China, India, and Southeast Asia. Local production lowers costs, reduces import dependencies, and enables faster response to regional technology requirements. Expected upside: USD 238 million - USD 360 million.
  • Pathway F - Healthcare Tracking Solutions. Increasing demand for medical-grade antennas, patient monitoring systems, and pharmaceutical tracking applications with validated performance effectiveness for critical healthcare environments. USD 127 million - USD 195 million.
  • Pathway G - System Integrator Solutions. Developing comprehensive antenna integration services, installation programs, and technical support services creates differentiation and addresses specialized requirements for rfID system integrators and technology consultants. Growing demand from enterprise technology services. Pool: USD 111 million - USD 170 million.

Segmental Analysis

The near-field tag antennas market is segmented by type, application, frequency range, end-use sector, and region. By type, the near-field tag antennas market is divided into passive antenna and active antenna categories. By application, it covers access control, smart card, medical tracking, electronic ticketing, and others. By frequency range, the near-field tag antennas market includes LF (125-134 kHz), HF (13.56 MHz), and UHF (860-960 MHz) systems. By end-use sector, it is categorized into retail, healthcare, logistics, manufacturing, and government. Regionally, the near-field tag antennas market is divided into North America, Europe, East Asia, South Asia & Pacific, Latin America, and the Middle East & Africa.
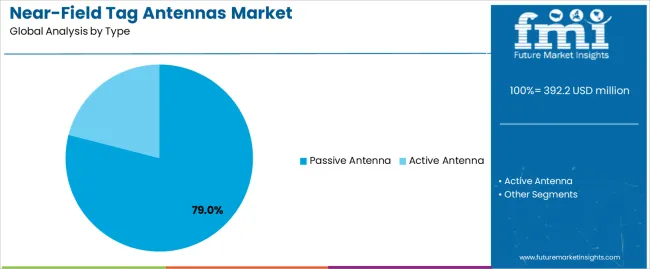
By Type, the Passive Antenna Segment Accounts for 79% Market Share

Near Field Tag Antennas Market Analysis By Type

The passive antenna segment is projected to account for 79% of the near-field tag antennas market in 2025, reaffirming its position as the leading technology category. Enterprise retailers and logistics providers increasingly utilize passive near-field tag antennas for their superior cost-effectiveness when operating across extensive inventory tracking applications, excellent power efficiency characteristics, and reliability in applications ranging from asset management to large-scale identification systems. Passive antenna technology's simplified design capabilities and extended operational lifespan directly address the industrial requirements for comprehensive coverage in high-volume identification environments.

This technology segment forms the foundation of modern rfID operations, as it represents the antenna type with the greatest deployment efficiency and established market demand across multiple application categories and industry sectors. Manufacturer investments in enhanced sensitivity technologies and improved read range compatibility continue to strengthen adoption among system integrators and enterprise customers. With companies prioritizing operational cost-effectiveness and deployment scalability, passive near-field tag antennas align with both performance requirements and economic efficiency objectives, making them the central component of comprehensive rfID automation strategies.
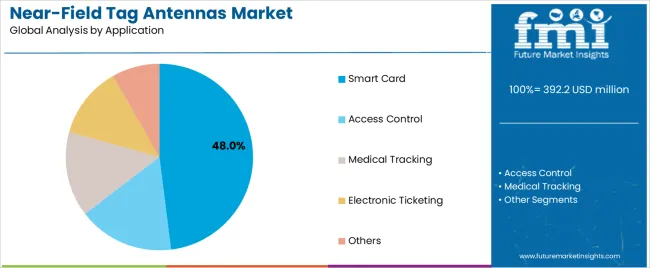
By Application, the Smart Card Segment Accounts for 48% Market Share

Near Field Tag Antennas Market Analysis By Application

Smart card applications are projected to represent 48% of near-field tag antenna demand in 2025, underscoring their critical role as the primary consumer identification consumers of contactless antenna technology for payment processing, access control, and secure authentication applications. Financial institutions and access control operators prefer near-field tag antennas for their exceptional security capabilities, rapid transaction processing characteristics, and ability to enable secure data transmission while ensuring reliable communication throughout diverse payment and identification programs. Positioned as essential components for modern contactless operations, near-field tag antennas offer both convenience advantages and security compliance benefits.

The segment is supported by continuous innovation in NFC technologies and the growing availability of specialized communication systems that enable enhanced security protocols with improved transaction speed and reliable card detection capabilities. Additionally, financial service providers are investing in infrastructure systems to support large-scale contactless deployment and payment processing. As digital payment demand becomes more prevalent and contactless transaction requirements increase, smart card applications will continue to dominate the end-use market while supporting advanced financial automation utilization and secure transaction strategies.

What are the Drivers, Restraints, and Key Trends of the Near-Field Tag Antennas Market?

The near-field tag antennas market is advancing rapidly due to increasing demand for rfID identification technologies and growing adoption of automated inventory management solutions that provide superior read accuracy and operational efficiency while enabling reduced manual processes across diverse retail and logistics applications. However, the near-field tag antennas market faces challenges, including high implementation costs, interference management requirements, and the need for specialized technical expertise and system integration capabilities. Innovation in multi-frequency designs and ai-powered optimization systems continues to influence product development and market expansion patterns.

Expansion of IoT and Connected Device Integration

The growing adoption of IoT connectivity systems, sensor integration algorithms, and cloud-based data management is enabling manufacturers to produce advanced near-field tag antennas with superior communication capabilities, enhanced network integration, and automated monitoring functionalities. Advanced connected systems provide improved data visibility while allowing more efficient inventory tracking and consistent performance across various application environments and operational conditions. Manufacturers are increasingly recognizing the competitive advantages of IoT-enabled antenna capabilities for operational differentiation and premium market positioning.

Integration of Smart Technology and Advanced Analytics

Modern near-field tag antenna producers are incorporating machine learning algorithms, predictive analytics capabilities, and integrated business intelligence systems to enhance operational insights, enable proactive maintenance capabilities, and deliver value-added solutions to enterprise customers. These technologies improve operational efficiency while enabling new capability sets, including real-time performance monitoring, usage pattern analysis, and reduced operational complexity. Advanced analytics integration also allows manufacturers to support comprehensive inventory management systems and business intelligence modernization beyond traditional manual identification approaches.
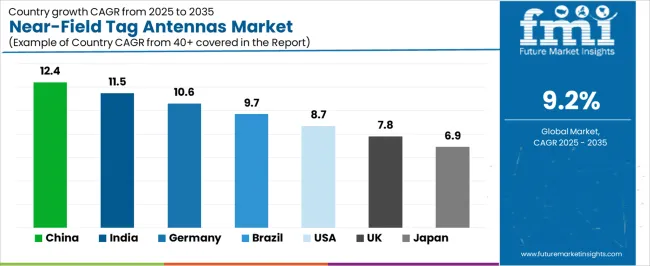
Analysis of the Near-Field Tag Antennas Market by Key Countries

Near Field Tag Antennas Market Cagr Analysis By Country

Country CAGR (2025-2035)
China 12.4%
India 11.5%
Germany 10.6%
Brazil 9.7%
USA 8.7%
UK 7.8%
Japan 6.9%

The near-field tag antennas market is experiencing strong growth globally, with China leading at a 12.4% CAGR through 2035, driven by the expanding IoT infrastructure programs, growing rfID technology adoption, and significant investment in automated identification development. India follows at 11.5%, supported by government initiatives promoting digital transformation, increasing retail modernization demand, and growing inventory management requirements. Germany shows growth at 10.6%, emphasizing industrial automation innovation and advanced manufacturing technology development. Brazil records 9.7%, focusing on retail modernization expansion and supply chain automation. The USA demonstrates 8.7% growth, prioritizing logistics efficiency standards and inventory automation excellence. The UK exhibits 7.8% growth, emphasizing retail technology adoption and contactless payment development. Japan shows 6.9% growth, supported by high-tech manufacturing initiatives and precision electronics concentration.

The report covers an in-depth analysis of 40+ countries, top-performing countries are highlighted below.

China Leads Global Market Growth with IoT Infrastructure Dominance

Revenue from near-field tag antennas in China is projected to exhibit exceptional growth with a CAGR of 12.4% through 2035, driven by expanding IoT infrastructure programs and rapidly growing rfID technology adoption supported by government initiatives promoting digital transformation development. The country's strong position in electronics manufacturing and increasing investment in smart retail infrastructure are creating substantial demand for advanced near-field tag antenna solutions. Major technology companies and manufacturing enterprises are establishing comprehensive antenna production capabilities to serve both domestic identification demand and export electronics markets.

  • Government support for digital transformation initiatives and smart city development is driving demand for near-field tag antennas throughout major industrial regions and technology parks across the country.
  • Strong electronics manufacturing growth and an expanding network of rfID system integrators are supporting the rapid adoption of near-field tag antennas among manufacturing operations seeking enhanced inventory tracking effectiveness and operational automation.

India Demonstrates Strong Market Potential with Digital Infrastructure Expansion

Revenue from near-field tag antennas in India is expanding at a CAGR of 11.5%, supported by the country's massive retail sector, expanding government support for digital payment systems, and increasing adoption of contactless transaction solutions. The country's initiatives promoting financial inclusion and growing consumer electronics market are driving requirements for advanced rfID identification capabilities. International suppliers and domestic manufacturers are establishing extensive production and service capabilities to address the growing demand for near-field tag antenna products.

  • Rising digital payment requirements and expanding retail modernization programs are creating opportunities for near-field tag antenna adoption across shopping centers, financial institutions, and technology service providers in major metropolitan areas.
  • Growing focus on inventory automation and supply chain optimization is driving adoption of advanced identification systems among retail chains seeking enhanced tracking effectiveness and operational cost reduction.

Germany Demonstrates Technological Leadership with Industrial Automation Growth

Revenue from near-field tag antennas in Germany is expanding at a CAGR of 10.6%, supported by the country's advanced manufacturing capabilities, strong emphasis on industrial automation innovation, and robust demand for high-performance identification systems in logistics and manufacturing applications. The nation's mature technology sector and efficiency-focused operations are driving sophisticated near-field tag antenna systems throughout the industrial automation industry. Leading manufacturers and technology providers are investing extensively in antenna design and precision manufacturing technologies to serve both domestic and international markets.

  • Rising demand for Industry 4.0 solutions and automated identification systems is creating requirements for advanced near-field tag antennas with exceptional precision capabilities among manufacturing companies seeking enhanced operational efficiency and quality control.
  • Strong engineering expertise and growing investment in smart factory technologies are supporting adoption of advanced identification systems with reduced complexity and enhanced integration precision across manufacturing operations in major industrial regions.

Brazil Focuses on Retail Modernization and Supply Chain Development

Revenue from near-field tag antennas in Brazil is growing at a CAGR of 9.7%, driven by the country's expanding retail sector, growing supply chain modernization initiatives, and increasing investment in logistics technology development. Brazil's large consumer market and commitment to retail automation are supporting demand for efficient near-field tag antenna solutions across multiple commercial segments. Manufacturers are establishing comprehensive service capabilities to serve the growing domestic market and regional export opportunities.

  • Strong retail expansion and expanding e-commerce operations are driving adoption of near-field tag antennas with superior tracking capabilities and operational reliability among retail chains and logistics companies.
  • Growing inventory management requirements and increasing automation adoption are supporting market expansion for advanced identification systems with enhanced read range and automated processing throughout the country's commercial regions.

USA Emphasizes Logistics Efficiency and Technology Innovation

Revenue from near-field tag antennas in the USA is expanding at a CAGR of 8.7%, supported by the country's advanced logistics technology sector, strategic focus on supply chain efficiency, and established rfID implementation capabilities. The USA's technology innovation leadership and automation integration are driving demand for near-field tag antennas in e-commerce fulfillment, healthcare tracking, and industrial automation applications. Manufacturers are investing in comprehensive technology development to serve both domestic commercial markets and international specialty applications.

  • Supply chain optimization and logistics automation advancement are creating opportunities for near-field tag antenna adoption in automated warehouse systems, inventory management services, and technology-focused distribution operations among leading logistics enterprises.
  • Growing emphasis on operational efficiency and tracking accuracy is driving adoption of advanced identification systems with enhanced precision and reduced operational complexity throughout the country's logistics sector.

UK Exhibits Retail Technology Development and Contactless Payment Growth

Revenue from near-field tag antennas in the UK is growing at a CAGR of 7.8%, driven by the country's focus on retail technology advancement, emphasis on contactless payment systems, and strong position in financial technology development. The UK's established financial services capabilities and commitment to payment modernization are supporting investment in advanced near-field tag technologies throughout major commercial regions. Industry leaders are establishing comprehensive technology integration systems to serve domestic retail operations and financial service applications.
  • Innovations in contactless payment systems and NFC technology capabilities are creating demand for advanced near-field tag antennas with exceptional communication properties among financial institutions seeking enhanced transaction effectiveness and operational reliability.
  • Growing retail automation adoption and increasing focus on customer experience optimization are driving adoption of intelligent identification systems with integrated payment processing and transaction monitoring across retail enterprises throughout the country.

Japan Shows High-Tech Manufacturing and Precision Electronics Production

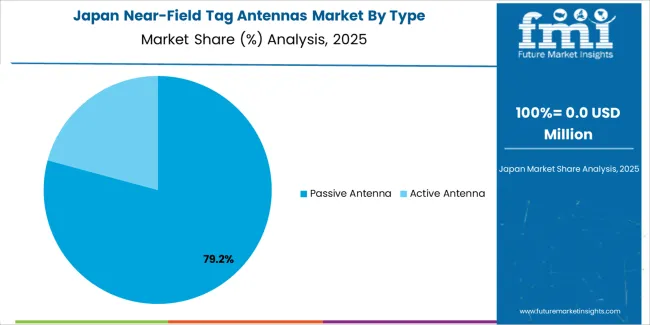
Near Field Tag Antennas Market Japan Market Share Analysis By Type

Revenue from near-field tag antennas in Japan is expanding at a CAGR of 6.9%, supported by the country's high-tech manufacturing initiatives, growing precision electronics sector, and strategic emphasis on automation technology development. Japan's advanced technology capabilities and integrated manufacturing systems are driving demand for advanced near-field tag antennas in electronics production, automotive applications, and high-precision manufacturing operations. Leading manufacturers are investing in specialized capabilities to serve the stringent requirements of precision manufacturing and electronics industries.

  • High-tech manufacturing advancement and precision electronics development are creating requirements for specialized near-field tag antennas with superior technology integration, exceptional frequency stability, and advanced miniaturization features among technology-focused manufacturing operations and electronics producers.
  • Strong position in automation technology innovation is supporting adoption of intelligent identification systems with validated performance characteristics and advanced integration capabilities throughout the country's manufacturing sector.

Europe Market Split by Countries

The near-field tag antennas market in Europe is projected to grow from USD 78.4 million in 2025 to USD 189.2 million by 2035, registering a CAGR of 9.2% over the forecast period. Germany is expected to maintain its leadership position with a 42.3% market share in 2025, declining slightly to 41.8% by 2035, supported by its strong industrial automation sector, advanced manufacturing technology capabilities, and comprehensive rfID integration industry serving diverse near-field tag antenna applications across Europe.

France follows with a 16.2% share in 2025, projected to reach 16.8% by 2035, driven by robust demand for near-field tag antennas in retail automation, contactless payment modernization programs, and logistics optimization applications, combined with established technology infrastructure and smart commerce expertise. The United Kingdom holds a 14.5% share in 2025, expected to reach 15.1% by 2035, supported by strong financial technology sector and growing contactless payment activities. Italy commands a 11.8% share in 2025, projected to reach 12.2% by 2035, while Spain accounts for 8.7% in 2025, expected to reach 9% by 2035. The Netherlands maintains a 3.9% share in 2025, growing to 4.1% by 2035. The Rest of Europe region, including Nordic countries, Eastern Europe, Belgium, Poland, and other nations, is anticipated to maintain momentum, with its collective share moving from 2.6% to 1% by 2035, attributed to increasing retail modernization in Eastern Europe and growing rfID penetration in Nordic countries implementing advanced identification technology programs.
Competitive Landscape of the Near-Field Tag Antennas Market

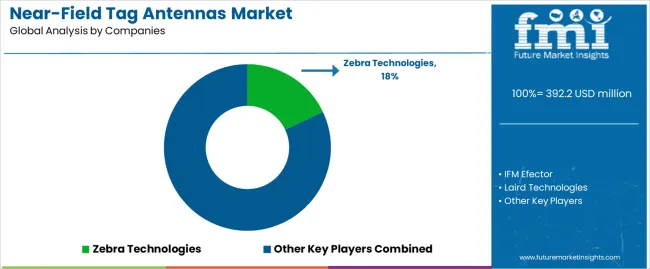
Near Field Tag Antennas Market Analysis By Company

The near-field tag antennas market is characterized by competition among established electronics manufacturers, specialized rfID technology producers, and integrated identification solutions providers. Companies are investing in antenna design research, frequency optimization development, communication protocol enhancement, and comprehensive product portfolios to deliver consistent, high-performance, and application-specific near-field tag antenna solutions. Innovation in multi-protocol systems, miniaturization technology, and operational efficiency enhancement is central to strengthening market position and competitive advantage.

Zebra Technologies leads the near-field tag antennas market with an 18% market share, offering comprehensive rfID solutions including advanced antenna technologies with a focus on enterprise and industrial applications. IFM Efector provides specialized industrial automation capabilities with an emphasis on sensor integration and automated identification systems. Laird Technologies delivers innovative connectivity products with a focus on high-performance antenna platforms and wireless communication solutions. Harting specializes in industrial connectivity and near-field tag antenna technologies for manufacturing applications. Molex focuses on electronic components and integrated connectivity solutions. Abracon offers specialized frequency control and antenna components with emphasis on precision electronics and communication applications.

Key Players in the Near-Field Tag Antennas Market

  • Zebra Technologies
  • IFM Efector
  • Laird Technologies
  • Harting
  • Molex
  • Abracon
  • Kathrein Solutions
  • Honeywell International
  • rfRain
  • PREMO USA
  • Tec-Tus
  • Impinj
  • Invengo rfID, Inc.
  • Myers Engineering International
  • Murata Electronics North America
  • Alien Technology
  • TagItron GmbH

Scope of the Report

Items Values
Quantitative Units (2025) USD 392.2 million
Type Passive Antenna, Active Antenna
Application Access Control, Smart Card, Medical Tracking, Electronic Ticketing, Others
Frequency Range LF (125-134 kHz), HF (13.56 MHz), UHF (860-960 MHz)
End-Use Sector Retail, Healthcare, Logistics, Manufacturing, Government
Regions Covered North America, Europe, East Asia, South Asia & Pacific, Latin America, Middle East & Africa
Countries Covered China, India, Germany, Brazil, United States, United Kingdom, Japan and 40+ countries
Key Companies Profiled Zebra Technologies, IFM Efector, Laird Technologies, Harting, Molex, and Abracon
Additional Attributes Dollar sales by type and application category, regional demand trends, competitive landscape, technological advancements in antenna design, frequency optimization development, IoT integration innovation, and rfID system integration

Near-Field Tag Antennas Market by Segments

Type:

  • Passive Antenna
  • Active Antenna

Application:

  • Access Control
  • Smart Card
  • Medical Tracking
  • Electronic Ticketing
  • Others

Frequency Range:

  • LF (125-134 kHz)
  • HF (13.56 MHz)
  • UHF (860-960 MHz)

End-Use Sector:

  • Retail
  • Healthcare
  • Logistics
  • Manufacturing
  • Government

Region:

North America

  • United States
  • Canada
  • Mexico

Europe

  • Germany
  • United Kingdom
  • France
  • Italy
  • Spain
  • Nordic
  • BENELUX
  • Rest of Europe

East Asia

  • China
  • Japan
  • South Korea
  • Taiwan

South Asia & Pacific

  • India
  • ASEAN
  • Australia & New Zealand
  • Rest of South Asia & Pacific

Latin America

  • Brazil
  • Chile
  • Argentina
  • Rest of Latin America

Middle East & Africa

  • Kingdom of Saudi Arabia
  • Other GCC Countries
  • Turkiye
  • South Africa
  • Other African Union
  • Rest of Middle East & Africa

Frequently Asked Questions

How big is the near-field tag antennas market in 2025?

The global near-field tag antennas market is estimated to be valued at USD 392.2 million in 2025.

What will be the size of near-field tag antennas market in 2035?

The market size for the near-field tag antennas market is projected to reach USD 945.8 million by 2035.

How much will be the near-field tag antennas market growth between 2025 and 2035?

The near-field tag antennas market is expected to grow at a 9.2% CAGR between 2025 and 2035.

What are the key product types in the near-field tag antennas market?

The key product types in near-field tag antennas market are passive antenna and active antenna.

Which application segment to contribute significant share in the near-field tag antennas market in 2025?

In terms of application, smart card segment to command 48.0% share in the near-field tag antennas market in 2025.

Table of Content

  1. Executive Summary
    • Global Market Outlook
    • Demand to side Trends
    • Supply to side Trends
    • Technology Roadmap Analysis
    • Analysis and Recommendations
  2. Market Overview
    • Market Coverage / Taxonomy
    • Market Definition / Scope / Limitations
  3. Market Background
    • Market Dynamics
      • Drivers
      • Restraints
      • Opportunity
      • Trends
    • Scenario Forecast
      • Demand in Optimistic Scenario
      • Demand in Likely Scenario
      • Demand in Conservative Scenario
    • Opportunity Map Analysis
    • Product Life Cycle Analysis
    • Supply Chain Analysis
    • Investment Feasibility Matrix
    • Value Chain Analysis
    • PESTLE and Porter’s Analysis
    • Regulatory Landscape
    • Regional Parent Market Outlook
    • Production and Consumption Statistics
    • Import and Export Statistics
  4. Global Market Analysis 2020 to 2024 and Forecast, 2025 to 2035
    • Historical Market size Value (USD Million) Analysis, 2020 to 2024
    • Current and Future Market size Value (USD Million) Projections, 2025 to 2035
      • Y to o to Y Growth Trend Analysis
      • Absolute $ Opportunity Analysis
  5. Global Market Pricing Analysis 2020 to 2024 and Forecast 2025 to 2035
  6. Global Market Analysis 2020 to 2024 and Forecast 2025 to 2035, By Type
    • Introduction / Key Findings
    • Historical Market size Value (USD Million) Analysis By Type , 2020 to 2024
    • Current and Future Market size Value (USD Million) Analysis and Forecast By Type , 2025 to 2035
      • Passive Antenna
      • Active Antenna
    • Y to o to Y Growth Trend Analysis By Type , 2020 to 2024
    • Absolute $ Opportunity Analysis By Type , 2025 to 2035
  7. Global Market Analysis 2020 to 2024 and Forecast 2025 to 2035, By Application
    • Introduction / Key Findings
    • Historical Market size Value (USD Million) Analysis By Application, 2020 to 2024
    • Current and Future Market size Value (USD Million) Analysis and Forecast By Application, 2025 to 2035
      • Smart Card
      • Access Control
      • Medical Tracking
      • Electronic Ticketing
      • Others
    • Y to o to Y Growth Trend Analysis By Application, 2020 to 2024
    • Absolute $ Opportunity Analysis By Application, 2025 to 2035
  8. Global Market Analysis 2020 to 2024 and Forecast 2025 to 2035, By Region
    • Introduction
    • Historical Market size Value (USD Million) Analysis By Region, 2020 to 2024
    • Current Market size Value (USD Million) Analysis and Forecast By Region, 2025 to 2035
      • North America
      • Latin America
      • Western Europe
      • Eastern Europe
      • East Asia
      • South Asia and Pacific
      • Middle East & Africa
    • Market Attractiveness Analysis By Region
  9. North America Market Analysis 2020 to 2024 and Forecast 2025 to 2035, By Country
    • Historical Market size Value (USD Million) Trend Analysis By Market Taxonomy, 2020 to 2024
    • Market size Value (USD Million) Forecast By Market Taxonomy, 2025 to 2035
      • By Country
        • USA
        • Canada
        • Mexico
      • By Type
      • By Application
    • Market Attractiveness Analysis
      • By Country
      • By Type
      • By Application
    • Key Takeaways
  10. Latin America Market Analysis 2020 to 2024 and Forecast 2025 to 2035, By Country
    • Historical Market size Value (USD Million) Trend Analysis By Market Taxonomy, 2020 to 2024
    • Market size Value (USD Million) Forecast By Market Taxonomy, 2025 to 2035
      • By Country
        • Brazil
        • Chile
        • Rest of Latin America
      • By Type
      • By Application
    • Market Attractiveness Analysis
      • By Country
      • By Type
      • By Application
    • Key Takeaways
  11. Western Europe Market Analysis 2020 to 2024 and Forecast 2025 to 2035, By Country
    • Historical Market size Value (USD Million) Trend Analysis By Market Taxonomy, 2020 to 2024
    • Market size Value (USD Million) Forecast By Market Taxonomy, 2025 to 2035
      • By Country
        • Germany
        • UK
        • Italy
        • Spain
        • France
        • Nordic
        • BENELUX
        • Rest of Western Europe
      • By Type
      • By Application
    • Market Attractiveness Analysis
      • By Country
      • By Type
      • By Application
    • Key Takeaways
  12. Eastern Europe Market Analysis 2020 to 2024 and Forecast 2025 to 2035, By Country
    • Historical Market size Value (USD Million) Trend Analysis By Market Taxonomy, 2020 to 2024
    • Market size Value (USD Million) Forecast By Market Taxonomy, 2025 to 2035
      • By Country
        • Russia
        • Poland
        • Hungary
        • Balkan & Baltic
        • Rest of Eastern Europe
      • By Type
      • By Application
    • Market Attractiveness Analysis
      • By Country
      • By Type
      • By Application
    • Key Takeaways
  13. East Asia Market Analysis 2020 to 2024 and Forecast 2025 to 2035, By Country
    • Historical Market size Value (USD Million) Trend Analysis By Market Taxonomy, 2020 to 2024
    • Market size Value (USD Million) Forecast By Market Taxonomy, 2025 to 2035
      • By Country
        • China
        • Japan
        • South Korea
      • By Type
      • By Application
    • Market Attractiveness Analysis
      • By Country
      • By Type
      • By Application
    • Key Takeaways
  14. South Asia and Pacific Market Analysis 2020 to 2024 and Forecast 2025 to 2035, By Country
    • Historical Market size Value (USD Million) Trend Analysis By Market Taxonomy, 2020 to 2024
    • Market size Value (USD Million) Forecast By Market Taxonomy, 2025 to 2035
      • By Country
        • India
        • ASEAN
        • Australia & New Zealand
        • Rest of South Asia and Pacific
      • By Type
      • By Application
    • Market Attractiveness Analysis
      • By Country
      • By Type
      • By Application
    • Key Takeaways
  15. Middle East & Africa Market Analysis 2020 to 2024 and Forecast 2025 to 2035, By Country
    • Historical Market size Value (USD Million) Trend Analysis By Market Taxonomy, 2020 to 2024
    • Market size Value (USD Million) Forecast By Market Taxonomy, 2025 to 2035
      • By Country
        • Kingdom of Saudi Arabia
        • Other GCC Countries
        • Turkiye
        • South Africa
        • Other African Union
        • Rest of Middle East & Africa
      • By Type
      • By Application
    • Market Attractiveness Analysis
      • By Country
      • By Type
      • By Application
    • Key Takeaways
  16. Key Countries Market Analysis
    • USA
      • Pricing Analysis
      • Market Share Analysis, 2024
        • By Type
        • By Application
    • Canada
      • Pricing Analysis
      • Market Share Analysis, 2024
        • By Type
        • By Application
    • Mexico
      • Pricing Analysis
      • Market Share Analysis, 2024
        • By Type
        • By Application
    • Brazil
      • Pricing Analysis
      • Market Share Analysis, 2024
        • By Type
        • By Application
    • Chile
      • Pricing Analysis
      • Market Share Analysis, 2024
        • By Type
        • By Application
    • Germany
      • Pricing Analysis
      • Market Share Analysis, 2024
        • By Type
        • By Application
    • UK
      • Pricing Analysis
      • Market Share Analysis, 2024
        • By Type
        • By Application
    • Italy
      • Pricing Analysis
      • Market Share Analysis, 2024
        • By Type
        • By Application
    • Spain
      • Pricing Analysis
      • Market Share Analysis, 2024
        • By Type
        • By Application
    • France
      • Pricing Analysis
      • Market Share Analysis, 2024
        • By Type
        • By Application
    • India
      • Pricing Analysis
      • Market Share Analysis, 2024
        • By Type
        • By Application
    • ASEAN
      • Pricing Analysis
      • Market Share Analysis, 2024
        • By Type
        • By Application
    • Australia & New Zealand
      • Pricing Analysis
      • Market Share Analysis, 2024
        • By Type
        • By Application
    • China
      • Pricing Analysis
      • Market Share Analysis, 2024
        • By Type
        • By Application
    • Japan
      • Pricing Analysis
      • Market Share Analysis, 2024
        • By Type
        • By Application
    • South Korea
      • Pricing Analysis
      • Market Share Analysis, 2024
        • By Type
        • By Application
    • Russia
      • Pricing Analysis
      • Market Share Analysis, 2024
        • By Type
        • By Application
    • Poland
      • Pricing Analysis
      • Market Share Analysis, 2024
        • By Type
        • By Application
    • Hungary
      • Pricing Analysis
      • Market Share Analysis, 2024
        • By Type
        • By Application
    • Kingdom of Saudi Arabia
      • Pricing Analysis
      • Market Share Analysis, 2024
        • By Type
        • By Application
    • Turkiye
      • Pricing Analysis
      • Market Share Analysis, 2024
        • By Type
        • By Application
    • South Africa
      • Pricing Analysis
      • Market Share Analysis, 2024
        • By Type
        • By Application
  17. Market Structure Analysis
    • Competition Dashboard
    • Competition Benchmarking
    • Market Share Analysis of Top Players
      • By Regional
      • By Type
      • By Application
  18. Competition Analysis
    • Competition Deep Dive
      • Zebra Technologies
        • Overview
        • Product Portfolio
        • Profitability by Market Segments (Product/Age /Sales Channel/Region)
        • Sales Footprint
        • Strategy Overview
          • Marketing Strategy
          • Product Strategy
          • Channel Strategy
      • IFM Efector
      • Laird Technologies
      • Harting
      • Molex
      • Abracon
      • Kathrein Solutions
      • Honeywell International
      • RFRain
      • PREMO USA
      • Tec-Tus
      • Impinj
      • Invengo RFID, Inc.
      • Myers Engineering International
      • Murata Electronics North America
      • Alien Technology
      • TagItron GmbH
  19. Assumptions & Acronyms Used
  20. Research Methodology

List of Tables

  • Table 1: Global Market Value (USD Million) Forecast by Region, 2020 to 2035
  • Table 2: Global Market Value (USD Million) Forecast by Type , 2020 to 2035
  • Table 3: Global Market Value (USD Million) Forecast by Application, 2020 to 2035
  • Table 4: North America Market Value (USD Million) Forecast by Country, 2020 to 2035
  • Table 5: North America Market Value (USD Million) Forecast by Type , 2020 to 2035
  • Table 6: North America Market Value (USD Million) Forecast by Application, 2020 to 2035
  • Table 7: Latin America Market Value (USD Million) Forecast by Country, 2020 to 2035
  • Table 8: Latin America Market Value (USD Million) Forecast by Type , 2020 to 2035
  • Table 9: Latin America Market Value (USD Million) Forecast by Application, 2020 to 2035
  • Table 10: Western Europe Market Value (USD Million) Forecast by Country, 2020 to 2035
  • Table 11: Western Europe Market Value (USD Million) Forecast by Type , 2020 to 2035
  • Table 12: Western Europe Market Value (USD Million) Forecast by Application, 2020 to 2035
  • Table 13: Eastern Europe Market Value (USD Million) Forecast by Country, 2020 to 2035
  • Table 14: Eastern Europe Market Value (USD Million) Forecast by Type , 2020 to 2035
  • Table 15: Eastern Europe Market Value (USD Million) Forecast by Application, 2020 to 2035
  • Table 16: East Asia Market Value (USD Million) Forecast by Country, 2020 to 2035
  • Table 17: East Asia Market Value (USD Million) Forecast by Type , 2020 to 2035
  • Table 18: East Asia Market Value (USD Million) Forecast by Application, 2020 to 2035
  • Table 19: South Asia and Pacific Market Value (USD Million) Forecast by Country, 2020 to 2035
  • Table 20: South Asia and Pacific Market Value (USD Million) Forecast by Type , 2020 to 2035
  • Table 21: South Asia and Pacific Market Value (USD Million) Forecast by Application, 2020 to 2035
  • Table 22: Middle East & Africa Market Value (USD Million) Forecast by Country, 2020 to 2035
  • Table 23: Middle East & Africa Market Value (USD Million) Forecast by Type , 2020 to 2035
  • Table 24: Middle East & Africa Market Value (USD Million) Forecast by Application, 2020 to 2035

List of Figures

  • Figure 1: Global Market Pricing Analysis
  • Figure 2: Global Market Value (USD Million) Forecast 2020-2035
  • Figure 3: Global Market Value Share and BPS Analysis by Type , 2025 and 2035
  • Figure 4: Global Market Y to o to Y Growth Comparison by Type , 2025-2035
  • Figure 5: Global Market Attractiveness Analysis by Type
  • Figure 6: Global Market Value Share and BPS Analysis by Application, 2025 and 2035
  • Figure 7: Global Market Y to o to Y Growth Comparison by Application, 2025-2035
  • Figure 8: Global Market Attractiveness Analysis by Application
  • Figure 9: Global Market Value (USD Million) Share and BPS Analysis by Region, 2025 and 2035
  • Figure 10: Global Market Y to o to Y Growth Comparison by Region, 2025-2035
  • Figure 11: Global Market Attractiveness Analysis by Region
  • Figure 12: North America Market Incremental Dollar Opportunity, 2025-2035
  • Figure 13: Latin America Market Incremental Dollar Opportunity, 2025-2035
  • Figure 14: Western Europe Market Incremental Dollar Opportunity, 2025-2035
  • Figure 15: Eastern Europe Market Incremental Dollar Opportunity, 2025-2035
  • Figure 16: East Asia Market Incremental Dollar Opportunity, 2025-2035
  • Figure 17: South Asia and Pacific Market Incremental Dollar Opportunity, 2025-2035
  • Figure 18: Middle East & Africa Market Incremental Dollar Opportunity, 2025-2035
  • Figure 19: North America Market Value Share and BPS Analysis by Country, 2025 and 2035
  • Figure 20: North America Market Value Share and BPS Analysis by Type , 2025 and 2035
  • Figure 21: North America Market Y to o to Y Growth Comparison by Type , 2025-2035
  • Figure 22: North America Market Attractiveness Analysis by Type
  • Figure 23: North America Market Value Share and BPS Analysis by Application, 2025 and 2035
  • Figure 24: North America Market Y to o to Y Growth Comparison by Application, 2025-2035
  • Figure 25: North America Market Attractiveness Analysis by Application
  • Figure 26: Latin America Market Value Share and BPS Analysis by Country, 2025 and 2035
  • Figure 27: Latin America Market Value Share and BPS Analysis by Type , 2025 and 2035
  • Figure 28: Latin America Market Y to o to Y Growth Comparison by Type , 2025-2035
  • Figure 29: Latin America Market Attractiveness Analysis by Type
  • Figure 30: Latin America Market Value Share and BPS Analysis by Application, 2025 and 2035
  • Figure 31: Latin America Market Y to o to Y Growth Comparison by Application, 2025-2035
  • Figure 32: Latin America Market Attractiveness Analysis by Application
  • Figure 33: Western Europe Market Value Share and BPS Analysis by Country, 2025 and 2035
  • Figure 34: Western Europe Market Value Share and BPS Analysis by Type , 2025 and 2035
  • Figure 35: Western Europe Market Y to o to Y Growth Comparison by Type , 2025-2035
  • Figure 36: Western Europe Market Attractiveness Analysis by Type
  • Figure 37: Western Europe Market Value Share and BPS Analysis by Application, 2025 and 2035
  • Figure 38: Western Europe Market Y to o to Y Growth Comparison by Application, 2025-2035
  • Figure 39: Western Europe Market Attractiveness Analysis by Application
  • Figure 40: Eastern Europe Market Value Share and BPS Analysis by Country, 2025 and 2035
  • Figure 41: Eastern Europe Market Value Share and BPS Analysis by Type , 2025 and 2035
  • Figure 42: Eastern Europe Market Y to o to Y Growth Comparison by Type , 2025-2035
  • Figure 43: Eastern Europe Market Attractiveness Analysis by Type
  • Figure 44: Eastern Europe Market Value Share and BPS Analysis by Application, 2025 and 2035
  • Figure 45: Eastern Europe Market Y to o to Y Growth Comparison by Application, 2025-2035
  • Figure 46: Eastern Europe Market Attractiveness Analysis by Application
  • Figure 47: East Asia Market Value Share and BPS Analysis by Country, 2025 and 2035
  • Figure 48: East Asia Market Value Share and BPS Analysis by Type , 2025 and 2035
  • Figure 49: East Asia Market Y to o to Y Growth Comparison by Type , 2025-2035
  • Figure 50: East Asia Market Attractiveness Analysis by Type
  • Figure 51: East Asia Market Value Share and BPS Analysis by Application, 2025 and 2035
  • Figure 52: East Asia Market Y to o to Y Growth Comparison by Application, 2025-2035
  • Figure 53: East Asia Market Attractiveness Analysis by Application
  • Figure 54: South Asia and Pacific Market Value Share and BPS Analysis by Country, 2025 and 2035
  • Figure 55: South Asia and Pacific Market Value Share and BPS Analysis by Type , 2025 and 2035
  • Figure 56: South Asia and Pacific Market Y to o to Y Growth Comparison by Type , 2025-2035
  • Figure 57: South Asia and Pacific Market Attractiveness Analysis by Type
  • Figure 58: South Asia and Pacific Market Value Share and BPS Analysis by Application, 2025 and 2035
  • Figure 59: South Asia and Pacific Market Y to o to Y Growth Comparison by Application, 2025-2035
  • Figure 60: South Asia and Pacific Market Attractiveness Analysis by Application
  • Figure 61: Middle East & Africa Market Value Share and BPS Analysis by Country, 2025 and 2035
  • Figure 62: Middle East & Africa Market Value Share and BPS Analysis by Type , 2025 and 2035
  • Figure 63: Middle East & Africa Market Y to o to Y Growth Comparison by Type , 2025-2035
  • Figure 64: Middle East & Africa Market Attractiveness Analysis by Type
  • Figure 65: Middle East & Africa Market Value Share and BPS Analysis by Application, 2025 and 2035
  • Figure 66: Middle East & Africa Market Y to o to Y Growth Comparison by Application, 2025-2035
  • Figure 67: Middle East & Africa Market Attractiveness Analysis by Application
  • Figure 68: Global Market - Tier Structure Analysis
  • Figure 69: Global Market - Company Share Analysis
Dashboard
Dashboard
Dashboard
Dashboard
Dashboard
Dashboard

Full Research Suite comprises of:

Market outlook & trends analysis

Market outlook & trends analysis

Interviews & case studies

Interviews & case studies

Strategic recommendations

Strategic recommendations

Vendor profiles & capabilities analysis

Vendor profiles & capabilities analysis

5-year forecasts

5-year forecasts

8 regions and 60+ country-level data splits

8 regions and 60+ country-level data splits

Market segment data splits

Market segment data splits

12 months of continuous data updates

12 months of continuous data updates

DELIVERED AS:

PDF EXCEL ONLINE

Full Research Suite


$5000

$7500

$10000

Buy Report Now
Similar Industry Reports

Similar Industry Reports

Tags Market
Tags Market

Tags Market Insights - Growth & Demand 2025 to 2035

Tagatose Market
Tagatose Market

Tagatose Market Analysis by Application, Sweetness Profile, Industry Demand, and Regional Forecast from 2025 to 2035

Metagenomics Market
Metagenomics Market

Metagenomics Market Trends - Industry Analysis & Forecast 2025 to 2035

Outage Management System Market

Outage Management System Market Insights – Forecast 2025-2035

Voltage Tester Market

Voltage Tester Market Size and Share Forecast Outlook 2025 to 2035

Voltage Regulator Market

Voltage Regulator Market Size and Share Forecast Outlook 2025 to 2035

Voltage Regulator For Advanced Semiconductor Market

Voltage Regulator For Advanced Semiconductor Market Size and Share Forecast Outlook 2025 to 2035

Voltage Detector Market

Voltage Detector Market Size and Share Forecast Outlook 2025 to 2035

Voltage Transducer Market

Voltage Transducer Market Size and Share Forecast Outlook 2025 to 2035

Voltage Controlled Oscillators Market

Voltage Controlled Oscillators Market Size and Share Forecast Outlook 2025 to 2035

Postage Stamp Paper Market

Postage Stamp Paper Market Size, Share & Forecast 2025 to 2035

Vintage Packaging Market

Global Vintage Packaging Market Growth – Trends & Forecast 2024-2034

Heritage Tourism Market Share Analysis

Market Share Breakdown of Heritage Tourism Service Providers

Heritage Tourism Market

Global Heritage Tourism Market Analysis by Experience Type, by End User, and by Region - Forecast for 2025 to 2035

NFC Tag ICs Market
NFC Tag ICs Market

NFC Tag ICs Market Analysis by Memory, Connection, Application, Industry and Region Through 2025 to 2035

Heritage Railway Train Market

Heritage Railway Train Market Analysis – Trends & Forecast 2024-2034

Hang Tag Applicators Market

Hang Tag Applicators Market Size and Share Forecast Outlook 2025 to 2035

Hang Tags Market
Hang Tags Market

Hang Tags Market Insights – Growth & Trends Forecast 2025 to 2035

Multistage Ring Section Pumps Market

Multistage Ring Section Pumps Market Size and Share Forecast Outlook 2025 to 2035

Multistage Electric Submersible Pump Market

Multistage Electric Submersible Pump Market Size and Share Forecast Outlook 2025 to 2035

Future Market Insights

Near-Field Tag Antennas Market

Chat With MaRIA

Chat With

MaRIA

Hi There, I am MaRIA, Your Market Research Intelligence Assistant. How may I help you?