Pick Fill Seal Machines Market Size and Share Forecast Outlook 2025 to 2035

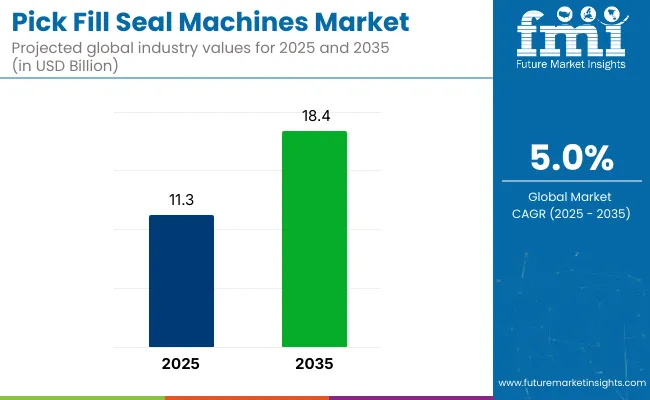
The pick fill seal machines market is projected to grow from USD 11.3 billion in 2025 to USD 18.4 billion by 2035, registering a CAGR of 5.0% during the forecast period. Sales in 2024 reached USD 10.7 billion.
Quick Stats of Pick Fill Seal Machines Market

  • Market Value (2025): USD 11.3 billion
  • Forecast Value (2035): USD 18.4 billion
  • Forecast CAGR: 5.0%
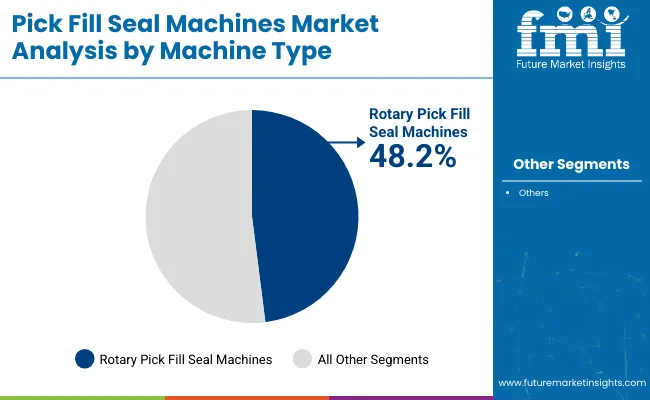
  • Machine Leader in 2025: Rotary pick fill seal (48.2% market share)
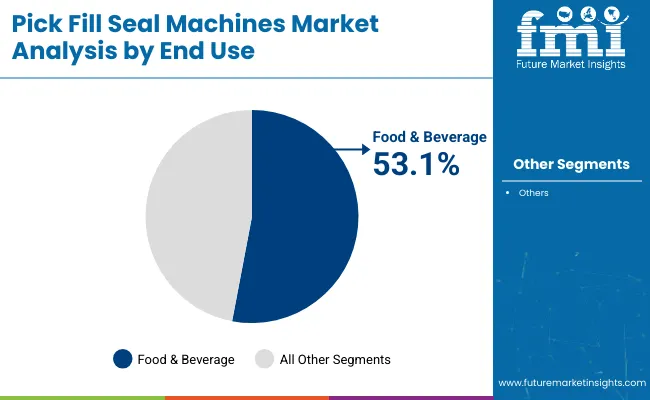
  • Top End Use: Food & Beverage (53.1% share)
  • Key Growth Country: Asia-Pacific (South Korea is the fastest-growing market with 5.3% CAGR)

Pick Fill Seal Machines Market

Metric Value
Market Size in 2025 USD 11.3 billion
Projected Market Size in 2035 USD 18.4 billion
CAGR (2025 to 2035) 5.0%

Growth has been driven by increasing demand for automated filling solutions across food and pharmaceutical packaging. Efficiency in reducing manual labor and ensuring contamination-free operations has been emphasized by manufacturers.

Flexibility in pouch formats and improved sealing integrity are being prioritized to meet high-throughput packaging requirements. Adoption of hygienic filling technologies and customizable packaging systems continues to support global adoption, particularly in emerging markets with expanding processed food sectors.

Development of sealers compatible with mono-material films has gained traction to enhance recyclability. Intelligent automation modules are being embedded into machine systems to reduce film consumption and energy waste during changeovers. Sustainability innovations in pick fill seal machines have been driven by eco-conscious packaging mandates and end-user interest in waste minimization.

Digital twin simulation models and AI-driven seal verification have also been adopted by OEMs to enhance packaging precision while reducing overall carbon footprint. Sustainable packaging innovations continue to be integrated within the packaging machinery ecosystem, especially for high-demand consumer product categories such as snacks, cereals, and personal care products.

The pick fill seal machines market is anticipated to benefit from surging contract packaging and e-commerce driven pouching trends. Rising consumer preference for reclosable and convenience pouches is expected to encourage machine upgrades globally. Key players are focusing on flexible feeding, high-speed changeovers, and smart monitoring systems to maintain a competitive edge.

Stringent regulations on hygiene in packaging equipment particularly in pharmaceutical and dairy applications will further drive demand for advanced models. Strategic partnerships between machine manufacturers and recyclable film producers are expected to shape the future of this market by improving cost efficiency and alignment with global environmental goals.

Analyzing Pick Fill Seal Machines Market by Top Investment Segment

The market is segmented based on machine type, automation level, end-use industry, and region. By machine type, the segmentation includes rotary pick fill seal machines, linear pick fill seal machines, multi-head pick fill seal machines, and custom/modular PFS systems, with rotary machines gaining traction for their high-speed, compact footprint, and consistent throughput.

Automation levels include semi-automatic and fully automatic pick fill seal machines, where fully automatic systems lead the segment due to labor efficiency, improved hygiene, and compatibility with smart packaging workflows.

End-use industries comprise food & beverage, pharmaceuticals & nutraceuticals, cosmetics & personal care, chemicals & fertilizers, pet food, and industrial & household products, driven by demand for flexible, high-volume pouch packaging and contamination prevention. Regionally, the market spans North America, Latin America, East Asia, South Asia & Pacific, Eastern Europe, Western Europe, Oceania, and Middle East & Africa.
Rotary Pick Fill Seal Machines Preferred for High-Speed Throughput and Versatile Packaging Design

Pick Fill Seal Machines Market Analysis By Machine Type

Rotary pick fill seal machines are projected to capture 48.2% of the global market by 2025. These systems have been engineered for continuous motion and precise pouch handling, enabling high output rates across flexible formats. Their ability to handle different pouch sizes and materials without extensive changeover has reduced operational downtime.

As a result, their adoption has increased in sectors demanding high efficiency and tight footprint integration. Manufacturers have favored rotary platforms for their ability to support sealing consistency and multi-head dispensing systems.

Servo-driven rotary arms and modular infeed stations have been utilized to boost precision and automate repetitive steps. Tool-less maintenance features have enhanced uptime in multi-shift operations. These systems have also supported nitrogen flushing and vacuum capabilities for shelf-life extension.

Applications across food, personal care, and pharma have been enabled by improved pouch stabilization and sealing integrity. Rotary systems have proven suitable for solids, powders, and liquids, making them versatile. Robotics integration and smart sensors have optimized error detection and package quality.

Their growing usage has reflected the industry’s shift toward compact, automated, and flexible equipment investments. Global OEMs have expanded their rotary PFS lines with cleanroom compatibility and GMP-compliant features. Customization for zipper pouches, stand-up pouches, and spouted variants has broadened adoption.

Advanced human-machine interfaces (HMI) have supported real-time diagnostics and quick adjustments. As demand for automation and multi-format flexibility grows, rotary systems are expected to remain a preferred capital investment.
Food & Beverage Segment Prioritized for Freshness, Hygiene, and Shelf Appeal

Pick Fill Seal Machines Market Analysis By End Use

The food & beverage industry is expected to account for 53.1% of the market by 2025. This sector has relied on pick fill seal machines for packaging items such as sauces, snacks, dry mixes, and ready-to-eat meals. High sanitation standards and leak-proof sealing have made these machines vital for product integrity and extended shelf life.

Their compatibility with laminated and recyclable pouches has further driven usage. Increased demand for portion packs, retort pouches, and reclosable formats has aligned with the sector’s packaging evolution. Pick fill seal systems have enabled rapid throughput and reduced product giveaway through accurate volumetric filling. Their use has been noted in frozen food lines, dairy snacks, and beverages requiring MAP sealing. Automated cleaning systems and wash-down resistance have met food safety regulations globally.

The growing trend of meal kits and convenience foods has propelled investments in flexible packaging automation. Quick changeover features have facilitated SKU diversity and reduced packaging waste. F&B manufacturers have preferred pick fill seal solutions for their space efficiency in modular plant layouts. As e-commerce grocery formats expand, tamper-evident, consumer-friendly pouches have gained traction.

Regional food producers and global brands have upgraded packaging lines to meet speed and sustainability metrics. Smart controls, vision inspection, and integration with ERP systems have streamlined operations. Improved seal quality, visual appeal, and barrier performance have enhanced brand equity on shelves. These factors are expected to sustain high adoption of PFS machines across the food and beverage sector.

Challenges and Opportunities

Challenge

Regulatory Compliance and Maintenance Costs

Stringent regulatory compliance and high maintenance costs-The Pick Fill Seal Machines Market has riding on its back the looming prospect of essentially dealing a great blow to the operations of industries using them, which have to follow food safety, pharmaceutical and packaging regulations. This increases their complexity. Maintenance costs associated with advanced automation technology further swell your overall expenses. It is very difficult indeed for small and medium-sized companies to introduce these machines.

Initial Capital Investment

Pick Fill Seal machines require significant initial investment, which can prevent small enterprises from adopting automatic packing lines. High upfront costs for advanced machinery, together with the need of skilled operators to make use it create financial barriers to markets entry especially for developing regions.

Opportunity

Technological Advancements and Automation

In the Pick Fill Seal Machines Market, the application of Industry 4.0 technologies, such as IoT-enabled monitoring, AI-driven process optimization and robotics translates into greater productivity. Smart machinery that can predict when it will next break down and monitors things in real-time is expected to cut downtime and lift yields.

Expansion in Emerging Markets

In the emerging economies of India and Southeast Asia, the trend towards eating processed food is picking up speed. Pharmaceuticals and consumer goods also fall into this category of industry where new opportunities abound for localization. As attention turns ever more firmly toward sanitary and eco-friendly packaging solutions, in these areas there has been a marked shift toward using automatic pick fill seal machine.

Country-wise Outlook

United States

The USA market for Pick Fill Seal Machines is still at a developmental stage, customers are demanding increased automation in food and beverage production. Among packaged food manufacturers in the United States, demand for fast and efficient packaging solutions is growing. The pharmaceutical industry, on the other hand, makes considerable use of them to pack drugs cleanly and precisely.

Country CAGR (2025 to 2035)
United States 4.8%

United Kingdom

The UK market is developing at a moderate pace. Food safety law is strict and more investment is being made in packaging automation, leading to this gentle growth curve. With the advent of e-commerce, manufacturers are preferring Pick Fill Seal Machines that can also cope with sustainable packaging solutions.

Country CAGR (2025 to 2035)
United Kingdom 4.9%

European Union

The European Union market for these machines grew strongly, because of the progress being made in the packaging technology fields and also due to pushes on sustainability. Led by countries such as Germany, France and Italy adopting automation in industries like food packing societies where it was once only manual handiwork are all undergoing a tremendous revolution with the use of these machines-not least pharmaceuticals products for obvious reasons.

Region CAGR (2025 to 2035)
European Union 5.2%

South Korea

In South Korea the market is good because of the many technological advances in recent years. As smart manufacturing replaces traditional production models for packaging--and with everyone wanting high efficiency and automation in everything from food processing to personal service goods production.

Country CAGR (2025 to 2035)
South Korea 5.3%

Competitive Outlook

The Pick Fill Seal (PFS) Machines Market is witnessing steady growth due to the rising demand for automated and efficient packaging solutions across various industries, including food & beverage, pharmaceuticals, and personal care. These machines enhance production speed, maintain product integrity, and reduce human intervention, making them an essential component in modern packaging lines.

Key Players

  • Viking Masek (Innovative PFS solutions for small to mid-scale production lines)
  • Fuji Machinery Co., Ltd. (High-efficiency sealing and packaging technology)
  • Mespack (Flexible packaging systems for diverse industrial needs)
  • MULTIVAC (Specialized in vacuum and flexible packaging solutions)

Key Segments

By Machine Type:

  • Rotary Pick Fill Seal Machines
  • Linear Pick Fill Seal Machines
  • Multi-Head Pick Fill Seal Machines
  • Custom/Modular PFS Systems

By Automation Level:

  • Semi-Automatic Pick Fill Seal Machines
  • Fully Automatic Pick Fill Seal Machines

By End-Use Industry:

  • Food & Beverage
  • Pharmaceuticals & Nutraceuticals
  • Cosmetics & Personal Care
  • Chemicals & Fertilizers
  • Pet Food
  • Industrial & Household Products

By Region:

  • North America
  • Latin America
  • Europe
  • East Asia
  • South Asia
  • Oceania
  • MEA

Table of Content

  1. Executive Summary
    • Global Market Outlook
    • Demand-side Trends
    • Supply-side Trends
    • Technology Roadmap Analysis
    • Analysis and Recommendations
  2. Market Overview
    • Market Coverage/Taxonomy
    • Market Definition/Scope/Limitations
  3. Market Background
    • Market Dynamics
      • Drivers
      • Restraints
      • Opportunity
      • Trends
    • Scenario Forecast
      • Demand in Optimistic Scenario
      • Demand in Likely Scenario
      • Demand in Conservative Scenario
    • Opportunity Map Analysis
    • Product Life Cycle Analysis
    • Supply Chain Analysis
      • Supply Side Participants and their Roles
        • Producers
        • Mid-Level Participants (Traders/ Agents/ Brokers)
        • Wholesalers and Distributors
      • Value Added and Value Created at Node in the Supply Chain
      • List of Raw Material Suppliers
      • List of Existing and Potential Buyer’s
    • Investment Feasibility Matrix
    • Value Chain Analysis
      • Profit Margin Analysis
      • Wholesalers and Distributors
      • Retailers
    • PESTLE and Porter’s Analysis
    • Regulatory Landscape
      • By Key Regions
      • By Key Countries
    • Regional Parent Market Outlook
    • Production and Consumption Statistics
    • Import and Export Statistics
  4. Global Market Analysis 2020 to 2024 and Forecast, 2025 to 2035
    • Historical Market Size Value (USD Billion) & Volume (Units) Analysis, 2020 to 2024
    • Current and Future Market Size Value (USD Billion) & Volume (Units) Projections, 2025 to 2035
      • Y-o-Y Growth Trend Analysis
      • Absolute $ Opportunity Analysis
  5. Global Market Pricing Analysis 2020 to 2024 and Forecast 2025 to 2035
  6. Global Market Analysis 2020 to 2024 and Forecast 2025 to 2035, By Machine Type
    • Introduction/Key Findings
    • Historical Market Size Value (USD Billion) & Volume (Units) Analysis By Machine Type, 2020 to 2024
    • Current and Future Market Size Value (USD Billion) & Volume (Units) Analysis and Forecast By Machine Type, 2025 to 2035
      • Rotary Pick Fill Seal Machines
      • Linear Pick Fill Seal Machines
      • Multi-Head Pick Fill Seal Machines
      • Custom/Modular PFS Systems
    • Y-o-Y Growth Trend Analysis By Machine Type, 2020 to 2024
    • Absolute $ Opportunity Analysis By Machine Type, 2025 to 2035
  7. Global Market Analysis 2020 to 2024 and Forecast 2025 to 2035, By Automation Level
    • Introduction/Key Findings
    • Historical Market Size Value (USD Billion) & Volume (Units) Analysis By Automation Level, 2020 to 2024
    • Current and Future Market Size Value (USD Billion) & Volume (Units) Analysis and Forecast By Automation Level, 2025 to 2035
      • Semi-Automatic Pick Fill Seal Machines
      • Fully Automatic Pick Fill Seal Machines
    • Y-o-Y Growth Trend Analysis By Automation Level, 2020 to 2024
    • Absolute $ Opportunity Analysis By Automation Level, 2025 to 2035
  8. Global Market Analysis 2020 to 2024 and Forecast 2025 to 2035, By End-Use Industry
    • Introduction/Key Findings
    • Historical Market Size Value (USD Billion) & Volume (Units) Analysis By End-Use Industry, 2020 to 2024
    • Current and Future Market Size Value (USD Billion) & Volume (Units) Analysis and Forecast By End-Use Industry, 2025 to 2035
      • Food & Beverage
      • Pharmaceuticals & Nutraceuticals
      • Cosmetics & Personal Care
      • Chemicals & Fertilizers
      • Pet Food
      • Industrial & Household Products
    • Y-o-Y Growth Trend Analysis By End-Use Industry, 2020 to 2024
    • Absolute $ Opportunity Analysis By End-Use Industry, 2025 to 2035
  9. Global Market Analysis 2020 to 2024 and Forecast 2025 to 2035, By Region
    • Introduction
    • Historical Market Size Value (USD Billion) & Volume (Units) Analysis By Region, 2020 to 2024
    • Current Market Size Value (USD Billion) & Volume (Units) Analysis and Forecast By Region, 2025 to 2035
      • North America
      • Latin America
      • Europe
      • East Asia
      • South Asia
      • Oceania
      • MEA
    • Market Attractiveness Analysis By Region
  10. North America Market Analysis 2020 to 2024 and Forecast 2025 to 2035, By Country
    • Historical Market Size Value (USD Billion) & Volume (Units) Trend Analysis By Market Taxonomy, 2020 to 2024
    • Market Size Value (USD Billion) & Volume (Units) Forecast By Market Taxonomy, 2025 to 2035
      • By Country
        • USA
        • Canada
      • By Machine Type
      • By Automation Level
      • By End-Use Industry
    • Market Attractiveness Analysis
      • By Country
      • By Machine Type
      • By Automation Level
      • By End-Use Industry
    • Key Takeaways
  11. Latin America Market Analysis 2020 to 2024 and Forecast 2025 to 2035, By Country
    • Historical Market Size Value (USD Billion) & Volume (Units) Trend Analysis By Market Taxonomy, 2020 to 2024
    • Market Size Value (USD Billion) & Volume (Units) Forecast By Market Taxonomy, 2025 to 2035
      • By Country
        • Brazil
        • Mexico
        • Argentina
        • Chile
        • Peru
        • Rest of Latin America
      • By Machine Type
      • By Automation Level
      • By End-Use Industry
    • Market Attractiveness Analysis
      • By Country
      • By Machine Type
      • By Automation Level
      • By End-Use Industry
    • Key Takeaways
  12. Europe Market Analysis 2020 to 2024 and Forecast 2025 to 2035, By Country
    • Historical Market Size Value (USD Billion) & Volume (Units) Trend Analysis By Market Taxonomy, 2020 to 2024
    • Market Size Value (USD Billion) & Volume (Units) Forecast By Market Taxonomy, 2025 to 2035
      • By Country
        • Germany
        • Italy
        • France
        • UK
        • Spain
        • Russia
        • BENELUX
        • Rest of Europe
      • By Machine Type
      • By Automation Level
      • By End-Use Industry
    • Market Attractiveness Analysis
      • By Country
      • By Machine Type
      • By Automation Level
      • By End-Use Industry
    • Key Takeaways
  13. East Asia Market Analysis 2020 to 2024 and Forecast 2025 to 2035, By Country
    • Historical Market Size Value (USD Billion) & Volume (Units) Trend Analysis By Market Taxonomy, 2020 to 2024
    • Market Size Value (USD Billion) & Volume (Units) Forecast By Market Taxonomy, 2025 to 2035
      • By Country
        • China
        • Japan
        • South Korea
      • By Machine Type
      • By Automation Level
      • By End-Use Industry
    • Market Attractiveness Analysis
      • By Country
      • By Machine Type
      • By Automation Level
      • By End-Use Industry
    • Key Takeaways
  14. South Asia Market Analysis 2020 to 2024 and Forecast 2025 to 2035, By Country
    • Historical Market Size Value (USD Billion) & Volume (Units) Trend Analysis By Market Taxonomy, 2020 to 2024
    • Market Size Value (USD Billion) & Volume (Units) Forecast By Market Taxonomy, 2025 to 2035
      • By Country
        • India
        • Thailand
        • Malaysia
        • Indonesia
        • Rest of South Asia
      • By Machine Type
      • By Automation Level
      • By End-Use Industry
    • Market Attractiveness Analysis
      • By Country
      • By Machine Type
      • By Automation Level
      • By End-Use Industry
    • Key Takeaways
  15. Oceania Market Analysis 2020 to 2024 and Forecast 2025 to 2035, By Country
    • Historical Market Size Value (USD Billion) & Volume (Units) Trend Analysis By Market Taxonomy, 2020 to 2024
    • Market Size Value (USD Billion) & Volume (Units) Forecast By Market Taxonomy, 2025 to 2035
      • By Country
        • Australia
        • New Zealand
      • By Machine Type
      • By Automation Level
      • By End-Use Industry
    • Market Attractiveness Analysis
      • By Country
      • By Machine Type
      • By Automation Level
      • By End-Use Industry
    • Key Takeaways
  16. MEA Market Analysis 2020 to 2024 and Forecast 2025 to 2035, By Country
    • Historical Market Size Value (USD Billion) & Volume (Units) Trend Analysis By Market Taxonomy, 2020 to 2024
    • Market Size Value (USD Billion) & Volume (Units) Forecast By Market Taxonomy, 2025 to 2035
      • By Country
        • GCC
        • Rest of MEA
      • By Machine Type
      • By Automation Level
      • By End-Use Industry
    • Market Attractiveness Analysis
      • By Country
      • By Machine Type
      • By Automation Level
      • By End-Use Industry
    • Key Takeaways
  17. Key Countries Market Analysis
    • USA
      • Pricing Analysis
      • Market Share Analysis, 2024
        • By Machine Type
        • By Automation Level
        • By End-Use Industry
    • Canada
      • Pricing Analysis
      • Market Share Analysis, 2024
        • By Machine Type
        • By Automation Level
        • By End-Use Industry
    • Brazil
      • Pricing Analysis
      • Market Share Analysis, 2024
        • By Machine Type
        • By Automation Level
        • By End-Use Industry
    • Mexico
      • Pricing Analysis
      • Market Share Analysis, 2024
        • By Machine Type
        • By Automation Level
        • By End-Use Industry
    • Argentina
      • Pricing Analysis
      • Market Share Analysis, 2024
        • By Machine Type
        • By Automation Level
        • By End-Use Industry
  18. Market Structure Analysis
    • Competition Dashboard
    • Competition Benchmarking
    • Market Share Analysis of Top Players
      • By Regional
      • By Machine Type
      • By Automation Level
      • By End-Use Industry
  19. Competition Analysis
    • Competition Deep Dive
      • Bossar Packaging S.A.
        • Overview
        • Product Portfolio
        • Profitability by Market Segments (Product/Age /Sales Channel/Region)
        • Sales Footprint
        • Strategy Overview
          • Marketing Strategy
          • Product Strategy
          • Channel Strategy
      • Winpak Ltd.
        • Overview
        • Product Portfolio
        • Profitability by Market Segments (Product/Age /Sales Channel/Region)
        • Sales Footprint
        • Strategy Overview
          • Marketing Strategy
          • Product Strategy
          • Channel Strategy
      • Rees Machinery Group
        • Overview
        • Product Portfolio
        • Profitability by Market Segments (Product/Age /Sales Channel/Region)
        • Sales Footprint
        • Strategy Overview
          • Marketing Strategy
          • Product Strategy
          • Channel Strategy
      • Busch Machinery, Inc.
        • Overview
        • Product Portfolio
        • Profitability by Market Segments (Product/Age /Sales Channel/Region)
        • Sales Footprint
        • Strategy Overview
          • Marketing Strategy
          • Product Strategy
          • Channel Strategy
      • Ohlson Packaging, Inc.
        • Overview
        • Product Portfolio
        • Profitability by Market Segments (Product/Age /Sales Channel/Region)
        • Sales Footprint
        • Strategy Overview
          • Marketing Strategy
          • Product Strategy
          • Channel Strategy
      • Mega Plast GmbH
        • Overview
        • Product Portfolio
        • Profitability by Market Segments (Product/Age /Sales Channel/Region)
        • Sales Footprint
        • Strategy Overview
          • Marketing Strategy
          • Product Strategy
          • Channel Strategy
      • Arpac LLC
        • Overview
        • Product Portfolio
        • Profitability by Market Segments (Product/Age /Sales Channel/Region)
        • Sales Footprint
        • Strategy Overview
          • Marketing Strategy
          • Product Strategy
          • Channel Strategy
      • Matrix Packaging Machinery, LLC
        • Overview
        • Product Portfolio
        • Profitability by Market Segments (Product/Age /Sales Channel/Region)
        • Sales Footprint
        • Strategy Overview
          • Marketing Strategy
          • Product Strategy
          • Channel Strategy
      • Ohlson Packaging, Inc.
        • Overview
        • Product Portfolio
        • Profitability by Market Segments (Product/Age /Sales Channel/Region)
        • Sales Footprint
        • Strategy Overview
          • Marketing Strategy
          • Product Strategy
          • Channel Strategy
      • Mamata Machinery Pvt. Ltd.
        • Overview
        • Product Portfolio
        • Profitability by Market Segments (Product/Age /Sales Channel/Region)
        • Sales Footprint
        • Strategy Overview
          • Marketing Strategy
          • Product Strategy
          • Channel Strategy
  20. Assumptions & Acronyms Used
  21. Research Methodology

List of Tables

  • Table 1: Global Market Value (USD Billion) Forecast by Region, 2020-2035
  • Table 2: Global Market Volume (Units) Forecast by Region, 2020-2035
  • Table 3: Global Market Value (USD Billion) Forecast by Machine Type, 2020-2035
  • Table 4: Global Market Volume (Units) Forecast by Machine Type, 2020-2035
  • Table 5: Global Market Value (USD Billion) Forecast by Automation Level, 2020-2035
  • Table 6: Global Market Volume (Units) Forecast by Automation Level, 2020-2035
  • Table 7: Global Market Value (USD Billion) Forecast by End-Use Industry, 2020-2035
  • Table 8: Global Market Volume (Units) Forecast by End-Use Industry, 2020-2035
  • Table 9: North America Market Value (USD Billion) Forecast by Country, 2020-2035
  • Table 10: North America Market Volume (Units) Forecast by Country, 2020-2035
  • Table 11: North America Market Value (USD Billion) Forecast by Machine Type, 2020-2035
  • Table 12: North America Market Volume (Units) Forecast by Machine Type, 2020-2035
  • Table 13: North America Market Value (USD Billion) Forecast by Automation Level, 2020-2035
  • Table 14: North America Market Volume (Units) Forecast by Automation Level, 2020-2035
  • Table 15: North America Market Value (USD Billion) Forecast by End-Use Industry, 2020-2035
  • Table 16: North America Market Volume (Units) Forecast by End-Use Industry, 2020-2035
  • Table 17: Latin America Market Value (USD Billion) Forecast by Country, 2020-2035
  • Table 18: Latin America Market Volume (Units) Forecast by Country, 2020-2035
  • Table 19: Latin America Market Value (USD Billion) Forecast by Machine Type, 2020-2035
  • Table 20: Latin America Market Volume (Units) Forecast by Machine Type, 2020-2035
  • Table 21: Latin America Market Value (USD Billion) Forecast by Automation Level, 2020-2035
  • Table 22: Latin America Market Volume (Units) Forecast by Automation Level, 2020-2035
  • Table 23: Latin America Market Value (USD Billion) Forecast by End-Use Industry, 2020-2035
  • Table 24: Latin America Market Volume (Units) Forecast by End-Use Industry, 2020-2035
  • Table 25: Europe Market Value (USD Billion) Forecast by Country, 2020-2035
  • Table 26: Europe Market Volume (Units) Forecast by Country, 2020-2035
  • Table 27: Europe Market Value (USD Billion) Forecast by Machine Type, 2020-2035
  • Table 28: Europe Market Volume (Units) Forecast by Machine Type, 2020-2035
  • Table 29: Europe Market Value (USD Billion) Forecast by Automation Level, 2020-2035
  • Table 30: Europe Market Volume (Units) Forecast by Automation Level, 2020-2035
  • Table 31: Europe Market Value (USD Billion) Forecast by End-Use Industry, 2020-2035
  • Table 32: Europe Market Volume (Units) Forecast by End-Use Industry, 2020-2035
  • Table 33: East Asia Market Value (USD Billion) Forecast by Country, 2020-2035
  • Table 34: East Asia Market Volume (Units) Forecast by Country, 2020-2035
  • Table 35: East Asia Market Value (USD Billion) Forecast by Machine Type, 2020-2035
  • Table 36: East Asia Market Volume (Units) Forecast by Machine Type, 2020-2035
  • Table 37: East Asia Market Value (USD Billion) Forecast by Automation Level, 2020-2035
  • Table 38: East Asia Market Volume (Units) Forecast by Automation Level, 2020-2035
  • Table 39: East Asia Market Value (USD Billion) Forecast by End-Use Industry, 2020-2035
  • Table 40: East Asia Market Volume (Units) Forecast by End-Use Industry, 2020-2035
  • Table 41: South Asia Market Value (USD Billion) Forecast by Country, 2020-2035
  • Table 42: South Asia Market Volume (Units) Forecast by Country, 2020-2035
  • Table 43: South Asia Market Value (USD Billion) Forecast by Machine Type, 2020-2035
  • Table 44: South Asia Market Volume (Units) Forecast by Machine Type, 2020-2035
  • Table 45: South Asia Market Value (USD Billion) Forecast by Automation Level, 2020-2035
  • Table 46: South Asia Market Volume (Units) Forecast by Automation Level, 2020-2035
  • Table 47: South Asia Market Value (USD Billion) Forecast by End-Use Industry, 2020-2035
  • Table 48: South Asia Market Volume (Units) Forecast by End-Use Industry, 2020-2035
  • Table 49: Oceania Market Value (USD Billion) Forecast by Country, 2020-2035
  • Table 50: Oceania Market Volume (Units) Forecast by Country, 2020-2035
  • Table 51: Oceania Market Value (USD Billion) Forecast by Machine Type, 2020-2035
  • Table 52: Oceania Market Volume (Units) Forecast by Machine Type, 2020-2035
  • Table 53: Oceania Market Value (USD Billion) Forecast by Automation Level, 2020-2035
  • Table 54: Oceania Market Volume (Units) Forecast by Automation Level, 2020-2035
  • Table 55: Oceania Market Value (USD Billion) Forecast by End-Use Industry, 2020-2035
  • Table 56: Oceania Market Volume (Units) Forecast by End-Use Industry, 2020-2035
  • Table 57: MEA Market Value (USD Billion) Forecast by Country, 2020-2035
  • Table 58: MEA Market Volume (Units) Forecast by Country, 2020-2035
  • Table 59: MEA Market Value (USD Billion) Forecast by Machine Type, 2020-2035
  • Table 60: MEA Market Volume (Units) Forecast by Machine Type, 2020-2035
  • Table 61: MEA Market Value (USD Billion) Forecast by Automation Level, 2020-2035
  • Table 62: MEA Market Volume (Units) Forecast by Automation Level, 2020-2035
  • Table 63: MEA Market Value (USD Billion) Forecast by End-Use Industry, 2020-2035
  • Table 64: MEA Market Volume (Units) Forecast by End-Use Industry, 2020-2035

List of Figures

  • Figure 1: Global Market Volume (Units) Forecast 2020-2035
  • Figure 2: Global Market Pricing Analysis
  • Figure 3: Global Market Value (USD Billion) Forecast 2020-2035
  • Figure 4: Global Market Value Share and BPS Analysis by Machine Type, 2025 and 2035
  • Figure 5: Global Market Y-o-Y Growth Comparison by Machine Type, 2025-2035
  • Figure 6: Global Market Attractiveness Analysis by Machine Type
  • Figure 7: Global Market Value Share and BPS Analysis by Automation Level, 2025 and 2035
  • Figure 8: Global Market Y-o-Y Growth Comparison by Automation Level, 2025-2035
  • Figure 9: Global Market Attractiveness Analysis by Automation Level
  • Figure 10: Global Market Value Share and BPS Analysis by End-Use Industry, 2025 and 2035
  • Figure 11: Global Market Y-o-Y Growth Comparison by End-Use Industry, 2025-2035
  • Figure 12: Global Market Attractiveness Analysis by End-Use Industry
  • Figure 13: Global Market Value (USD Billion) Share and BPS Analysis by Region, 2025 and 2035
  • Figure 14: Global Market Y-o-Y Growth Comparison by Region, 2025-2035
  • Figure 15: Global Market Attractiveness Analysis by Region
  • Figure 16: North America Market Incremental $ Opportunity, 2025-2035
  • Figure 17: Latin America Market Incremental $ Opportunity, 2025-2035
  • Figure 18: Europe Market Incremental $ Opportunity, 2025-2035
  • Figure 19: East Asia Market Incremental $ Opportunity, 2025-2035
  • Figure 20: South Asia Market Incremental $ Opportunity, 2025-2035
  • Figure 21: Oceania Market Incremental $ Opportunity, 2025-2035
  • Figure 22: MEA Market Incremental $ Opportunity, 2025-2035
  • Figure 23: North America Market Value Share and BPS Analysis by Country, 2025 and 2035
  • Figure 24: North America Market Value Share and BPS Analysis by Machine Type, 2025 and 2035
  • Figure 25: North America Market Y-o-Y Growth Comparison by Machine Type, 2025-2035
  • Figure 26: North America Market Attractiveness Analysis by Machine Type
  • Figure 27: North America Market Value Share and BPS Analysis by Automation Level, 2025 and 2035
  • Figure 28: North America Market Y-o-Y Growth Comparison by Automation Level, 2025-2035
  • Figure 29: North America Market Attractiveness Analysis by Automation Level
  • Figure 30: North America Market Value Share and BPS Analysis by End-Use Industry, 2025 and 2035
  • Figure 31: North America Market Y-o-Y Growth Comparison by End-Use Industry, 2025-2035
  • Figure 32: North America Market Attractiveness Analysis by End-Use Industry
  • Figure 33: Latin America Market Value Share and BPS Analysis by Country, 2025 and 2035
  • Figure 34: Latin America Market Value Share and BPS Analysis by Machine Type, 2025 and 2035
  • Figure 35: Latin America Market Y-o-Y Growth Comparison by Machine Type, 2025-2035
  • Figure 36: Latin America Market Attractiveness Analysis by Machine Type
  • Figure 37: Latin America Market Value Share and BPS Analysis by Automation Level, 2025 and 2035
  • Figure 38: Latin America Market Y-o-Y Growth Comparison by Automation Level, 2025-2035
  • Figure 39: Latin America Market Attractiveness Analysis by Automation Level
  • Figure 40: Latin America Market Value Share and BPS Analysis by End-Use Industry, 2025 and 2035
  • Figure 41: Latin America Market Y-o-Y Growth Comparison by End-Use Industry, 2025-2035
  • Figure 42: Latin America Market Attractiveness Analysis by End-Use Industry
  • Figure 43: Europe Market Value Share and BPS Analysis by Country, 2025 and 2035
  • Figure 44: Europe Market Value Share and BPS Analysis by Machine Type, 2025 and 2035
  • Figure 45: Europe Market Y-o-Y Growth Comparison by Machine Type, 2025-2035
  • Figure 46: Europe Market Attractiveness Analysis by Machine Type
  • Figure 47: Europe Market Value Share and BPS Analysis by Automation Level, 2025 and 2035
  • Figure 48: Europe Market Y-o-Y Growth Comparison by Automation Level, 2025-2035
  • Figure 49: Europe Market Attractiveness Analysis by Automation Level
  • Figure 50: Europe Market Value Share and BPS Analysis by End-Use Industry, 2025 and 2035
  • Figure 51: Europe Market Y-o-Y Growth Comparison by End-Use Industry, 2025-2035
  • Figure 52: Europe Market Attractiveness Analysis by End-Use Industry
  • Figure 53: East Asia Market Value Share and BPS Analysis by Country, 2025 and 2035
  • Figure 54: East Asia Market Value Share and BPS Analysis by Machine Type, 2025 and 2035
  • Figure 55: East Asia Market Y-o-Y Growth Comparison by Machine Type, 2025-2035
  • Figure 56: East Asia Market Attractiveness Analysis by Machine Type
  • Figure 57: East Asia Market Value Share and BPS Analysis by Automation Level, 2025 and 2035
  • Figure 58: East Asia Market Y-o-Y Growth Comparison by Automation Level, 2025-2035
  • Figure 59: East Asia Market Attractiveness Analysis by Automation Level
  • Figure 60: East Asia Market Value Share and BPS Analysis by End-Use Industry, 2025 and 2035
  • Figure 61: East Asia Market Y-o-Y Growth Comparison by End-Use Industry, 2025-2035
  • Figure 62: East Asia Market Attractiveness Analysis by End-Use Industry
  • Figure 63: South Asia Market Value Share and BPS Analysis by Country, 2025 and 2035
  • Figure 64: South Asia Market Value Share and BPS Analysis by Machine Type, 2025 and 2035
  • Figure 65: South Asia Market Y-o-Y Growth Comparison by Machine Type, 2025-2035
  • Figure 66: South Asia Market Attractiveness Analysis by Machine Type
  • Figure 67: South Asia Market Value Share and BPS Analysis by Automation Level, 2025 and 2035
  • Figure 68: South Asia Market Y-o-Y Growth Comparison by Automation Level, 2025-2035
  • Figure 69: South Asia Market Attractiveness Analysis by Automation Level
  • Figure 70: South Asia Market Value Share and BPS Analysis by End-Use Industry, 2025 and 2035
  • Figure 71: South Asia Market Y-o-Y Growth Comparison by End-Use Industry, 2025-2035
  • Figure 72: South Asia Market Attractiveness Analysis by End-Use Industry
  • Figure 73: Oceania Market Value Share and BPS Analysis by Country, 2025 and 2035
  • Figure 74: Oceania Market Value Share and BPS Analysis by Machine Type, 2025 and 2035
  • Figure 75: Oceania Market Y-o-Y Growth Comparison by Machine Type, 2025-2035
  • Figure 76: Oceania Market Attractiveness Analysis by Machine Type
  • Figure 77: Oceania Market Value Share and BPS Analysis by Automation Level, 2025 and 2035
  • Figure 78: Oceania Market Y-o-Y Growth Comparison by Automation Level, 2025-2035
  • Figure 79: Oceania Market Attractiveness Analysis by Automation Level
  • Figure 80: Oceania Market Value Share and BPS Analysis by End-Use Industry, 2025 and 2035
  • Figure 81: Oceania Market Y-o-Y Growth Comparison by End-Use Industry, 2025-2035
  • Figure 82: Oceania Market Attractiveness Analysis by End-Use Industry
  • Figure 83: MEA Market Value Share and BPS Analysis by Country, 2025 and 2035
  • Figure 84: MEA Market Value Share and BPS Analysis by Machine Type, 2025 and 2035
  • Figure 85: MEA Market Y-o-Y Growth Comparison by Machine Type, 2025-2035
  • Figure 86: MEA Market Attractiveness Analysis by Machine Type
  • Figure 87: MEA Market Value Share and BPS Analysis by Automation Level, 2025 and 2035
  • Figure 88: MEA Market Y-o-Y Growth Comparison by Automation Level, 2025-2035
  • Figure 89: MEA Market Attractiveness Analysis by Automation Level
  • Figure 90: MEA Market Value Share and BPS Analysis by End-Use Industry, 2025 and 2035
  • Figure 91: MEA Market Y-o-Y Growth Comparison by End-Use Industry, 2025-2035
  • Figure 92: MEA Market Attractiveness Analysis by End-Use Industry
  • Figure 93: Global Market - Tier Structure Analysis
  • Figure 94: Global Market - Company Share Analysis

Frequently Asked Questions

What was the overall size of the pick fill seal machines market in 2025?

The overall market size for pick fill seal machines market was USD 11.3 billion in 2025.

How big the bio is based pick fill seal machines market expected in 2035?

The pick fill seal machines market is expected to reach USD 18.4 billion in 2035.

What will drive the demand for pick fill seal machines market during the forecast period?

Rising automation in packaging, demand for flexible packaging solutions, and growth in food, pharmaceutical, and consumer goods industries will drive market demand.

List the top 5 countries contributing in pick fill seal machines market?

The top 5 countries which drives the development of pick fill seal machines market are USA, European Union, Japan, South Korea and UK.

Which segment in type is expected to lead pick fill seal machines market?

Automatic Pick Fill Seal Machines demand supplier to command significant share over the assessment period.

Explore Similar Insights

Future Market Insights

Pick Fill Seal Machines Market