

- Market Size (2026)
- USD 1260.7 Mn
- Forecast (2036)
- USD 2411.3 Mn
- CAGR (2026 to 2036)
- 6.7%
How big is the Plastic Valve Manifolds Market in 2026?
USD 1,260.7 million in 2026 and USD 2,411.3 million by 2036 at a 6.7% CAGR.
Demand for plastic valve manifolds is projected to rise at a CAGR of 6.7% by 2036, driving industry valuation from USD 1,260.7 million in 2026 to USD 2,411.3 million during the forecast period. Plastic valve manifolds are shifting from routine fluid-control parts into engineered assemblies used to protect flow stability and installation accuracy. OEMs and plant engineers evaluate dimensional control before product approval. Federal Reserve data reported total industrial production at 102.6 percent of its 2017 average in May 2026, sustaining steady demand for components used across industrial systems.
China accounts are projected to emphasize clean fluidics support for electronics and process equipment. India accounts are anticipated to select manifolds around industrial buildout and easier field service. Industrial users require manifolds able to reduce leak points and keep line layouts compact. Flow-control decisions now connect product design with application engineering and service response. Semiconductor Industry Association reported global semiconductor sales at USD 791.7 billion in 2025, influencing clean fluidics and wet-process system demand.
Buyers compare plastic valve manifolds through material behavior and supplier accountability across repeat orders. Product qualification depends on application proof and documentation quality. India’s official industrial index recorded 6.6% growth in water supply and waste management during April 2026, giving valve suppliers a clear infrastructure-linked use base.
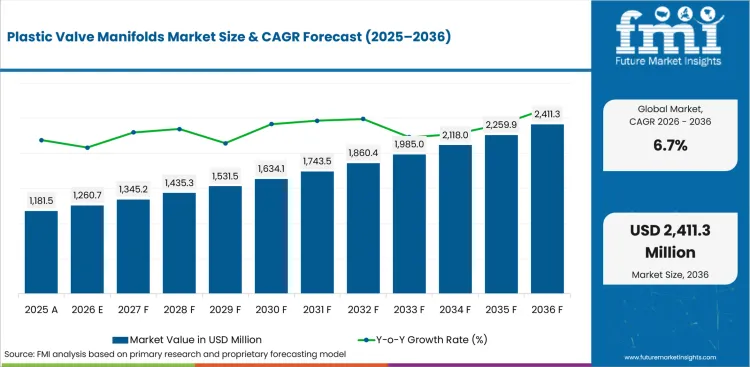
Key Takeaways
-
Demand for plastic valve manifolds is driven by OEMs' need for reduced connection complexity during machine and process-system buildout, and by plant engineers requiring repeatable fluid-control parts that support qualification records and service continuity.
-
By end use, direct OEM is expected to lead with 57.2% share in 2026, backed by application review and service control across machine buildouts.
-
Industrial processing is the dominant application segment, projected to hold 42.5% share in 2026, reflecting chemical handling and process reliability needs.
-
PP manifolds are estimated to lead the material category with 38.0% share in 2026, driven by their balance of cost and chemical resistance.
-
Material selection and direct technical support remain critical, as supplier approval now hinges on chemical/semiconductor application fit and the risk that product failure could delay commissioning and maintenance.
-
India and China are expected to form the higher-growth country tier, advancing at 9.0% and 8.0% CAGR respectively by 2036, supported by industrial buildout, manufacturing scale, and electronics supply-chain depth.
-
Competition centers on Georg Fischer Piping Systems, Parker Hannifin, SMC, Festo, IDEX, Bürkert, Swagelok, Saint-Gobain, Cole-Parmer, and Nordson MEDICAL, with vendors differentiating through engineered flow-control portfolios and application-specific fluidic expertise.
Analyst Perspective
"Success in the plastic valve manifolds market increasingly depends on more than supplying a functional component. Buyers are looking for evidence that material selection supports process reliability, long service life, and consistent operating performance. Suppliers that back their products with thorough technical documentation, engineering expertise, and application-specific guidance are better positioned to secure approvals and build lasting customer relationships."
- Nikhil Kaitwade, Principal Consultant for Industrial Automation at Future Market Insights
How is the Plastic Valve Manifolds Market segmented?
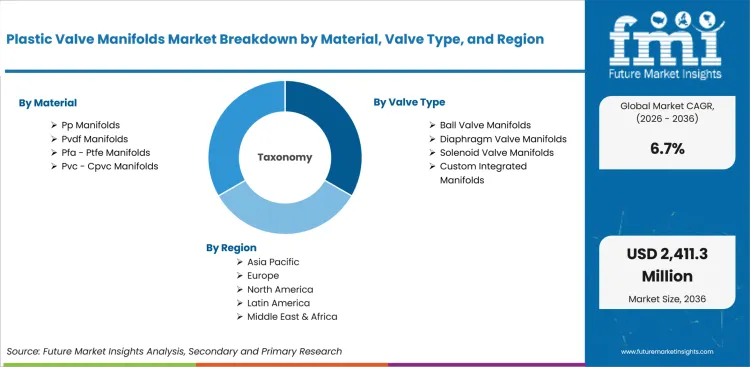
The plastic valve manifolds industry is segmented by material, valve type, application, end use, sales channel and region.
The plastic valve manifolds are segmented by material, valve type, application, end use, sales channel and region. By material, coverage includes PP manifolds, PVDF manifolds, PFA/PTFE manifolds and PVC/CPVC manifolds. By valve type, coverage includes ball valve manifolds, diaphragm valve manifolds, solenoid valve manifolds and custom integrated manifolds. By application, coverage includes chemical dosing, water treatment, semiconductor wet process and medical or lab fluidics. By end use, coverage includes industrial processing, water and wastewater, electronics and healthcare or life sciences. By sales channel, coverage includes direct OEM, fluid control distributors and system integrators, with regional coverage across North America, Latin America, Europe, East Asia, South Asia and Pacific and the Middle East and Africa.
How does direct OEM influence buying within the sales channel segment?
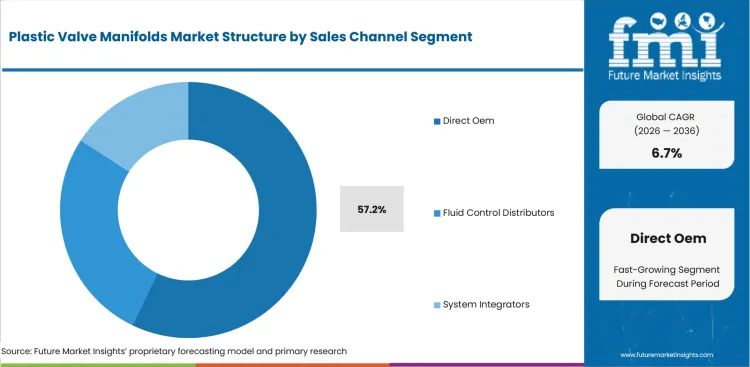
Direct OEM influences plastic valve manifold buying through design-stage access and service accountability. OEM buyers prefer a channel path being able to support prototype correction and repeat delivery after equipment approval. USA Census Bureau reported new orders for manufactured durable goods at USD 346.0 billion in April 2026, up 7.9%, supporting OEM programs aligned to equipment and system buildout.
- Direct OEM is projected to account for 57.2% share in 2026, driven by buyer preference for supplier involvement during early equipment design. Engineering teams use direct engagement to reduce approval delays and keep documentation aligned with machine-build requirements.
- Fluid control distributors and system integrators continue to support replacement orders and project-level reach. Direct OEM selection gains attention once a manifold affects equipment layout and post-installation service response.
Where does industrial processing create value within the end use segment?
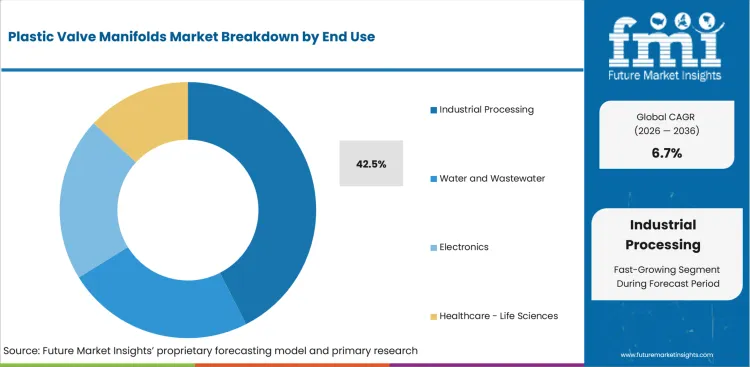
Industrial processing creates value since plastic manifolds support controlled fluid movement in chemical handling and production systems. Process engineers evaluate manifold blocks based on material compatibility and maintenance access before wider use. Federal Reserve data recorded manufacturing output as unchanged in May 2026 after a 0.7% increase in April 2026, keeping supplier review focused on parts protecting stable production conditions.
- Industrial processing is expected to represent 42.5% share in 2026, led by chemical transfer and process-line routing needs. Buyer evaluation focuses on whether the manifold can protect operating continuity without creating extra service burden.
- Water and wastewater and healthcare applications need more specialized review before supplier approval. Industrial processing continues to draw demand as plants compare manifold performance against downtime risk and replacement planning.
What keeps PP manifolds preferred within the material segment?
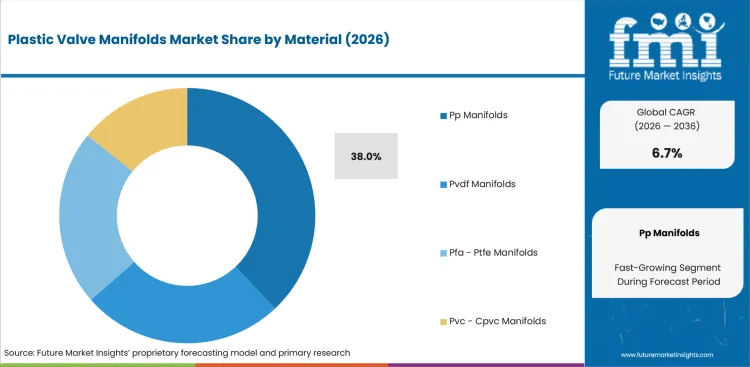
PP manifolds remain preferred in applications requiring cost balance and useful chemical resistance. Product teams use PP assemblies once general-duty fluid systems need stable routing and simple replacement without fluoropolymer-level material cost. Plastics Europe reported global plastics production reached 430.9 million tonnes in 2024, maintaining resin availability and polymer selection central to plastic fluid-control component planning.
- PP manifolds are forecast to hold 38.0% share in 2026, influenced by use across industrial processing and water-linked applications. Buyers prefer PP designs once machining quality and compatibility records are easy to review.
- PVDF and PFA/PTFE manifolds are selected for more demanding chemical and clean-process requirements. PP manifolds retain an adoption advantage in standard-duty systems requiring manageable cost and practical field replacement.
How should buyers read ball valve manifolds demand within valve type?
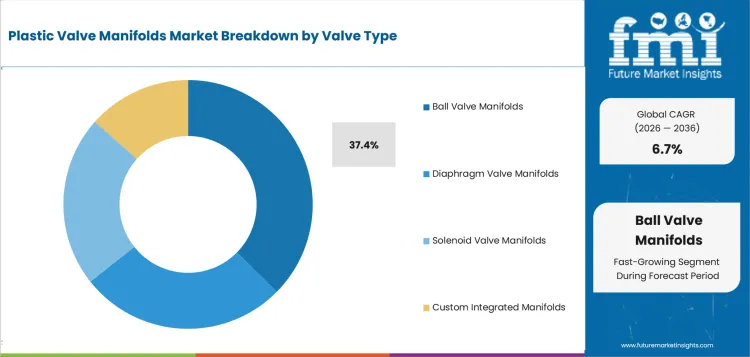
Ball valve manifolds support applications requiring mechanical shutoff and simple service access. Equipment teams compare valve layouts through isolation function and operator handling during inspection or maintenance. International Federation of Robotics reported 542,000 industrial robots installed in 2024, sustaining factory automation and valve-platform integration inside equipment design discussions.
- Ball valve manifolds are projected to hold 37.4% share in 2026, reflecting steady use in systems requiring clear shutoff control. Buyer review usually centers on actuation feel and repeatable isolation across operating cycles.
- Diaphragm and solenoid valve manifolds support cleaner flow paths or automated control duties. Ball valve manifolds keep practical value in systems prioritizing visible position control and easier field service.
Why is chemical dosing central within application demand?
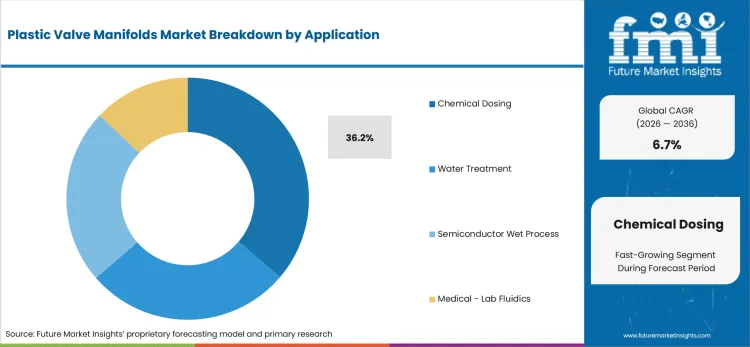
Chemical dosing is central since manifold assemblies help control fluid routing across treatment and process systems. Buyers use plastic valve manifolds to reduce connection count and keep dosing layouts easier to inspect. USA Census data placed water supply construction spending at USD 35.7 billion seasonally adjusted annual rate in April 2026, supporting dosing and treatment-system component demand.
- Chemical dosing is anticipated to represent 36.2% share in 2026, backed by use in controlled chemical delivery and process-line adjustment. Selection decisions focus on leak protection and maintenance access around pump and valve assemblies.
- Semiconductor wet process equipment and medical fluidics require tighter material validation and cleanliness review. Chemical dosing remains a practical demand base as dosing systems need repeatable routing and predictable valve operation.
What are the drivers, restraints, and opportunities in the Plastic Valve Manifolds Market?
Near-term purchases are shaped by specification control and engineering support outlined below.
- Driver: Industrial modernization and replacement demand increase need for manifold assemblies reducing installation complexity. Buyers favor products influencing repeatable performance and practical service routines.
- Restraint: Qualification time and price pressure can slow supplier change across approved equipment platforms. Adoption can weaken if technical files or service ownership are unclear.
- Opportunity: Specification-led sourcing and retrofit demand create room for suppliers with stronger design support. Suppliers can improve approval odds through clean documentation and application-level engineering guidance.
Plastic valve manifolds demand rises as buyers treat fluid-control assemblies as operating-risk tools. Water and wastewater applications need corrosion-resistant and serviceable components across pump and treatment lines. USA Census data reported sewage and waste disposal construction spending at USD 53.3 billion seasonally adjusted annual rate in April 2026, influencing demand for components used across infrastructure fluid systems.
Buyer pressure increases once material costs and supplier response times affect project margins. Pricing conversations now include installation labor and qualification delay. Office for National Statistics reported 37.0% of trading businesses saw goods and service input prices increase in May 2026, reflecting why buyers resist component upgrades without clear payback.
Opportunity is stronger in semiconductor and high-purity fluid-control systems. Plastic manifolds can support compact routing and chemical compatibility in wet-process lines. SEMI reported worldwide 300mm fab equipment spending is expected to increase 18.0% to USD 133.0 billion in 2026, giving fluid-control suppliers a measurable electronics-linked opportunity base.
Which country CAGRs are profiled in the Plastic Valve Manifolds Market?
.webp "Top Country Growth Comparison Plastic Valve Manifolds Market Cagr (2026 2036)")
| Country | CAGR |
|---|---|
| India | 9.0% |
| China | 8.0% |
| South Korea | 6.2% |
| United States | 5.6% |
| United Kingdom | 5.4% |
| Germany | 5.0% |
| Japan | 4.8% |
Source: Future Market Insights analysis, 2026.
How do country-level CAGRs compare in the Plastic Valve Manifolds Market?
The country comparison spans 4.2 percentage points and highlights three distinct growth groups across the Plastic Valve Manifolds Market. India and China form the upper growth tier with only 1.0 percentage point between them. South Korea creates a transition into the middle tier, while the United States, the United Kingdom and Germany remain closely grouped with just 0.6 percentage points separating the three markets. Japan sits 0.2 percentage points below Germany, completing the lower-growth segment. Countries with expanding industrial manufacturing, broader automation adoption and increasing demand for corrosion-resistant fluid handling components generally record stronger market growth.
-
India holds the leading position within the comparison as industrial expansion, process automation and increasing demand for corrosion-resistant fluid handling systems continue to support the adoption of plastic valve manifolds.
-
China remains 1.0 percentage point below India and reflects a market where large-scale manufacturing activity and continued investment in industrial production sustain demand for plastic valve manifolds.
-
South Korea stands 1.8 percentage points below China, highlighting the role of semiconductor manufacturing, electronics production and factory automation in supporting market growth.
-
The United States remains 0.6 percentage points below South Korea as industries continue to adopt lightweight, corrosion-resistant valve manifold systems for process control and fluid handling applications.
-
The United Kingdom remains only 0.2 percentage points below the United States, reflecting steady demand supported by industrial modernization and upgrades to processing infrastructure.
-
Germany remains 0.4 percentage points below the United Kingdom as advanced manufacturing capabilities and engineering expertise continue to support demand for high-performance plastic valve manifolds.
-
Japan remains 0.2 percentage points below Germany, reflecting a mature industrial market where precision manufacturing and consistent investment in process efficiency support steady adoption of plastic valve manifolds.
Comparable CAGRs can still produce different market entry conditions. Differences in industrial automation levels, manufacturing investment, end-use industry structure and regulatory standards influence adoption patterns and long-term market development. The full report provides country-level CAGR analysis across North America, Latin America, Europe, East Asia, South Asia, Oceania and the Middle East and Africa.
Country-wise Analysis
Country demand in plastic valve manifolds is expected to be led by water-system investment and electronics capacity. India and China connect product use with industrial expansion and cost-controlled equipment buildout. South Korea, United States, United Kingdom, Germany and Japan connect adoption with qualification discipline and supplier service depth. Senior buyers assess which countries can connect material proof with repeatable equipment performance.
- India is projected to post 9.0% CAGR by 2036, driven by industrial expansion and water-linked infrastructure needs. Official data recorded April 2026 IIP growth of 4.9% and manufacturing growth of 6.2%, giving manifold suppliers a larger industrial base for engineered fluid-control demand. Local buyers continue to compare PP and PVC-based products through price discipline and service availability across industrial estates.
- China is forecast to grow at 8.0% CAGR by 2036, influenced by manufacturing scale and electronics production depth. Official statistics reported value-added industrial output expanded 6.1% year on year in Q1 2026, with manufacturing output rising 6.4% during the same period. Supplier selection is expected to favor valve manifold producers being able to manage plant-level qualification and rapid technical response across process equipment programs.
- South Korea is projected to record 6.2% CAGR through 2036, reflected by semiconductor exports and compact automation systems. Ministry of Trade, Industry and Resources reported semiconductor exports at USD 32.8 billion in March 2026, up 151.4% year on year and above USD 30.0 billion for the first time. Plastic valve manifold suppliers can use this electronics base to support compact fluid routing and automation-linked valve platforms.
- United States is expected to expand at 5.6% CAGR through 2036, backed by industrial service networks and replacement demand. USA Census Bureau reported shipments of manufactured durable goods increased USD 3.2 billion, or 1.0%, to USD 327.9 billion in May 2026, giving valve manifold suppliers a measurable manufacturing-linked demand signal. Buyer review remains deliberate since engineering documentation and field service records propel repeat purchasing across OEM and process-system accounts.
- United Kingdom is forecast to register 5.4% CAGR by 2036, shaped by service expectations and cost pressure across manufacturing buyers. Office for National Statistics reported UK manufacturers’ product sales at GBP 452.2 billion in 2024, down 3.1% from 2023, creating stronger pressure for components protecting installation efficiency and avoid repeat service cost. Plastic manifold suppliers can improve approval odds through practical application support and distributor availability for replacement programs.
- Germany is anticipated to grow at 5.0% CAGR by 2036, underpinned by engineering review and specification control. Destatis reported real new orders in manufacturing rose 7.8% month on month in December 2025, with fabricated metal products up 30.2% and machinery and equipment up 11.5%. German buyers are expected to scrutinize dimensional consistency and supplier process documentation before shifting manifold volumes across industrial processing lines.
- Japan is expected to post 4.8% CAGR through 2036, aided by quality expectations and long qualification cycles. METI reported industrial production at index 103.0 in May 2026, up 0.5% from the previous month, with production expected to increase 3.7% in June 2026. Plastic valve manifold adoption is expected to favor suppliers being able to support clean assembly practices and stable part availability across equipment programs.
Who are the notable companies in the Plastic Valve Manifolds Market?
Georg Fischer Piping Systems, Parker Hannifin, SMC, Festo, IDEX, Bürkert Fluid Control Systems, Swagelok, Saint-Gobain, Cole-Parmer and Nordson MEDICAL are the notable companies influencing plastic valve manifolds and engineered fluid-control support pathways.
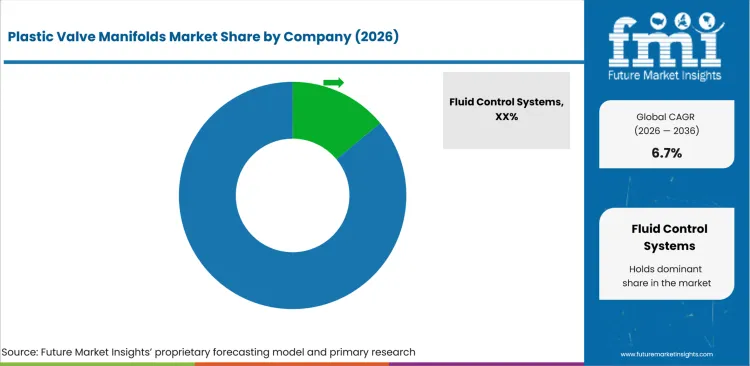
Competition in plastic valve manifolds is grouped by how buyers want product proof to work. Georg Fischer Piping Systems and Parker Hannifin are stronger in engineered flow-control and system support. SMC and Festo support automation-linked valve platforms. IDEX, Bürkert Fluid Control Systems and Swagelok strengthen competition led by process-control and instrumentation expertise. Saint-Gobain, Cole-Parmer and Nordson MEDICAL support applications requiring specialty polymer or medical fluidic knowledge.
- Georg Fischer Piping Systems has an advantage led by thermoplastic flow-control systems and engineered assemblies. Buyers can connect supplier support with polymer material selection and project design review.
- SMC and Festo support buyer review based on compact automation and manifold-linked valve platforms. Product depth helps machine builders compare footprint control and field service access.
- IDEX, Bürkert Fluid Control Systems and Swagelok strengthen competition depending on process-control portfolios and documentation support. Fluid-control programs use such capabilities once sealing performance and system continuity affect commercial outcomes.
- Parker Hannifin, Saint-Gobain, Cole-Parmer and Nordson MEDICAL compete driven by application engineering and channel reach. Buyers compare such suppliers through specification records and service availability across regional accounts.
Competitive Benchmarking: Plastic Valve Manifolds Market
| Company | Material and Valve Coverage | Engineering Support Alignment | OEM or System Integration | Geographic Reach |
|---|---|---|---|---|
| Georg Fischer Piping Systems | High | High | High | Global |
| Parker Hannifin | High | Strong | High | Global |
| SMC | Strong | High | High | Global |
| Festo | Strong | High | High | Global |
| IDEX | Strong | Medium | Strong | Global |
| Bürkert Fluid Control Systems | High | High | Strong | Global |
| Swagelok | High | Strong | Medium | Global |
| Saint-Gobain | Strong | High | Medium | Global |
| Cole-Parmer | Medium | Strong | Medium | Regional |
| Nordson MEDICAL | Strong | High | Medium | Global |
Source: Future Market Insights competitive analysis, 2026.
Key Developments in the Plastic Valve Manifolds Market
- In November 2025, Georg Fischer Piping Systems launched LiquidCore Engineered Flow Solution for direct-to-chip liquid cooling. Product architecture combines instrumentation and engineered manifolds for coolant flow stability.
- In January 2026, SMC updated JSY1000/3000/5000 plug-in compact 5-port solenoid valve product information with flame-retardant one-touch fittings for valve manifolds and IP67-compliant plug-in sub-plate type options. Product activity supports compact automation buyers needing manifold-linked valve functions in controlled equipment layouts.
- In January 2026, Festo product information for valve terminal VTUX highlighted flow rates of up to 730 l/min and lightweight high-performance polymer construction. Product positioning supports machine builders needing modular valve terminal platforms with polymer manifold sub-base options.
Key Players in the Plastic Valve Manifolds Market
Fluid Control and Piping Systems Suppliers
- Georg Fischer Piping Systems
- Parker Hannifin
- Bürkert Fluid Control Systems
- Swagelok
Automation and Manifold Platform Suppliers
- SMC
- Festo
- IDEX
Specialty Polymer and Medical Fluidic Suppliers
- Saint-Gobain
- Cole-Parmer
- Nordson MEDICAL
Plastic Valve Manifolds Market - Report Scope
| Coverage field | Report scope |
|---|---|
| Market breakdown | Plastic valve manifolds market breakdown by material, valve type, application, end use, sales channel and region |
| Market Definition | Engineered plastic manifold assemblies and related valve blocks used for controlled fluid routing across industrial processing, water treatment, electronics and healthcare or life-science applications |
| Regions Covered | North America, Latin America, Europe, East Asia, South Asia and Pacific, Middle East and Africa |
| Countries Covered | United States, China, India, Germany, United Kingdom, Japan, South Korea and 30+ countries |
| Key Companies Profiled | Georg Fischer Piping Systems, Parker Hannifin, SMC, Festo, IDEX, Bürkert Fluid Control Systems, Swagelok, Saint-Gobain, Cole-Parmer and Nordson MEDICAL |
| Forecast Period | 2026 to 2036 |
| Approach | Hybrid bottom-up and top-down methodology using material adoption, valve type, application demand, end-use intensity, supplier portfolios, sales-channel structure and country-level indicators |
Source: Future Market Insights analysis, 2026.
Plastic Valve Manifolds Market - Research Methodology
| Method | Approach |
|---|---|
| Primary Research | FMI analysts gathered input from manufacturers, service providers, technology developers, distributors, end users, sourcing teams, and subject-matter experts. Interviews examined purchasing decisions, product or service evaluation, adoption barriers, approval requirements, pricing considerations, and expectations for technical or commercial support. Respondents were also asked what evidence is required before a trial, pilot, or initial order develops into regular purchasing. |
| Desk Research | Desk research covered government statistics, regulatory publications, trade data, industry associations, technical literature, standards, company filings, product information, and official corporate announcements. Sources were reviewed for relevance, publication date, geographic coverage, and consistency with the defined market scope. Claims relating to performance, applications, approvals, capacity, investment, and commercial activity were retained only when supported by credible public evidence. |
| Market Sizing and Forecasting | The market model combined the baseline value with historical performance, segment structure, pricing and volume indicators, adoption levels, company participation, and country-level demand conditions. Forecast assumptions considered economic activity, investment trends, regulatory developments, technology adoption, purchasing cycles, supply availability, and barriers to wider market use. Segment and regional estimates were reconciled before the final market total was calculated. |
| Data Validation | Estimates were checked against multiple independent indicators, including public data, company activity, trade patterns, industry developments, and findings from primary interviews. Validation also tested whether products, services, applications, and company revenues fell within the defined market boundaries. Adjacent categories, unsupported claims, overlapping revenues, and activities without direct market relevance were excluded to reduce double counting and maintain consistency across segments and countries. |
Plastic Valve Manifolds Market by Segments
Plastic Valve Manifolds Market segmented by Material:
- PP Manifolds
- PVDF Manifolds
- PFA/PTFE Manifolds
- PVC/CPVC Manifolds
Plastic Valve Manifolds Market segmented by Valve Type:
- Ball Valve Manifolds
- Diaphragm Valve Manifolds
- Solenoid Valve Manifolds
- Custom Integrated Manifolds
Plastic Valve Manifolds Market segmented by Application:
- Chemical Dosing
- Water Treatment
- Semiconductor Wet Process
- Medical/Lab Fluidics
Plastic Valve Manifolds Market segmented by End Use:
- Industrial Processing
- Water and Wastewater
- Electronics
- Healthcare/Life Sciences
Plastic Valve Manifolds Market segmented by Sales Channel:
- Direct OEM
- Fluid Control Distributors
- System Integrators
Plastic Valve Manifolds Market by Region:
- North America
- United States
- Canada
- Latin America
- Brazil
- Mexico
- Chile
- Rest of Latin America
- Western Europe
- Germany
- United Kingdom
- Italy
- Spain
- France
- Nordic
- BENELUX
- Rest of Western Europe
- Eastern Europe
- Poland
- Hungary
- Balkan and Baltic
- Rest of Eastern Europe
- East Asia
- China
- Japan
- South Korea
- South Asia and Pacific
- India
- ASEAN
- Australia and New Zealand
- Rest of South Asia and Pacific
- Middle East and Africa
- Kingdom of Saudi Arabia
- Other GCC Countries
- Turkiye
- South Africa
- Other African Union
- Rest of Middle East and Africa
Research Sources and Bibliography
- Federal Reserve Board. (2026, June). Industrial production and capacity utilization - G.17. Federal Reserve Board.
- Festo. (2026, January). Valve terminal VTUX - Platform for the future. Festo.
- Georg Fischer Piping Systems. (2025, November 11). GF launches LiquidCore Engineered Flow Solution for direct-to-chip liquid cooling. Georg Fischer Piping Systems.
- International Federation of Robotics. (2025, September 25). World Robotics 2025 report: Industrial robots. International Federation of Robotics.
- Ministry of Economy, Trade and Industry. (2026, June 30). Indices of industrial production: Preliminary report for May 2026. Ministry of Economy, Trade and Industry.
- Ministry of Trade, Industry and Resources. (2026, April 1). March 2026 exports reach record USD 86.1 billion, surpassing USD 80 billion for the first time. Ministry of Trade, Industry and Resources.
- Office for National Statistics. (2025, July 22). UK manufacturers’ sales by product: 2024. Office for National Statistics.
- Office for National Statistics. (2026, June 18). Business insights and impact on the UK economy: 18 June 2026. Office for National Statistics.
- Plastics Europe. (2025, September). Plastics the fast facts 2025. Plastics Europe.
- Press Information Bureau. (2026, June 1). First press release of All India Index of Industrial Production of new series with base year 2022-23. Government of India.
- SEMI. (2026, April 1). SEMI projects double-digit growth in global 300mm fab equipment spending for 2026 and 2027. SEMI.
- Semiconductor Industry Association. (2026, February). Global annual semiconductor sales increase 25.6% to USD 791.7 billion in 2025. Semiconductor Industry Association.
- SMC Corporation. (2026, January). Plug-in compact 5-port solenoid valve JSY1000/3000/5000 series. SMC Corporation.
- State Council of the People’s Republic of China. (2026, April 16). China’s industrial output records faster expansion in Q1. State Council of the People’s Republic of China.
- USA Census Bureau. (2026, June 1). Monthly construction spending, April 2026. USA Census Bureau.
- USA Census Bureau. (2026, May 28). Monthly advance report on durable goods manufacturers’ shipments, inventories and orders: April 2026. USA Census Bureau.
- USA Census Bureau. (2026, June 25). Monthly advance report on durable goods manufacturers’ shipments, inventories and orders: May 2026. USA Census Bureau.
- Federal Statistical Office of Germany. (2026, February 5). New orders in manufacturing in December 2025: +7.8% on the previous month. Federal Statistical Office of Germany.
This bibliography is provided for reader reference and is not exhaustive. The full report contains the complete reference list and detailed citations.
This Report Answers
- What value is forecast for the plastic valve manifolds market in 2026 and by 2036?
- What CAGR is forecast for the plastic valve manifolds market during the 2026 to 2036 period?
- Which segment groups are used to assess plastic valve manifolds demand?
- Why do OEMs and process-system buyers use controlled plastic manifold assemblies?
- How do PP manifolds and direct OEM sales shape buying choices in 2026?
- Which countries are compared in the plastic valve manifolds forecast?
- Which companies compete across engineered flow-control and manifold support pathways?
- What applications and end uses are included within the plastic valve manifolds definition?
- How does FMI size and forecast plastic valve manifolds demand across segments and countries?
- What implementation and supplier-selection factors should executives assess?
Frequently Asked Questions
What is driving growth in the plastic valve manifolds market?
Demand is driven by specification control needs and fluid-system reliability across industrial applications. Buyers are also giving more attention to manifolds reducing connection complexity during equipment buildout.
Why should executives track the plastic valve manifolds market?
Executives are expected to track this segment as manifold approval affects equipment reliability and supplier accountability. Supplier selection can influence qualification time and service continuity across fluid-control programs.
What business problem does the plastic valve manifolds market address?
Plastic valve manifolds help OEMs and plant teams reduce uncertainty around fluid routing and repeatable installation. The segment also supports buyers requiring clearer links between component design and operating control.
What should sourcing leaders evaluate before selecting suppliers?
Sourcing leaders are likely to compare documentation quality and material compatibility before supplier approval. Engineering response and repeat-order consistency should also guide supplier review.
What can limit return on investment for buyers?
Return on investment is expected to be delayed if product proof is weak or manifold integration requires extra engineering time. Buyers can reduce such risk by setting acceptance criteria before wider use.
How can suppliers build executive confidence?
Suppliers build confidence through verified product data and accountable support during application review. Clear drawings and consistent delivery records can strengthen buyer approval.
Which companies lead plastic valve manifolds market?
Market competition is led by Georg Fischer Piping Systems and Parker Hannifin, due to engineered flow-control portfolios. SMC, Festo and Bürkert add strength driven by automation-linked manifold and valve platforms.
What demand driver supports plastic valve manifolds market?
Industrial processing demand supports manifold adoption through compact line layouts and fewer leak points. Clean fluidics applications add support across electronics and process equipment.
Preview the report firsthand - request a free sample
Get SampleGet the brochure for pricing and purchase details.
Get PDFTable of Content
- Key Takeaways
- Market Size and CAGR
- Top Growth Driver
- Fastest Growing Segment
- Leading Region
- Key Companies
- Emerging Opportunities
- Executive Summary
- Global Market Outlook
- Demand-side Trends
- Supply-side Trends
- Technology Roadmap Analysis
- Analysis and Recommendations
- Analyst Perspective (What is happening? Why now? What should investors know?)
- Key Questions Answered
- How large is the market?
- What is the CAGR?
- What are key trends?
- Which region dominates?
- Who are the leaders?
- Market Overview
- Market Coverage / Taxonomy
- Market Definition / Scope / Limitations
- Research Methodology
- Chapter Orientation
- Analytical Lens and Working Hypotheses
- Market Structure, Signals, and Trend Drivers
- Benchmarking and Cross-market Comparability
- Market Sizing, Forecasting, and Opportunity Mapping
- Research Design and Evidence Framework
- Desk Research Programme (Secondary Evidence)
- Expert Input and Fieldwork (Primary Evidence)
- Tooling, Models, and Reference Databases
- Data Engineering and Model Build
- Quality Assurance and Audit Trail
- Market Background
- Market Dynamics (Drivers, Restraints, Opportunity, Trends)
- Scenario Forecast (Optimistic, Likely, Conservative)
- Impact Analysis
- AI Impact
- Sustainability Impact
- Regulatory Impact
- Technology Impact
- Consumer / Buyer Analysis
- Purchase Drivers
- Adoption Barriers
- Buyer Journey
- Opportunity Map Analysis
- Product Life Cycle Analysis
- Supply Chain Analysis
- Investment Feasibility Matrix
- Value Chain Analysis
- PESTLE and Porter's Analysis
- Regulatory Landscape
- Regional Parent Market Outlook
- Production and Consumption Statistics
- Import and Export Statistics
- Global Market Analysis and Forecast, 2021 to 2036
- Historical Market Size Value (USD Million) & Volume (Unit) Analysis, 2021 to 2025
- Current and Future Market Size Value (USD Million) & Volume (Unit) Projections, 2026 to 2036
- Y-o-Y Growth Trend Analysis
- Absolute $ Opportunity Analysis
- Global Market Pricing Analysis, 2021 to 2036
- Global Market Analysis and Forecast, By Material, 2021 to 2036
- Introduction / Key Findings
- Historical Market Size Value (USD Million) & Volume (Unit) Analysis By Material, 2021 to 2025
- Current and Future Market Size Value (USD Million) & Volume (Unit) Analysis and Forecast By Material, 2026 to 2036
- Pp Manifolds
- Pvdf Manifolds
- Pfa - Ptfe Manifolds
- Pvc - Cpvc Manifolds
- Pp Manifolds
- Y-o-Y Growth Trend Analysis By Material, 2021 to 2025
- Absolute $ Opportunity Analysis By Material, 2026 to 2036
- Global Market Analysis and Forecast, By Valve Type, 2021 to 2036
- Introduction / Key Findings
- Historical Market Size Value (USD Million) & Volume (Unit) Analysis By Valve Type, 2021 to 2025
- Current and Future Market Size Value (USD Million) & Volume (Unit) Analysis and Forecast By Valve Type, 2026 to 2036
- Ball Valve Manifolds
- Diaphragm Valve Manifolds
- Solenoid Valve Manifolds
- Custom Integrated Manifolds
- Ball Valve Manifolds
- Y-o-Y Growth Trend Analysis By Valve Type, 2021 to 2025
- Absolute $ Opportunity Analysis By Valve Type, 2026 to 2036
- Global Market Analysis and Forecast, By Application, 2021 to 2036
- Introduction / Key Findings
- Historical Market Size Value (USD Million) & Volume (Unit) Analysis By Application, 2021 to 2025
- Current and Future Market Size Value (USD Million) & Volume (Unit) Analysis and Forecast By Application, 2026 to 2036
- Chemical Dosing
- Water Treatment
- Semiconductor Wet Process
- Medical - Lab Fluidics
- Chemical Dosing
- Y-o-Y Growth Trend Analysis By Application, 2021 to 2025
- Absolute $ Opportunity Analysis By Application, 2026 to 2036
- Global Market Analysis and Forecast, By End Use, 2021 to 2036
- Introduction / Key Findings
- Historical Market Size Value (USD Million) & Volume (Unit) Analysis By End Use, 2021 to 2025
- Current and Future Market Size Value (USD Million) & Volume (Unit) Analysis and Forecast By End Use, 2026 to 2036
- Industrial Processing
- Water and Wastewater
- Electronics
- Healthcare - Life Sciences
- Industrial Processing
- Y-o-Y Growth Trend Analysis By End Use, 2021 to 2025
- Absolute $ Opportunity Analysis By End Use, 2026 to 2036
- Global Market Analysis and Forecast, By Sales Channel, 2021 to 2036
- Introduction / Key Findings
- Historical Market Size Value (USD Million) & Volume (Unit) Analysis By Sales Channel, 2021 to 2025
- Current and Future Market Size Value (USD Million) & Volume (Unit) Analysis and Forecast By Sales Channel, 2026 to 2036
- Direct Oem
- Fluid Control Distributors
- System Integrators
- Direct Oem
- Y-o-Y Growth Trend Analysis By Sales Channel, 2021 to 2025
- Absolute $ Opportunity Analysis By Sales Channel, 2026 to 2036
- Global Market Analysis and Forecast, By Region, 2021 to 2036
- Introduction
- Historical Market Size Value (USD Million) & Volume (Unit) Analysis By Region, 2021 to 2025
- Current Market Size Value (USD Million) & Volume (Unit) Analysis and Forecast By Region, 2026 to 2036
- North America
- Latin America
- Western Europe
- Eastern Europe
- East Asia
- South Asia and Pacific
- Middle East & Africa
- Market Attractiveness Analysis By Region
- North America Market Analysis and Forecast, By Country, 2021 to 2036
- Historical Market Size Value (USD Million) & Volume (Unit) Trend Analysis By Market Taxonomy, 2021 to 2025
- Market Size Value (USD Million) & Volume (Unit) Forecast By Market Taxonomy, 2026 to 2036
- By Country
- USA
- Canada
- Mexico
- By Material
- By Valve Type
- By Application
- By End Use
- By Sales Channel
- By Country
- Market Attractiveness Analysis
- By Country
- By Material
- By Valve Type
- By Application
- By End Use
- By Sales Channel
- Key Takeaways
- Latin America Market Analysis and Forecast, By Country
- Historical Market Size Value (USD Million) & Volume (Unit) Trend Analysis By Market Taxonomy, 2021 to 2025
- Market Size Value (USD Million) & Volume (Unit) Forecast By Market Taxonomy, 2026 to 2036
- By Country
- Brazil
- Chile
- Rest of Latin America
- By Material
- By Valve Type
- By Application
- By End Use
- By Sales Channel
- By Country
- Market Attractiveness Analysis
- By Country
- By Material
- By Valve Type
- By Application
- By End Use
- By Sales Channel
- Key Takeaways
- Western Europe Market Analysis and Forecast, By Country
- Historical Market Size Value (USD Million) & Volume (Unit) Trend Analysis By Market Taxonomy, 2021 to 2025
- Market Size Value (USD Million) & Volume (Unit) Forecast By Market Taxonomy, 2026 to 2036
- By Country
- Germany
- UK
- Italy
- Spain
- France
- Nordic
- BENELUX
- Rest of Western Europe
- By Material
- By Valve Type
- By Application
- By End Use
- By Sales Channel
- By Country
- Market Attractiveness Analysis
- By Country
- By Material
- By Valve Type
- By Application
- By End Use
- By Sales Channel
- Key Takeaways
- Eastern Europe Market Analysis and Forecast, By Country
- Historical Market Size Value (USD Million) & Volume (Unit) Trend Analysis By Market Taxonomy, 2021 to 2025
- Market Size Value (USD Million) & Volume (Unit) Forecast By Market Taxonomy, 2026 to 2036
- By Country
- Russia
- Poland
- Hungary
- Balkan & Baltic
- Rest of Eastern Europe
- By Material
- By Valve Type
- By Application
- By End Use
- By Sales Channel
- By Country
- Market Attractiveness Analysis
- By Country
- By Material
- By Valve Type
- By Application
- By End Use
- By Sales Channel
- Key Takeaways
- East Asia Market Analysis and Forecast, By Country
- Historical Market Size Value (USD Million) & Volume (Unit) Trend Analysis By Market Taxonomy, 2021 to 2025
- Market Size Value (USD Million) & Volume (Unit) Forecast By Market Taxonomy, 2026 to 2036
- By Country
- China
- Japan
- South Korea
- By Material
- By Valve Type
- By Application
- By End Use
- By Sales Channel
- By Country
- Market Attractiveness Analysis
- By Country
- By Material
- By Valve Type
- By Application
- By End Use
- By Sales Channel
- Key Takeaways
- South Asia and Pacific Market Analysis and Forecast, By Country
- Historical Market Size Value (USD Million) & Volume (Unit) Trend Analysis By Market Taxonomy, 2021 to 2025
- Market Size Value (USD Million) & Volume (Unit) Forecast By Market Taxonomy, 2026 to 2036
- By Country
- India
- ASEAN
- Australia & New Zealand
- Rest of South Asia and Pacific
- By Material
- By Valve Type
- By Application
- By End Use
- By Sales Channel
- By Country
- Market Attractiveness Analysis
- By Country
- By Material
- By Valve Type
- By Application
- By End Use
- By Sales Channel
- Key Takeaways
- Middle East & Africa Market Analysis and Forecast, By Country
- Historical Market Size Value (USD Million) & Volume (Unit) Trend Analysis By Market Taxonomy, 2021 to 2025
- Market Size Value (USD Million) & Volume (Unit) Forecast By Market Taxonomy, 2026 to 2036
- By Country
- Kingdom of Saudi Arabia
- Other GCC Countries
- Türkiye
- South Africa
- Other African Union
- Rest of Middle East & Africa
- By Material
- By Valve Type
- By Application
- By End Use
- By Sales Channel
- By Country
- Market Attractiveness Analysis
- By Country
- By Material
- By Valve Type
- By Application
- By End Use
- By Sales Channel
- Key Takeaways
- Key Countries Market Analysis
- USA
- Pricing Analysis
- Market Share Analysis, 2025
- By Material
- By Valve Type
- By Application
- By End Use
- By Sales Channel
- Canada
- Pricing Analysis
- Market Share Analysis, 2025
- By Material
- By Valve Type
- By Application
- By End Use
- By Sales Channel
- Mexico
- Pricing Analysis
- Market Share Analysis, 2025
- By Material
- By Valve Type
- By Application
- By End Use
- By Sales Channel
- Brazil
- Pricing Analysis
- Market Share Analysis, 2025
- By Material
- By Valve Type
- By Application
- By End Use
- By Sales Channel
- Chile
- Pricing Analysis
- Market Share Analysis, 2025
- By Material
- By Valve Type
- By Application
- By End Use
- By Sales Channel
- Germany
- Pricing Analysis
- Market Share Analysis, 2025
- By Material
- By Valve Type
- By Application
- By End Use
- By Sales Channel
- UK
- Pricing Analysis
- Market Share Analysis, 2025
- By Material
- By Valve Type
- By Application
- By End Use
- By Sales Channel
- Italy
- Pricing Analysis
- Market Share Analysis, 2025
- By Material
- By Valve Type
- By Application
- By End Use
- By Sales Channel
- Spain
- Pricing Analysis
- Market Share Analysis, 2025
- By Material
- By Valve Type
- By Application
- By End Use
- By Sales Channel
- France
- Pricing Analysis
- Market Share Analysis, 2025
- By Material
- By Valve Type
- By Application
- By End Use
- By Sales Channel
- India
- Pricing Analysis
- Market Share Analysis, 2025
- By Material
- By Valve Type
- By Application
- By End Use
- By Sales Channel
- ASEAN
- Pricing Analysis
- Market Share Analysis, 2025
- By Material
- By Valve Type
- By Application
- By End Use
- By Sales Channel
- Australia & New Zealand
- Pricing Analysis
- Market Share Analysis, 2025
- By Material
- By Valve Type
- By Application
- By End Use
- By Sales Channel
- China
- Pricing Analysis
- Market Share Analysis, 2025
- By Material
- By Valve Type
- By Application
- By End Use
- By Sales Channel
- Japan
- Pricing Analysis
- Market Share Analysis, 2025
- By Material
- By Valve Type
- By Application
- By End Use
- By Sales Channel
- South Korea
- Pricing Analysis
- Market Share Analysis, 2025
- By Material
- By Valve Type
- By Application
- By End Use
- By Sales Channel
- Russia
- Pricing Analysis
- Market Share Analysis, 2025
- By Material
- By Valve Type
- By Application
- By End Use
- By Sales Channel
- Poland
- Pricing Analysis
- Market Share Analysis, 2025
- By Material
- By Valve Type
- By Application
- By End Use
- By Sales Channel
- Hungary
- Pricing Analysis
- Market Share Analysis, 2025
- By Material
- By Valve Type
- By Application
- By End Use
- By Sales Channel
- Kingdom of Saudi Arabia
- Pricing Analysis
- Market Share Analysis, 2025
- By Material
- By Valve Type
- By Application
- By End Use
- By Sales Channel
- Türkiye
- Pricing Analysis
- Market Share Analysis, 2025
- By Material
- By Valve Type
- By Application
- By End Use
- By Sales Channel
- South Africa
- Pricing Analysis
- Market Share Analysis, 2025
- By Material
- By Valve Type
- By Application
- By End Use
- By Sales Channel
- USA
- Market Structure Analysis
- Competition Dashboard
- Competition Benchmarking
- Market Share Analysis of Top Players
- By Regional
- By Material
- By Valve Type
- By Application
- By End Use
- By Sales Channel
- Emerging Startups
- Innovation Benchmarking
- Competition Analysis
- Competition Deep Dive
- Fluid Control Systems
- Overview
- Product Portfolio
- Profitability by Market Segments (Product/Region/Sales Channel)
- Sales Footprint
- Strategy Overview
- Marketing Strategy
- Product Strategy
- Channel Strategy
- Swagelok
- Saint-Gobain
- Cole-Parmer
- Nordson MEDICAL
- Fluid Control Systems
- Case Studies
- Success Stories
- Recent Developments
- Competition Deep Dive
- Assumptions & Acronyms Used


