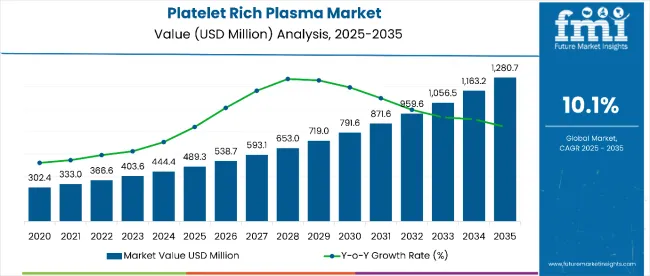
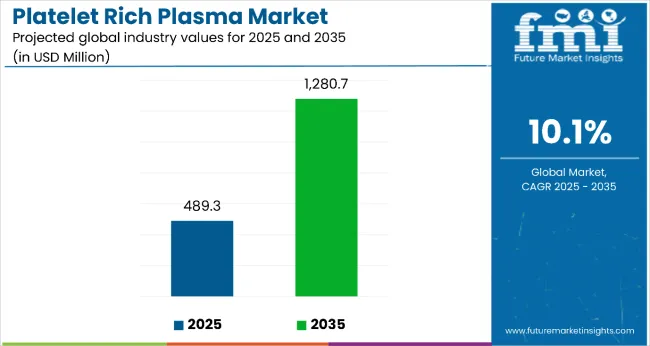
The platelet-rich plasma market is estimated to be valued at USD 489.3 million in 2025. It is projected to reach USD 1,280.7 million by 2035, registering a compound annual growth rate (CAGR) of 10.1% over the forecast period. The market is projected to add an absolute dollar opportunity of USD 791.4 million over the forecast period. This reflects a 2.62 times growth at a compound annual growth rate of 10.1%. The market's evolution is expected to be shaped by the rising prevalence of orthopedic conditions, breakthrough regenerative medicine therapies, advanced tissue repair treatments, and growing demand for non-surgical procedures, particularly where autologous healing and minimally invasive care are required.
By 2030, the market is likely to reach USD 791.6 million, adding USD 302.3 million in incremental value over the first half of the decade. The remaining USD 489.1 million is expected during the second half, suggesting moderately accelerated growth. Product innovation in platelet separation technologies, growth factor concentration methods, and point-of-care processing systems is gaining traction.
Companies such as Zimmer Biomet Holdings Inc. and Arthrex, Inc. are advancing their competitive positions through investment in advanced PRP technology development, clinical validation programs, and global distribution networks. Rising healthcare awareness, expanding access to orthopedic specialists, and improved treatment protocols are supporting expansion into hospitals, sports medicine clinics, and aesthetic medicine applications. Market performance will remain anchored in clinical efficacy standards, safety profiles, and treatment accessibility benchmarks.
Healthcare practitioners evaluate platelet-rich plasma preparation systems based on platelet concentration capabilities, processing consistency, and contamination prevention features when establishing regenerative treatment protocols for orthopedic injuries, aesthetic enhancement, and chronic wound management applications. Equipment selection involves analyzing centrifugation efficiency, platelet activation methods, and sterile processing requirements while considering treatment volume capacity, preparation time constraints, and regulatory compliance standards necessary for clinical implementation. Procurement decisions balance initial equipment investment against treatment revenue potential including procedure pricing, patient demand levels, and competitive differentiation that influence practice profitability and clinical outcomes.
Processing operations require specialized centrifugation systems, sterile collection protocols, and quality control procedures that ensure optimal platelet concentration while maintaining viability and preventing bacterial contamination throughout preparation workflows. Laboratory coordination involves managing blood collection schedules, processing equipment maintenance, and result documentation while maintaining clinical laboratory standards and regulatory compliance requirements. Quality assurance procedures address platelet count verification, sterility testing, and activation assessment that validate treatment preparation quality while supporting clinical efficacy and patient safety standards.
| Metric | Value |
|---|---|
| Estimated Size (2025E) | USD 489.3 million |
| Projected Value (2035F) | USD 1,280.7 million |
| CAGR (2025 to 2035) | 10.1% |
The market accounts for 12.3% of the global regenerative medicine segment, driven by its autologous healing properties. In the orthopedic biologics segment, it commands an 18.7% share, supported by proven efficacy in tissue repair. It contributes nearly 8.9% to the sports medicine market and 15.4% to the aesthetic medicine segment. In wound healing applications, platelet-rich plasma treatments hold around 11.2% share, driven by natural healing acceleration properties. Across the minimally invasive procedures market, its share is close to 6.8%, owing to its position as a leading non-surgical regenerative treatment option.
The market is undergoing a strategic transformation driven by rising demand for autologous healing therapies, personalized regenerative approaches, and comprehensive tissue repair solutions. Advanced therapeutic technologies using concentrated platelet preparations, growth factor optimization, and innovative delivery systems have enhanced treatment efficacy, safety profiles, and patient outcomes, making platelet-rich plasma treatments viable alternatives to traditional surgical interventions. Manufacturers are introducing specialized preparation systems, including point-of-care devices and standardized protocols tailored for different clinical applications, expanding their role beyond symptom management to active tissue regeneration. Strategic collaborations between medical device companies and healthcare institutions have accelerated innovation in PRP technology development and market penetration.
The platelet-rich plasma market's exceptional growth is driven by increasing adoption of regenerative medicine, breakthrough autologous healing therapies, and expanding minimally invasive treatment access, making it an attractive therapeutic area for medical device companies and healthcare providers seeking innovative healing solutions. The rising preference for non-surgical treatments, improved clinical evidence, and growing awareness of natural healing mechanisms appeal to patients and healthcare providers prioritizing faster recovery and reduced surgical risks.
A growing understanding of platelet biology, personalized medicine approaches, and evidence-based treatment protocols is further propelling adoption, particularly in orthopedic medicine, sports medicine, and aesthetic applications. Rising healthcare expenditure, expanding insurance coverage, and regulatory approvals for PRP devices are also enhancing treatment accessibility and market penetration.
As regenerative medicine and personalized therapies accelerate across healthcare systems and minimally invasive care becomes increasingly important, the market outlook remains highly favorable. With patients and providers prioritizing treatment safety, natural healing, and optimal outcomes, platelet-rich plasma treatments are well-positioned to expand across various therapeutic, hospital, and specialty clinic applications.
The market is segmented by product, origin, application, and region. By product, the market is divided into pure-platelet-rich plasma (P-PRP), leukocyte-platelet-rich plasma (L-PRP), and leukocyte-platelet-rich fibrin (L-PRF). Based on origin, the market is categorized into autologous, homologous, and allogenic. In terms of application, the market is segmented into orthopedic surgery, cosmetic surgery, general surgery, neurosurgery, and other surgeries. Regionally, the market is divided into North America, Europe, Asia Pacific, Latin America, and the Middle East & Africa.
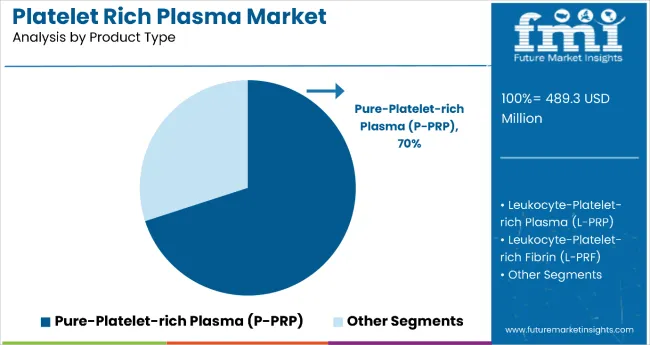
The pure-platelet-rich plasma (P-PRP) segment holds a dominant position with 70% of the market share in the product category, owing to its superior platelet concentration, enhanced growth factor release, and optimal therapeutic efficacy in tissue regeneration applications. P-PRP is widely used across orthopedic and aesthetic medicine settings due to its standardized preparation methods, consistent clinical outcomes, and reduced risk of adverse reactions compared to leukocyte-containing formulations.
It enables healthcare providers and patients to achieve predictable healing responses while maintaining excellent safety standards and treatment reproducibility across diverse clinical scenarios. As demand for standardized protocols, evidence-based treatments, and optimal therapeutic outcomes grows, the P-PRP segment continues to gain preference in both surgical and non-surgical regenerative applications.
Manufacturers are investing in advanced preparation technologies, automated processing systems, and standardized protocols to enhance purity, improve consistency, and optimize clinical outcomes. The segment is poised to grow further as global treatment guidelines favor pure platelet formulations and clinical evidence supports superior therapeutic benefits.
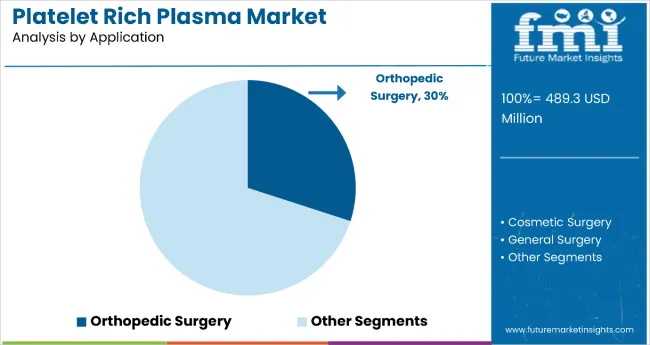
Orthopedic surgery remains a core application segment with 30% of the market share in 2025, as it provides essential tissue repair support, accelerated healing, and enhanced surgical outcomes for musculoskeletal injuries and degenerative conditions. The functional expertise supports tendon repair, ligament reconstruction, and cartilage regeneration in patients requiring advanced orthopedic interventions and sports medicine applications.
Orthopedic applications also ensure optimal biological enhancement for bone healing, soft tissue repair, and post-operative recovery, while offering integrated care coordination with surgical procedures. This makes them indispensable in modern sports medicine and orthopedic treatment environments.
Ongoing demand for minimally invasive procedures and the specialization required for complex musculoskeletal conditions are key trends driving the sustained relevance of orthopedic applications in the platelet-rich plasma therapeutic area.
In 2024, global platelet-rich plasma adoption grew by 18% year-on-year, with North America taking a 43% share. Applications include orthopedic treatments, aesthetic procedures, and wound healing management. Manufacturers are introducing specialized preparation systems and standardized treatment protocols that deliver superior efficacy profiles and patient-centered outcomes. Autologous formulations now support personalized medicine positioning. Evidence-based treatment guidelines and clinical validation studies support the confidence of healthcare providers. Technology providers increasingly supply point-of-care processing systems with integrated quality control measures to reduce preparation complexity.
Advanced PRP Technology Accelerates Treatment Adoption
Healthcare systems and medical practices are choosing advanced PRP preparation systems to achieve superior treatment outcomes, enhance patient safety, and meet growing demands for standardized, effective regenerative solutions. In clinical studies, advanced PRP systems increase platelet concentration by up to 85% compared with basic preparation methods, which typically operate at about 15-25% processing efficiency. Automated processing systems maintain consistency across processing cycles and clinical use. In specialty care settings, integrated PRP programs help reduce preparation variability while maintaining safety standards by up to 75%. Advanced applications are now being deployed for complex orthopedic procedures, increasing adoption in sectors demanding comprehensive regenerative care. These advantages help explain why advanced PRP system adoption rates in healthcare rose 42% in 2024 across North America and Europe.
Cost Considerations and Training Requirements Limit Growth
Market expansion faces constraints due to equipment costs, training requirements, and standardization challenges. Advanced PRP preparation systems can range from USD 15,000 to USD 50,000, depending on automation level and processing capabilities, impacting clinic adoption and leading to implementation delays of up to 4 months in some healthcare settings. Training requirements and certification processes add 2 to 6 weeks to implementation timelines. Specialized storage conditions and quality control protocols extend operational costs by 25-35% compared to conventional treatment methods. Limited availability of trained technicians restricts scalable implementation, especially for complex preparation protocols. These constraints make advanced PRP adoption challenging in cost-sensitive healthcare environments despite growing clinical evidence and treatment demand.
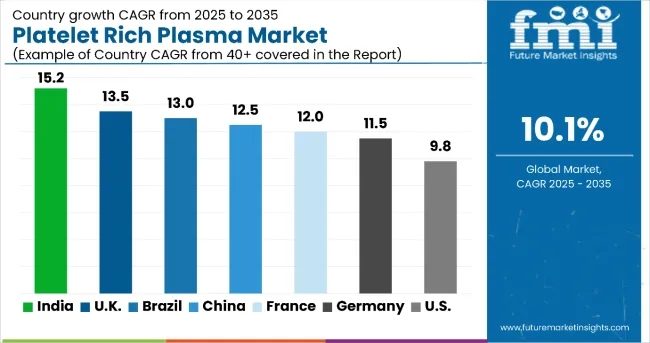
| Country | CAGR (2025 to 2035) |
|---|---|
| India | 15.2% |
| Brazil | 13.0% |
| UK | 13.5% |
| China | 12.5% |
| France | 12.0% |
| Germany | 11.5% |
| USA | 9.8% |
In the platelet-rich plasma market, India leads with the highest projected CAGR of 15.2% from 2025 to 2035, driven by rapid healthcare infrastructure development, increasing sports medicine adoption, and expanding access to regenerative therapies. The UK follows closely with a CAGR of 13.5%, supported by NHS coverage improvements and growing aesthetic medicine applications. Brazil shows strong growth at 13.0%, benefiting from advancing healthcare systems and rising medical tourism. China demonstrates robust expansion at 12.5%, driven by increasing orthopedic applications and the management of sports injuries. France and Germany show consistent growth at 12.0% and 11.5% respectively, supported by established healthcare systems and specialty care networks. The USA, with a CAGR of 9.8%, experiences steady expansion in a mature market, supported by advanced healthcare infrastructure and established treatment protocols.
The report covers an in-depth analysis of 40+ countries; seven top-performing regions are highlighted below.
Revenue from platelet-rich plasma treatments in India is projected to grow at a CAGR of 15.2% from 2025 to 2035, significantly exceeding the global average. Growth is fueled by rising sports medicine adoption, expanding healthcare infrastructure, and increasing access to regenerative therapies across major urban centers, including Mumbai, Delhi, and Bangalore. Indian healthcare systems are increasingly adopting advanced PRP protocols as medical insurance coverage improves and orthopedic specialty services expand.
Key Statistics:
The platelet-rich plasma market in the USA is anticipated to expand at a CAGR of 9.8% from 2025 to 2035, reflecting mature market dynamics with a focus on treatment optimization. Growth is centered on advanced PRP applications and specialty care expansion in California, Texas, and Florida regions. Standardized treatment protocols and insurance coverage improvements are being deployed for orthopedic applications, sports medicine, and comprehensive regenerative care. FDA regulatory frameworks and clinical guidelines support the development of practical treatment applications across diverse healthcare settings.
Key Statistics:
Sales of platelet-rich plasma treatments in China are slated to flourish at a CAGR of 12.5% from 2025 to 2035, approaching regional leadership levels. Growth has been concentrated in urban healthcare expansion and specialty care development in Beijing, Shanghai, and Guangzhou regions. Treatment adoption is shifting from basic applications toward comprehensive orthopedic and aesthetic medicine approaches. Local healthcare infrastructure improvements and international medical device partnerships are leading commercial deployment strategies.
Key Statistics:
The demand for platelet-rich plasma treatments in Germany is expected to increase at a CAGR of 11.5% from 2025 to 2035, exceeding the mature market average. Demand is driven by advanced healthcare systems, robust research infrastructure, and comprehensive insurance coverage in Berlin, Munich, and Hamburg markets. Evidence-based treatment protocols and specialized orthopedic centers are increasingly adopting PRP therapies for optimal patient outcomes.
Key Statistics:
Revenue from platelet-rich plasma treatments in France is projected to rise at a CAGR of 12.0% from 2025 to 2035, supported by strong demand for orthopedic applications and integrated care management. Healthcare systems in Paris, Lyon, and Marseille are experiencing expansion in specialty orthopedic services, evidence-based treatment protocols, and patient-centered care approaches. French healthcare institutions are leveraging advanced PRP technologies to meet quality expectations for comprehensive regenerative medicine.
Key Statistics:
The platelet-rich plasma market in the UK is expected to grow at a CAGR of 13.5% from 2025 to 2035, reflecting strong mature market expansion. Growth is driven by NHS coverage improvements and specialty care optimization in the London, Manchester, and Birmingham regions. Integrated treatment pathways and orthopedic specialist networks are expanding treatment accessibility, while healthcare providers incorporate evidence-based protocols into comprehensive care programs.
Key Statistics:
The demand for platelet-rich plasma treatments in Brazil is projected to expand at a CAGR of 13.0% from 2025 to 2035, driven by healthcare system improvements and expanding access to regenerative medicine. Growth is concentrated in urban healthcare markets, including São Paulo, Rio de Janeiro, and Brasília, where orthopedic services and treatment accessibility are expanding. Healthcare infrastructure investments and international medical device partnerships are gradually building comprehensive treatment capabilities.
Key Statistics:
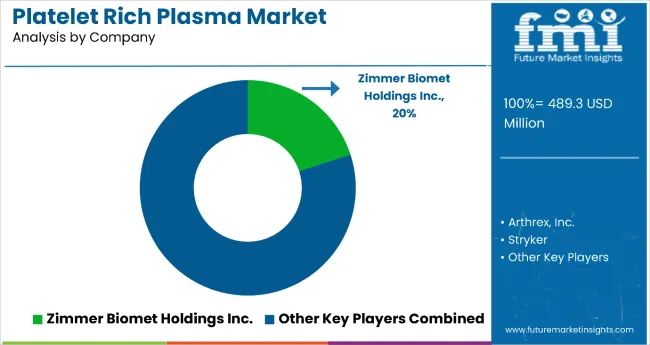
The platelet rich plasma (PRP) market is highly competitive, shaped by advancements in regenerative medicine, orthopedic applications, and aesthetic treatments. Harvest Technologies Corp., Zimmer Biomet Holdings Inc., and Arthrex Inc. lead the global market with strong portfolios in autologous platelet concentration systems and advanced PRP preparation devices used in sports medicine, wound healing, and musculoskeletal therapy. Their continued innovation in centrifugation technologies and point-of-care systems enhances treatment precision and patient outcomes.
Arteriocyte Medical Systems Inc. (a subsidiary of Medline Industries) and ThermoGenesis Holdings Inc. (formerly Cesca Therapeutics Inc.) focus on developing automated PRP preparation systems that deliver consistent platelet concentrations and improved clinical reproducibility. Regen Lab SA plays a pivotal role in the European market, offering CE-certified PRP and regenerative biomaterial solutions used widely across dermatology and orthopedics.
Global healthcare leaders Johnson & Johnson Services Inc. and Stryker Corporation strengthen market competitiveness through their extensive R&D capabilities, integrating PRP therapies into broader regenerative medicine and orthopedic device portfolios. Apex Biologix adds further diversity with its affordable PRP kits and physician training programs, catering to clinics and sports medicine centers.
| Items | Value |
|---|---|
| Quantitative Units (2025) | USD 489.3 Million |
| Product | Pure-Platelet-rich Plasma (P-PRP), Leukocyte-Platelet-rich Plasma (L-PRP), Leukocyte-Platelet-rich Fibrin (L-PRF) |
| Origin | Autologous, Homologous, Allogenic |
| Application | Orthopedic Surgery, Cosmetic Surgery, General Surgery, Neurosurgery, Other Surgeries |
| Regions Covered | North America, Europe, Asia Pacific, Latin America, Middle East & Africa |
| Countries Covered | United States, Canada, United Kingdom, Germany, France, China, Japan, South Korea, Brazil, Australia, India and 40+ Countries |
| Key Companies Profiled |
Harvest Technologies Corp., Zimmer Biomet Holdings Inc., Arthrex Inc., Arteriocyte Medical Systems Inc. (a subsidiary of Medline Industries), ThermoGenesis Holdings Inc. (formerly Cesca Therapeutics Inc.), Regen Lab SA, Johnson & Johnson Services Inc., Stryker Corporation, Apex Biologix |
| Additional Attributes | Dollar sales by application and product, regional demand trends, competitive landscape, consumer and physician preferences for autologous versus allogeneic PRP, integration with regulatory and quality standards, innovations in preparation technology and standardization for diverse clinical applications |
In terms of product type, the industry is divided into pure-platelet-rich plasma (P-PRP), leukocyte-platelet-rich plasma (L-PRP) and leukocyte-platelet-rich fibrin (L-PRF).
In terms of origin, the industry is divided into autologous, homologous and allogenic.
In terms of application, the industry is segregated into orthopedic surgery, cosmetic surgery, general surgery, neurosurgery and other surgeries
Key countries of North America, Latin America, Eastern Europe, Western Europe, East Asia, South Asia & Pacific, and Middle East and Africa (MEA), have been covered in the report.
The global platelet rich plasma market is estimated to be valued at USD 489.3 million in 2025.
The market size for platelet rich plasma is projected to reach USD 1,280.7 million by 2035.
The platelet rich plasma market is expected to grow at a 10.1% CAGR between 2025 and 2035.
The pure-platelet-rich plasma (P-PRP) segment is projected to lead in the platelet rich plasma market with 70% market share in 2025.
In terms of application, the orthopedic surgery segment is projected to command 30% share in the platelet rich plasma market in 2025.


Our Research Products

The "Full Research Suite" delivers actionable market intel, deep dives on markets or technologies, so clients act faster, cut risk, and unlock growth.

The Leaderboard benchmarks and ranks top vendors, classifying them as Established Leaders, Leading Challengers, or Disruptors & Challengers.

Locates where complements amplify value and substitutes erode it, forecasting net impact by horizon

We deliver granular, decision-grade intel: market sizing, 5-year forecasts, pricing, adoption, usage, revenue, and operational KPIs—plus competitor tracking, regulation, and value chains—across 60 countries broadly.

Spot the shifts before they hit your P&L. We track inflection points, adoption curves, pricing moves, and ecosystem plays to show where demand is heading, why it is changing, and what to do next across high-growth markets and disruptive tech

Real-time reads of user behavior. We track shifting priorities, perceptions of today’s and next-gen services, and provider experience, then pace how fast tech moves from trial to adoption, blending buyer, consumer, and channel inputs with social signals (#WhySwitch, #UX).

Partner with our analyst team to build a custom report designed around your business priorities. From analysing market trends to assessing competitors or crafting bespoke datasets, we tailor insights to your needs.
Supplier Intelligence
Discovery & Profiling
Capacity & Footprint
Performance & Risk
Compliance & Governance
Commercial Readiness
Who Supplies Whom
Scorecards & Shortlists
Playbooks & Docs
Category Intelligence
Definition & Scope
Demand & Use Cases
Cost Drivers
Market Structure
Supply Chain Map
Trade & Policy
Operating Norms
Deliverables
Buyer Intelligence
Account Basics
Spend & Scope
Procurement Model
Vendor Requirements
Terms & Policies
Entry Strategy
Pain Points & Triggers
Outputs
Pricing Analysis
Benchmarks
Trends
Should-Cost
Indexation
Landed Cost
Commercial Terms
Deliverables
Brand Analysis
Positioning & Value Prop
Share & Presence
Customer Evidence
Go-to-Market
Digital & Reputation
Compliance & Trust
KPIs & Gaps
Outputs
Full Research Suite comprises of:
Market outlook & trends analysis
Interviews & case studies
Strategic recommendations
Vendor profiles & capabilities analysis
5-year forecasts
8 regions and 60+ country-level data splits
Market segment data splits
12 months of continuous data updates
DELIVERED AS:
PDF EXCEL ONLINE
Europe Platelet Rich Plasma (PRP) Market Growth – Trends & Forecast 2025 to 2035
Platelet Shaker Market Size and Share Forecast Outlook 2025 to 2035
Platelet Concentration Systems Market Size and Share Forecast Outlook 2025 to 2035
Platelet Function Test Market Report - Growth & Forecast 2025 to 2035
Rich Communication Services (RCS) Messaging Market Size and Share Forecast Outlook 2025 to 2035
Trichomonas Rapid Tests Market Size and Share Forecast Outlook 2025 to 2035
Market Share Insights of Leading Trichlorosilane Providers
Trichloroisocyanuric Acid Market Growth - Trends & Forecast 2024 to 2034
Lipid Rich Powder Market
Context-Rich System Market Size and Share Forecast Outlook 2025 to 2035
Mineral Enrichment Ingredients Market Size and Share Forecast Outlook 2025 to 2035
Tocopherol-Rich Antioxidants Market Analysis - Size and Share Forecast Outlook 2025 to 2035
Antioxidant-Rich Skincare Market Analysis - Size and Share Forecast Outlook 2025 to 2035
Antioxidant-Rich Fruit Oils Market Analysis - Size and Share Forecast Outlook 2025 to 2035
Antioxidant-Rich Sea Buckthorn Market Analysis - Size and Share Forecast Outlook 2025 to 2035
Stigmasterol-Rich Plant Sterols Market Analysis by Source and Application others Through 2035
Phosphorus Enriched Organic Manure Market Growth – Trends & Forecast 2024-2034
Resveratrol Enriched Formulas Market Size and Share Forecast Outlook 2025 to 2035
Phosphorothioic Trichloride Market Size and Share Forecast Outlook 2025 to 2035
Demand of MFGM-enriched Powders & RTDs in European Union Size and Share Forecast Outlook 2025 to 2035

Thank you!
You will receive an email from our Business Development Manager. Please be sure to check your SPAM/JUNK folder too.
Chat With
MaRIA