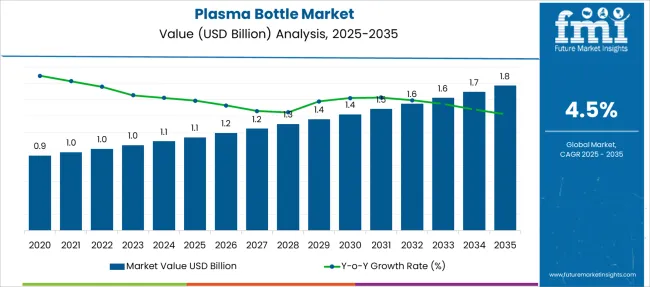
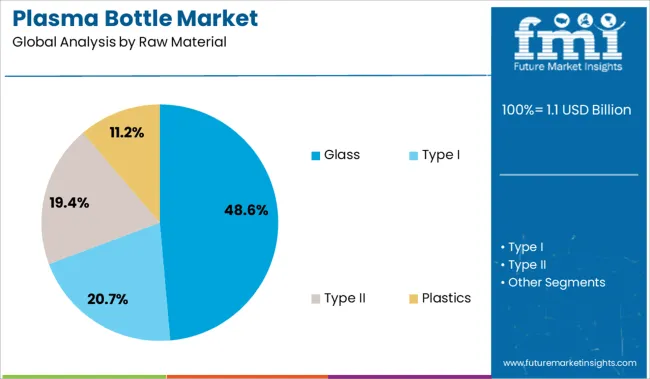
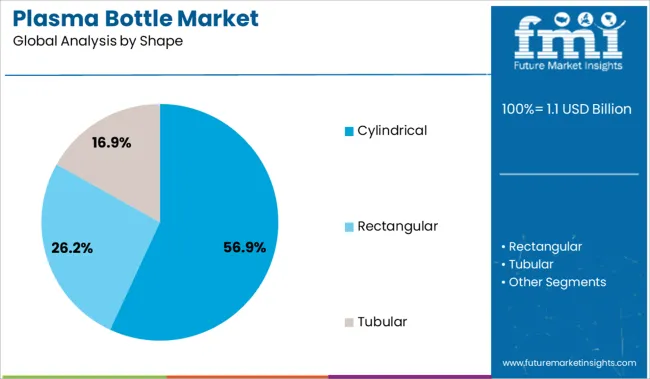
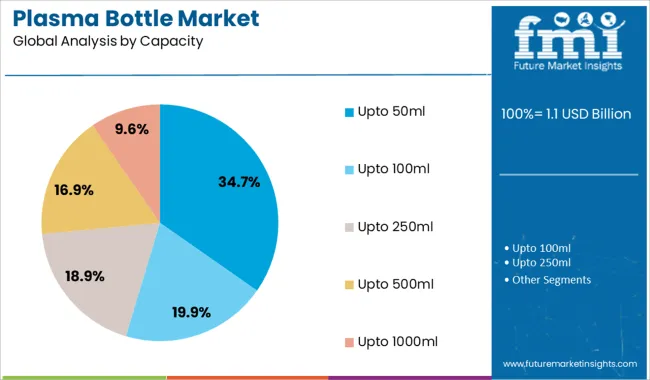
The demand in the global plasma bottle market is estimated to project growth at a CAGR of around 4% to 5% during the assessment period 2022 to 2032. Increasing emphasis on the development of novel sterile medical packaging solutions for storing body fluids is expected to facilitate the growth in the global market.
Report Attribute | Details |
---|---|
Plasma Bottle Market Projected Growth Rate (2022 to 2032) | 4% to 5% CAGR |
Plasma bottles are sterilized bottles used for packaging and storing non-cellular portions of blood, protein, and electrolytes commonly referred to as plasma across blood banks, defense, and medical banks. These bottles are available in a variety of sizes and are generally made up of glass or medical-grade plastics.
The processing and maintaining the composition of blood, plasma, and other tissues with maximum hygienic conditions becomes a crucial task for medical banks. As plasma bottles assist in completing this task, they are gaining huge popularity across medial & healthcare spaces.
With growing vehicular fleet and rising traffic congestion, there is a substantial increase in number of road accidents across the world, creating strong demand for associate treatments and supplements. For instance, according to a survey by the National Crime Records Bureau, in 2020, approximately 354,796 incidences of road accidents were reported in India.
This rising burden of road accidents is accelerating the demand for blood and blood components for the patients with high blood loss. As plasma bottles are extensively used for safe collecting, storing, packaging, and transportation of blood components, surging need for blood components is estimated to create lucrative growth opportunities in the global market.
In addition to this, the leading plasma bottle manufacturers are constantly aiming at adopting novel production processes for manufacturing plasma bottles with varying sizes, shapes, and colors with minimum defects, which is expected to favor the growth in the market.
Presence of stringent standards and norms for the development and approval of sterile medical packaging solutions across regions such as North America, Europe, and Asia Pacific is projected to restrain the growth in the global plasma bottle market.
Also, implementation of strict regulations regarding the use of plastics, due to the rising concerns regarding disposal and environmental impact is expected to hamper the demand for plasma bottles across the plastics segment.
As per Future Market Insights, South Asia is forecast to account for the lion’s share in the plasma bottle market between 2022 and 2032.
Due to the growing burden of road accidents and increasing prevalence of blood-related diseases across Asia Pacific, a significant rise in blood & blood component transfusion is being witnessed in the countries such as India, Thailand, Bangladesh, and others.
For instance, according to a report by the Friends2support Organization, around 50 Million units of blood are required each year and nearly 30 Million units of blood components such as plasma are transfused every year in India. As plasma bottles are extensively used across numerous medical banks for transportation of blood components, increasing need for blood transfusion is expected to facilitate the growth in the South Asia market.
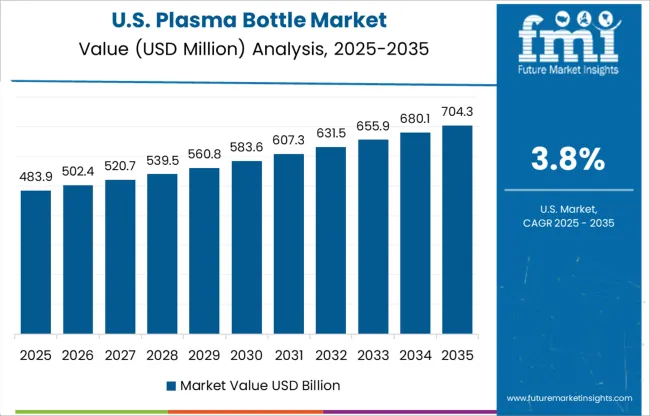
North America is expected to account for a significant share in the global plasma bottle market during the forecast period 2022 to 2032, states FMI.
With growing focus on proper storage and transportation of blood components in maximum hygienic conditions for maintaining the quality of blood, the demand for novel medical packaging solutions such as plasma bottles is rapidly increasing.
Also, launch of new guidelines on Human Blood and Transfusion Services by the New York State Council for processing and administration of plasma is further elevating the adoption of disinfected plasma storage solutions. This is anticipated to bolster the sales of plasma bottles in the North America market.
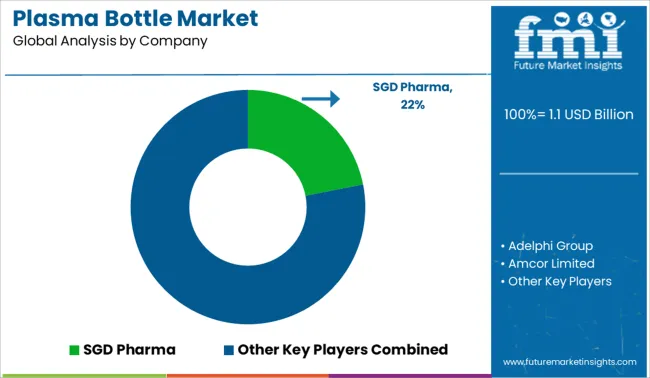
Some of the leading players in the plasma bottle market are SGD Pharma and Adelphi Group. These players are increasingly focusing on launching new products to expanding their product portfolio and adoption production capacity expansion and agreement strategies for strengthening their footprint.
Report Attribute | Details |
---|---|
Growth Rate | CAGR of 4% to 5% from 2022 to 2032 |
Base Year for Estimation | 2021 |
Historical Data | 2015 to 2020 |
Forecast Period | 2022 to 2032 |
Quantitative Units | Revenue in USD Million, Volume in Kilotons and CAGR from 2022 to 2032 |
Report Coverage | Revenue Forecast, Volume Forecast, Company Ranking, Competitive Landscape, Growth Factors, Trends and Pricing Analysis |
Segments Covered | Raw Material, Shape, End Use, Region |
Regions Covered | North America; Latin America; Europe; East Asia; South Asia; Oceania; Middle East and Africa |
Key Companies Profiled | SGD Pharma; Adelphi Grou; Others |
Customization | Available Upon Request |
Table 1: Global Plasma Bottle Market Value (US$ Mn) Forecast by Region, 2017-2032
Table 2: Global Plasma Bottle Market Volume (Units) Forecast by Region, 2017-2032
Table 3: Global Plasma Bottle Market Value (US$ Mn) Forecast by Raw Material, 2017-2032
Table 4: Global Plasma Bottle Market Volume (Units) Forecast by Raw Material, 2017-2032
Table 5: Global Plasma Bottle Market Value (US$ Mn) Forecast by Shape, 2017-2032
Table 6: Global Plasma Bottle Market Volume (Units) Forecast by Shape, 2017-2032
Table 7: Global Plasma Bottle Market Value (US$ Mn) Forecast by Capacity, 2017-2032
Table 8: Global Plasma Bottle Market Volume (Units) Forecast by Capacity, 2017-2032
Table 9: Global Plasma Bottle Market Value (US$ Mn) Forecast by End Use, 2017-2032
Table 10: Global Plasma Bottle Market Volume (Units) Forecast by End Use, 2017-2032
Table 11: North America Plasma Bottle Market Value (US$ Mn) Forecast by Country, 2017-2032
Table 12: North America Plasma Bottle Market Volume (Units) Forecast by Country, 2017-2032
Table 13: North America Plasma Bottle Market Value (US$ Mn) Forecast by Raw Material, 2017-2032
Table 14: North America Plasma Bottle Market Volume (Units) Forecast by Raw Material, 2017-2032
Table 15: North America Plasma Bottle Market Value (US$ Mn) Forecast by Shape, 2017-2032
Table 16: North America Plasma Bottle Market Volume (Units) Forecast by Shape, 2017-2032
Table 17: North America Plasma Bottle Market Value (US$ Mn) Forecast by Capacity, 2017-2032
Table 18: North America Plasma Bottle Market Volume (Units) Forecast by Capacity, 2017-2032
Table 19: North America Plasma Bottle Market Value (US$ Mn) Forecast by End Use, 2017-2032
Table 20: North America Plasma Bottle Market Volume (Units) Forecast by End Use, 2017-2032
Table 21: Latin America Plasma Bottle Market Value (US$ Mn) Forecast by Country, 2017-2032
Table 22: Latin America Plasma Bottle Market Volume (Units) Forecast by Country, 2017-2032
Table 23: Latin America Plasma Bottle Market Value (US$ Mn) Forecast by Raw Material, 2017-2032
Table 24: Latin America Plasma Bottle Market Volume (Units) Forecast by Raw Material, 2017-2032
Table 25: Latin America Plasma Bottle Market Value (US$ Mn) Forecast by Shape, 2017-2032
Table 26: Latin America Plasma Bottle Market Volume (Units) Forecast by Shape, 2017-2032
Table 27: Latin America Plasma Bottle Market Value (US$ Mn) Forecast by Capacity, 2017-2032
Table 28: Latin America Plasma Bottle Market Volume (Units) Forecast by Capacity, 2017-2032
Table 29: Latin America Plasma Bottle Market Value (US$ Mn) Forecast by End Use, 2017-2032
Table 30: Latin America Plasma Bottle Market Volume (Units) Forecast by End Use, 2017-2032
Table 31: Europe Plasma Bottle Market Value (US$ Mn) Forecast by Country, 2017-2032
Table 32: Europe Plasma Bottle Market Volume (Units) Forecast by Country, 2017-2032
Table 33: Europe Plasma Bottle Market Value (US$ Mn) Forecast by Raw Material, 2017-2032
Table 34: Europe Plasma Bottle Market Volume (Units) Forecast by Raw Material, 2017-2032
Table 35: Europe Plasma Bottle Market Value (US$ Mn) Forecast by Shape, 2017-2032
Table 36: Europe Plasma Bottle Market Volume (Units) Forecast by Shape, 2017-2032
Table 37: Europe Plasma Bottle Market Value (US$ Mn) Forecast by Capacity, 2017-2032
Table 38: Europe Plasma Bottle Market Volume (Units) Forecast by Capacity, 2017-2032
Table 39: Europe Plasma Bottle Market Value (US$ Mn) Forecast by End Use, 2017-2032
Table 40: Europe Plasma Bottle Market Volume (Units) Forecast by End Use, 2017-2032
Table 41: East Asia Plasma Bottle Market Value (US$ Mn) Forecast by Country, 2017-2032
Table 42: East Asia Plasma Bottle Market Volume (Units) Forecast by Country, 2017-2032
Table 43: East Asia Plasma Bottle Market Value (US$ Mn) Forecast by Raw Material, 2017-2032
Table 44: East Asia Plasma Bottle Market Volume (Units) Forecast by Raw Material, 2017-2032
Table 45: East Asia Plasma Bottle Market Value (US$ Mn) Forecast by Shape, 2017-2032
Table 46: East Asia Plasma Bottle Market Volume (Units) Forecast by Shape, 2017-2032
Table 47: East Asia Plasma Bottle Market Value (US$ Mn) Forecast by Capacity, 2017-2032
Table 48: East Asia Plasma Bottle Market Volume (Units) Forecast by Capacity, 2017-2032
Table 49: East Asia Plasma Bottle Market Value (US$ Mn) Forecast by End Use, 2017-2032
Table 50: East Asia Plasma Bottle Market Volume (Units) Forecast by End Use, 2017-2032
Table 51: South Asia & Pacific Plasma Bottle Market Value (US$ Mn) Forecast by Country, 2017-2032
Table 52: South Asia & Pacific Plasma Bottle Market Volume (Units) Forecast by Country, 2017-2032
Table 53: South Asia & Pacific Plasma Bottle Market Value (US$ Mn) Forecast by Raw Material, 2017-2032
Table 54: South Asia & Pacific Plasma Bottle Market Volume (Units) Forecast by Raw Material, 2017-2032
Table 55: South Asia & Pacific Plasma Bottle Market Value (US$ Mn) Forecast by Shape, 2017-2032
Table 56: South Asia & Pacific Plasma Bottle Market Volume (Units) Forecast by Shape, 2017-2032
Table 57: South Asia & Pacific Plasma Bottle Market Value (US$ Mn) Forecast by Capacity, 2017-2032
Table 58: South Asia & Pacific Plasma Bottle Market Volume (Units) Forecast by Capacity, 2017-2032
Table 59: South Asia & Pacific Plasma Bottle Market Value (US$ Mn) Forecast by End Use, 2017-2032
Table 60: South Asia & Pacific Plasma Bottle Market Volume (Units) Forecast by End Use, 2017-2032
Table 61: MEA Plasma Bottle Market Value (US$ Mn) Forecast by Country, 2017-2032
Table 62: MEA Plasma Bottle Market Volume (Units) Forecast by Country, 2017-2032
Table 63: MEA Plasma Bottle Market Value (US$ Mn) Forecast by Raw Material, 2017-2032
Table 64: MEA Plasma Bottle Market Volume (Units) Forecast by Raw Material, 2017-2032
Table 65: MEA Plasma Bottle Market Value (US$ Mn) Forecast by Shape, 2017-2032
Table 66: MEA Plasma Bottle Market Volume (Units) Forecast by Shape, 2017-2032
Table 67: MEA Plasma Bottle Market Value (US$ Mn) Forecast by Capacity, 2017-2032
Table 68: MEA Plasma Bottle Market Volume (Units) Forecast by Capacity, 2017-2032
Table 69: MEA Plasma Bottle Market Value (US$ Mn) Forecast by End Use, 2017-2032
Table 70: MEA Plasma Bottle Market Volume (Units) Forecast by End Use, 2017-2032
Figure 1: Global Plasma Bottle Market Value (US$ Mn) by Raw Material, 2022-2032
Figure 2: Global Plasma Bottle Market Value (US$ Mn) by Shape, 2022-2032
Figure 3: Global Plasma Bottle Market Value (US$ Mn) by Capacity, 2022-2032
Figure 4: Global Plasma Bottle Market Value (US$ Mn) by End Use, 2022-2032
Figure 5: Global Plasma Bottle Market Value (US$ Mn) by Region, 2022-2032
Figure 6: Global Plasma Bottle Market Value (US$ Mn) Analysis by Region, 2017-2032
Figure 7: Global Plasma Bottle Market Volume (Units) Analysis by Region, 2017-2032
Figure 8: Global Plasma Bottle Market Value Share (%) and BPS Analysis by Region, 2022-2032
Figure 9: Global Plasma Bottle Market Y-o-Y Growth (%) Projections by Region, 2022-2032
Figure 10: Global Plasma Bottle Market Value (US$ Mn) Analysis by Raw Material, 2017-2032
Figure 11: Global Plasma Bottle Market Volume (Units) Analysis by Raw Material, 2017-2032
Figure 12: Global Plasma Bottle Market Value Share (%) and BPS Analysis by Raw Material, 2022-2032
Figure 13: Global Plasma Bottle Market Y-o-Y Growth (%) Projections by Raw Material, 2022-2032
Figure 14: Global Plasma Bottle Market Value (US$ Mn) Analysis by Shape, 2017-2032
Figure 15: Global Plasma Bottle Market Volume (Units) Analysis by Shape, 2017-2032
Figure 16: Global Plasma Bottle Market Value Share (%) and BPS Analysis by Shape, 2022-2032
Figure 17: Global Plasma Bottle Market Y-o-Y Growth (%) Projections by Shape, 2022-2032
Figure 18: Global Plasma Bottle Market Value (US$ Mn) Analysis by Capacity, 2017-2032
Figure 19: Global Plasma Bottle Market Volume (Units) Analysis by Capacity, 2017-2032
Figure 20: Global Plasma Bottle Market Value Share (%) and BPS Analysis by Capacity, 2022-2032
Figure 21: Global Plasma Bottle Market Y-o-Y Growth (%) Projections by Capacity, 2022-2032
Figure 22: Global Plasma Bottle Market Value (US$ Mn) Analysis by End Use, 2017-2032
Figure 23: Global Plasma Bottle Market Volume (Units) Analysis by End Use, 2017-2032
Figure 24: Global Plasma Bottle Market Value Share (%) and BPS Analysis by End Use, 2022-2032
Figure 25: Global Plasma Bottle Market Y-o-Y Growth (%) Projections by End Use, 2022-2032
Figure 26: Global Plasma Bottle Market Attractiveness by Raw Material, 2022-2032
Figure 27: Global Plasma Bottle Market Attractiveness by Shape, 2022-2032
Figure 28: Global Plasma Bottle Market Attractiveness by Capacity, 2022-2032
Figure 29: Global Plasma Bottle Market Attractiveness by End Use, 2022-2032
Figure 30: Global Plasma Bottle Market Attractiveness by Region, 2022-2032
Figure 31: North America Plasma Bottle Market Value (US$ Mn) by Raw Material, 2022-2032
Figure 32: North America Plasma Bottle Market Value (US$ Mn) by Shape, 2022-2032
Figure 33: North America Plasma Bottle Market Value (US$ Mn) by Capacity, 2022-2032
Figure 34: North America Plasma Bottle Market Value (US$ Mn) by End Use, 2022-2032
Figure 35: North America Plasma Bottle Market Value (US$ Mn) by Country, 2022-2032
Figure 36: North America Plasma Bottle Market Value (US$ Mn) Analysis by Country, 2017-2032
Figure 37: North America Plasma Bottle Market Volume (Units) Analysis by Country, 2017-2032
Figure 38: North America Plasma Bottle Market Value Share (%) and BPS Analysis by Country, 2022-2032
Figure 39: North America Plasma Bottle Market Y-o-Y Growth (%) Projections by Country, 2022-2032
Figure 40: North America Plasma Bottle Market Value (US$ Mn) Analysis by Raw Material, 2017-2032
Figure 41: North America Plasma Bottle Market Volume (Units) Analysis by Raw Material, 2017-2032
Figure 42: North America Plasma Bottle Market Value Share (%) and BPS Analysis by Raw Material, 2022-2032
Figure 43: North America Plasma Bottle Market Y-o-Y Growth (%) Projections by Raw Material, 2022-2032
Figure 44: North America Plasma Bottle Market Value (US$ Mn) Analysis by Shape, 2017-2032
Figure 45: North America Plasma Bottle Market Volume (Units) Analysis by Shape, 2017-2032
Figure 46: North America Plasma Bottle Market Value Share (%) and BPS Analysis by Shape, 2022-2032
Figure 47: North America Plasma Bottle Market Y-o-Y Growth (%) Projections by Shape, 2022-2032
Figure 48: North America Plasma Bottle Market Value (US$ Mn) Analysis by Capacity, 2017-2032
Figure 49: North America Plasma Bottle Market Volume (Units) Analysis by Capacity, 2017-2032
Figure 50: North America Plasma Bottle Market Value Share (%) and BPS Analysis by Capacity, 2022-2032
Figure 51: North America Plasma Bottle Market Y-o-Y Growth (%) Projections by Capacity, 2022-2032
Figure 52: North America Plasma Bottle Market Value (US$ Mn) Analysis by End Use, 2017-2032
Figure 53: North America Plasma Bottle Market Volume (Units) Analysis by End Use, 2017-2032
Figure 54: North America Plasma Bottle Market Value Share (%) and BPS Analysis by End Use, 2022-2032
Figure 55: North America Plasma Bottle Market Y-o-Y Growth (%) Projections by End Use, 2022-2032
Figure 56: North America Plasma Bottle Market Attractiveness by Raw Material, 2022-2032
Figure 57: North America Plasma Bottle Market Attractiveness by Shape, 2022-2032
Figure 58: North America Plasma Bottle Market Attractiveness by Capacity, 2022-2032
Figure 59: North America Plasma Bottle Market Attractiveness by End Use, 2022-2032
Figure 60: North America Plasma Bottle Market Attractiveness by Country, 2022-2032
Figure 61: Latin America Plasma Bottle Market Value (US$ Mn) by Raw Material, 2022-2032
Figure 62: Latin America Plasma Bottle Market Value (US$ Mn) by Shape, 2022-2032
Figure 63: Latin America Plasma Bottle Market Value (US$ Mn) by Capacity, 2022-2032
Figure 64: Latin America Plasma Bottle Market Value (US$ Mn) by End Use, 2022-2032
Figure 65: Latin America Plasma Bottle Market Value (US$ Mn) by Country, 2022-2032
Figure 66: Latin America Plasma Bottle Market Value (US$ Mn) Analysis by Country, 2017-2032
Figure 67: Latin America Plasma Bottle Market Volume (Units) Analysis by Country, 2017-2032
Figure 68: Latin America Plasma Bottle Market Value Share (%) and BPS Analysis by Country, 2022-2032
Figure 69: Latin America Plasma Bottle Market Y-o-Y Growth (%) Projections by Country, 2022-2032
Figure 70: Latin America Plasma Bottle Market Value (US$ Mn) Analysis by Raw Material, 2017-2032
Figure 71: Latin America Plasma Bottle Market Volume (Units) Analysis by Raw Material, 2017-2032
Figure 72: Latin America Plasma Bottle Market Value Share (%) and BPS Analysis by Raw Material, 2022-2032
Figure 73: Latin America Plasma Bottle Market Y-o-Y Growth (%) Projections by Raw Material, 2022-2032
Figure 74: Latin America Plasma Bottle Market Value (US$ Mn) Analysis by Shape, 2017-2032
Figure 75: Latin America Plasma Bottle Market Volume (Units) Analysis by Shape, 2017-2032
Figure 76: Latin America Plasma Bottle Market Value Share (%) and BPS Analysis by Shape, 2022-2032
Figure 77: Latin America Plasma Bottle Market Y-o-Y Growth (%) Projections by Shape, 2022-2032
Figure 78: Latin America Plasma Bottle Market Value (US$ Mn) Analysis by Capacity, 2017-2032
Figure 79: Latin America Plasma Bottle Market Volume (Units) Analysis by Capacity, 2017-2032
Figure 80: Latin America Plasma Bottle Market Value Share (%) and BPS Analysis by Capacity, 2022-2032
Figure 81: Latin America Plasma Bottle Market Y-o-Y Growth (%) Projections by Capacity, 2022-2032
Figure 82: Latin America Plasma Bottle Market Value (US$ Mn) Analysis by End Use, 2017-2032
Figure 83: Latin America Plasma Bottle Market Volume (Units) Analysis by End Use, 2017-2032
Figure 84: Latin America Plasma Bottle Market Value Share (%) and BPS Analysis by End Use, 2022-2032
Figure 85: Latin America Plasma Bottle Market Y-o-Y Growth (%) Projections by End Use, 2022-2032
Figure 86: Latin America Plasma Bottle Market Attractiveness by Raw Material, 2022-2032
Figure 87: Latin America Plasma Bottle Market Attractiveness by Shape, 2022-2032
Figure 88: Latin America Plasma Bottle Market Attractiveness by Capacity, 2022-2032
Figure 89: Latin America Plasma Bottle Market Attractiveness by End Use, 2022-2032
Figure 90: Latin America Plasma Bottle Market Attractiveness by Country, 2022-2032
Figure 91: Europe Plasma Bottle Market Value (US$ Mn) by Raw Material, 2022-2032
Figure 92: Europe Plasma Bottle Market Value (US$ Mn) by Shape, 2022-2032
Figure 93: Europe Plasma Bottle Market Value (US$ Mn) by Capacity, 2022-2032
Figure 94: Europe Plasma Bottle Market Value (US$ Mn) by End Use, 2022-2032
Figure 95: Europe Plasma Bottle Market Value (US$ Mn) by Country, 2022-2032
Figure 96: Europe Plasma Bottle Market Value (US$ Mn) Analysis by Country, 2017-2032
Figure 97: Europe Plasma Bottle Market Volume (Units) Analysis by Country, 2017-2032
Figure 98: Europe Plasma Bottle Market Value Share (%) and BPS Analysis by Country, 2022-2032
Figure 99: Europe Plasma Bottle Market Y-o-Y Growth (%) Projections by Country, 2022-2032
Figure 100: Europe Plasma Bottle Market Value (US$ Mn) Analysis by Raw Material, 2017-2032
Figure 101: Europe Plasma Bottle Market Volume (Units) Analysis by Raw Material, 2017-2032
Figure 102: Europe Plasma Bottle Market Value Share (%) and BPS Analysis by Raw Material, 2022-2032
Figure 103: Europe Plasma Bottle Market Y-o-Y Growth (%) Projections by Raw Material, 2022-2032
Figure 104: Europe Plasma Bottle Market Value (US$ Mn) Analysis by Shape, 2017-2032
Figure 105: Europe Plasma Bottle Market Volume (Units) Analysis by Shape, 2017-2032
Figure 106: Europe Plasma Bottle Market Value Share (%) and BPS Analysis by Shape, 2022-2032
Figure 107: Europe Plasma Bottle Market Y-o-Y Growth (%) Projections by Shape, 2022-2032
Figure 108: Europe Plasma Bottle Market Value (US$ Mn) Analysis by Capacity, 2017-2032
Figure 109: Europe Plasma Bottle Market Volume (Units) Analysis by Capacity, 2017-2032
Figure 110: Europe Plasma Bottle Market Value Share (%) and BPS Analysis by Capacity, 2022-2032
Figure 111: Europe Plasma Bottle Market Y-o-Y Growth (%) Projections by Capacity, 2022-2032
Figure 112: Europe Plasma Bottle Market Value (US$ Mn) Analysis by End Use, 2017-2032
Figure 113: Europe Plasma Bottle Market Volume (Units) Analysis by End Use, 2017-2032
Figure 114: Europe Plasma Bottle Market Value Share (%) and BPS Analysis by End Use, 2022-2032
Figure 115: Europe Plasma Bottle Market Y-o-Y Growth (%) Projections by End Use, 2022-2032
Figure 116: Europe Plasma Bottle Market Attractiveness by Raw Material, 2022-2032
Figure 117: Europe Plasma Bottle Market Attractiveness by Shape, 2022-2032
Figure 118: Europe Plasma Bottle Market Attractiveness by Capacity, 2022-2032
Figure 119: Europe Plasma Bottle Market Attractiveness by End Use, 2022-2032
Figure 120: Europe Plasma Bottle Market Attractiveness by Country, 2022-2032
Figure 121: East Asia Plasma Bottle Market Value (US$ Mn) by Raw Material, 2022-2032
Figure 122: East Asia Plasma Bottle Market Value (US$ Mn) by Shape, 2022-2032
Figure 123: East Asia Plasma Bottle Market Value (US$ Mn) by Capacity, 2022-2032
Figure 124: East Asia Plasma Bottle Market Value (US$ Mn) by End Use, 2022-2032
Figure 125: East Asia Plasma Bottle Market Value (US$ Mn) by Country, 2022-2032
Figure 126: East Asia Plasma Bottle Market Value (US$ Mn) Analysis by Country, 2017-2032
Figure 127: East Asia Plasma Bottle Market Volume (Units) Analysis by Country, 2017-2032
Figure 128: East Asia Plasma Bottle Market Value Share (%) and BPS Analysis by Country, 2022-2032
Figure 129: East Asia Plasma Bottle Market Y-o-Y Growth (%) Projections by Country, 2022-2032
Figure 130: East Asia Plasma Bottle Market Value (US$ Mn) Analysis by Raw Material, 2017-2032
Figure 131: East Asia Plasma Bottle Market Volume (Units) Analysis by Raw Material, 2017-2032
Figure 132: East Asia Plasma Bottle Market Value Share (%) and BPS Analysis by Raw Material, 2022-2032
Figure 133: East Asia Plasma Bottle Market Y-o-Y Growth (%) Projections by Raw Material, 2022-2032
Figure 134: East Asia Plasma Bottle Market Value (US$ Mn) Analysis by Shape, 2017-2032
Figure 135: East Asia Plasma Bottle Market Volume (Units) Analysis by Shape, 2017-2032
Figure 136: East Asia Plasma Bottle Market Value Share (%) and BPS Analysis by Shape, 2022-2032
Figure 137: East Asia Plasma Bottle Market Y-o-Y Growth (%) Projections by Shape, 2022-2032
Figure 138: East Asia Plasma Bottle Market Value (US$ Mn) Analysis by Capacity, 2017-2032
Figure 139: East Asia Plasma Bottle Market Volume (Units) Analysis by Capacity, 2017-2032
Figure 140: East Asia Plasma Bottle Market Value Share (%) and BPS Analysis by Capacity, 2022-2032
Figure 141: East Asia Plasma Bottle Market Y-o-Y Growth (%) Projections by Capacity, 2022-2032
Figure 142: East Asia Plasma Bottle Market Value (US$ Mn) Analysis by End Use, 2017-2032
Figure 143: East Asia Plasma Bottle Market Volume (Units) Analysis by End Use, 2017-2032
Figure 144: East Asia Plasma Bottle Market Value Share (%) and BPS Analysis by End Use, 2022-2032
Figure 145: East Asia Plasma Bottle Market Y-o-Y Growth (%) Projections by End Use, 2022-2032
Figure 146: East Asia Plasma Bottle Market Attractiveness by Raw Material, 2022-2032
Figure 147: East Asia Plasma Bottle Market Attractiveness by Shape, 2022-2032
Figure 148: East Asia Plasma Bottle Market Attractiveness by Capacity, 2022-2032
Figure 149: East Asia Plasma Bottle Market Attractiveness by End Use, 2022-2032
Figure 150: East Asia Plasma Bottle Market Attractiveness by Country, 2022-2032
Figure 151: South Asia & Pacific Plasma Bottle Market Value (US$ Mn) by Raw Material, 2022-2032
Figure 152: South Asia & Pacific Plasma Bottle Market Value (US$ Mn) by Shape, 2022-2032
Figure 153: South Asia & Pacific Plasma Bottle Market Value (US$ Mn) by Capacity, 2022-2032
Figure 154: South Asia & Pacific Plasma Bottle Market Value (US$ Mn) by End Use, 2022-2032
Figure 155: South Asia & Pacific Plasma Bottle Market Value (US$ Mn) by Country, 2022-2032
Figure 156: South Asia & Pacific Plasma Bottle Market Value (US$ Mn) Analysis by Country, 2017-2032
Figure 157: South Asia & Pacific Plasma Bottle Market Volume (Units) Analysis by Country, 2017-2032
Figure 158: South Asia & Pacific Plasma Bottle Market Value Share (%) and BPS Analysis by Country, 2022-2032
Figure 159: South Asia & Pacific Plasma Bottle Market Y-o-Y Growth (%) Projections by Country, 2022-2032
Figure 160: South Asia & Pacific Plasma Bottle Market Value (US$ Mn) Analysis by Raw Material, 2017-2032
Figure 161: South Asia & Pacific Plasma Bottle Market Volume (Units) Analysis by Raw Material, 2017-2032
Figure 162: South Asia & Pacific Plasma Bottle Market Value Share (%) and BPS Analysis by Raw Material, 2022-2032
Figure 163: South Asia & Pacific Plasma Bottle Market Y-o-Y Growth (%) Projections by Raw Material, 2022-2032
Figure 164: South Asia & Pacific Plasma Bottle Market Value (US$ Mn) Analysis by Shape, 2017-2032
Figure 165: South Asia & Pacific Plasma Bottle Market Volume (Units) Analysis by Shape, 2017-2032
Figure 166: South Asia & Pacific Plasma Bottle Market Value Share (%) and BPS Analysis by Shape, 2022-2032
Figure 167: South Asia & Pacific Plasma Bottle Market Y-o-Y Growth (%) Projections by Shape, 2022-2032
Figure 168: South Asia & Pacific Plasma Bottle Market Value (US$ Mn) Analysis by Capacity, 2017-2032
Figure 169: South Asia & Pacific Plasma Bottle Market Volume (Units) Analysis by Capacity, 2017-2032
Figure 170: South Asia & Pacific Plasma Bottle Market Value Share (%) and BPS Analysis by Capacity, 2022-2032
Figure 171: South Asia & Pacific Plasma Bottle Market Y-o-Y Growth (%) Projections by Capacity, 2022-2032
Figure 172: South Asia & Pacific Plasma Bottle Market Value (US$ Mn) Analysis by End Use, 2017-2032
Figure 173: South Asia & Pacific Plasma Bottle Market Volume (Units) Analysis by End Use, 2017-2032
Figure 174: South Asia & Pacific Plasma Bottle Market Value Share (%) and BPS Analysis by End Use, 2022-2032
Figure 175: South Asia & Pacific Plasma Bottle Market Y-o-Y Growth (%) Projections by End Use, 2022-2032
Figure 176: South Asia & Pacific Plasma Bottle Market Attractiveness by Raw Material, 2022-2032
Figure 177: South Asia & Pacific Plasma Bottle Market Attractiveness by Shape, 2022-2032
Figure 178: South Asia & Pacific Plasma Bottle Market Attractiveness by Capacity, 2022-2032
Figure 179: South Asia & Pacific Plasma Bottle Market Attractiveness by End Use, 2022-2032
Figure 180: South Asia & Pacific Plasma Bottle Market Attractiveness by Country, 2022-2032
Figure 181: MEA Plasma Bottle Market Value (US$ Mn) by Raw Material, 2022-2032
Figure 182: MEA Plasma Bottle Market Value (US$ Mn) by Shape, 2022-2032
Figure 183: MEA Plasma Bottle Market Value (US$ Mn) by Capacity, 2022-2032
Figure 184: MEA Plasma Bottle Market Value (US$ Mn) by End Use, 2022-2032
Figure 185: MEA Plasma Bottle Market Value (US$ Mn) by Country, 2022-2032
Figure 186: MEA Plasma Bottle Market Value (US$ Mn) Analysis by Country, 2017-2032
Figure 187: MEA Plasma Bottle Market Volume (Units) Analysis by Country, 2017-2032
Figure 188: MEA Plasma Bottle Market Value Share (%) and BPS Analysis by Country, 2022-2032
Figure 189: MEA Plasma Bottle Market Y-o-Y Growth (%) Projections by Country, 2022-2032
Figure 190: MEA Plasma Bottle Market Value (US$ Mn) Analysis by Raw Material, 2017-2032
Figure 191: MEA Plasma Bottle Market Volume (Units) Analysis by Raw Material, 2017-2032
Figure 192: MEA Plasma Bottle Market Value Share (%) and BPS Analysis by Raw Material, 2022-2032
Figure 193: MEA Plasma Bottle Market Y-o-Y Growth (%) Projections by Raw Material, 2022-2032
Figure 194: MEA Plasma Bottle Market Value (US$ Mn) Analysis by Shape, 2017-2032
Figure 195: MEA Plasma Bottle Market Volume (Units) Analysis by Shape, 2017-2032
Figure 196: MEA Plasma Bottle Market Value Share (%) and BPS Analysis by Shape, 2022-2032
Figure 197: MEA Plasma Bottle Market Y-o-Y Growth (%) Projections by Shape, 2022-2032
Figure 198: MEA Plasma Bottle Market Value (US$ Mn) Analysis by Capacity, 2017-2032
Figure 199: MEA Plasma Bottle Market Volume (Units) Analysis by Capacity, 2017-2032
Figure 200: MEA Plasma Bottle Market Value Share (%) and BPS Analysis by Capacity, 2022-2032
Figure 201: MEA Plasma Bottle Market Y-o-Y Growth (%) Projections by Capacity, 2022-2032
Figure 202: MEA Plasma Bottle Market Value (US$ Mn) Analysis by End Use, 2017-2032
Figure 203: MEA Plasma Bottle Market Volume (Units) Analysis by End Use, 2017-2032
Figure 204: MEA Plasma Bottle Market Value Share (%) and BPS Analysis by End Use, 2022-2032
Figure 205: MEA Plasma Bottle Market Y-o-Y Growth (%) Projections by End Use, 2022-2032
Figure 206: MEA Plasma Bottle Market Attractiveness by Raw Material, 2022-2032
Figure 207: MEA Plasma Bottle Market Attractiveness by Shape, 2022-2032
Figure 208: MEA Plasma Bottle Market Attractiveness by Capacity, 2022-2032
Figure 209: MEA Plasma Bottle Market Attractiveness by End Use, 2022-2032
Figure 210: MEA Plasma Bottle Market Attractiveness by Country, 2022-2032
FMI projects the sales of plasma bottle in the market is expected to rise at 4% to 5% value CAGR by 2032
The global plasma bottle market is expected to be dominated by South Asia the forecast period 2022-2032.
SGD Pharma, Adelphi Group, and others are some of the leading players in the prominent plasma bottle market.
Explore Similar Insights
Thank you!
You will receive an email from our Business Development Manager. Please be sure to check your SPAM/JUNK folder too.