The global pneumatic actuator market is likely to reach USD 26.8 billion by 2035, recording an absolute increase of USD 8.8 billion over the forecast period. The market is valued at USD 18.0 billion in 2025 and is set to rise at a CAGR of 4.8% during the assessment period. The overall market size is expected to grow by 1.5 times during the same period, supported by increasing industrial automation adoption and Industry 4.0 initiatives worldwide, driving demand for automated valve actuation systems and increasing investments in process industries, smart manufacturing facilities, and infrastructure modernization projects globally.
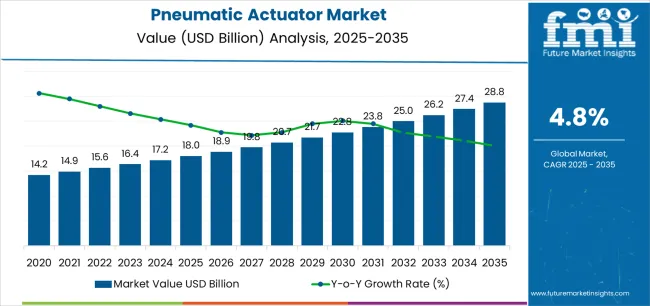
Between 2025 and 2030, the pneumatic actuator market is anticipated to expand from USD 18.0 billion to USD 22.0 billion, resulting in a value increase of USD 4.0 billion, which represents 45.5% of the total forecast growth for the decade. This phase of development will be shaped by rising demand for industrial automation and valve control solutions, product innovation in integrated sensor technologies and energy-efficient pneumatic systems, as well as expanding integration with Industry 4.0 platforms and predictive maintenance initiatives. Companies are establishing competitive positions through investment in smart actuator technologies, IO-Link connectivity capabilities, and strategic market expansion across process industries, discrete manufacturing, and infrastructure applications.
From 2030 to 2035, the market is forecast to grow from USD 22.0 billion to USD 26.8 billion, adding another USD 4.8 billion, which constitutes 54.5% of the overall ten-year expansion. This period is expected to be characterized by the expansion of specialized intelligent actuator systems, including advanced position feedback mechanisms and integrated diagnostic platforms tailored for specific industrial requirements, strategic collaborations between actuator manufacturers and automation solution providers, and an enhanced focus on energy efficiency and predictive maintenance capabilities. The growing emphasis on smart manufacturing and automated process control will drive demand for advanced, high-performance pneumatic actuator solutions across diverse industrial and infrastructure applications.
| Metric | Value |
|---|---|
| Market Value (2025) | USD 18.0 billion |
| Market Forecast Value (2035) | USD 26.8 billion |
| Forecast CAGR (2025-2035) | 4.8% |
The pneumatic actuator market grows by enabling industrial operators, process engineers, and facility managers to achieve superior valve automation efficiency and operational reliability while meeting evolving safety and productivity demands. Industrial facilities face mounting pressure to improve process control precision and reduce manual intervention, with pneumatic actuator systems providing 40-50% faster valve response times compared to manual operation, making automated actuation essential for process industries, manufacturing automation, and critical infrastructure applications. The Industry 4.0 movement's need for connected, intelligent actuation creates demand for advanced pneumatic solutions that can enhance process optimization, enable remote monitoring, and ensure consistent performance across diverse operating conditions.
Government initiatives promoting industrial modernization and energy efficiency drive adoption in chemical processing, water treatment, and manufacturing applications, where automation reliability has a direct impact on operational safety and productivity. The global shift toward smart manufacturing and digitalization accelerates pneumatic actuator demand as facilities seek equipment that enables integration with PLCs, SCADA systems, and predictive maintenance platforms. The competition from electric actuators and higher air consumption costs compared to emerging technologies may limit adoption rates in applications where electric alternatives offer superior energy efficiency and precise positioning capabilities.
The market is segmented by product type, operation, application, capacity rating, and region. By product type, the market is divided into scotch yoke pneumatic actuators and rack & pinion pneumatic actuators. Based on operation, the market is categorized into double-acting and spring-return configurations. By application, the market includes industrial automation and transportation (rail, material handling on-vehicle). Based on capacity rating, the market is segmented into heavy duty and light duty systems. Regionally, the market is divided into North America, Europe, Asia Pacific, Latin America, and Middle East & Africa.
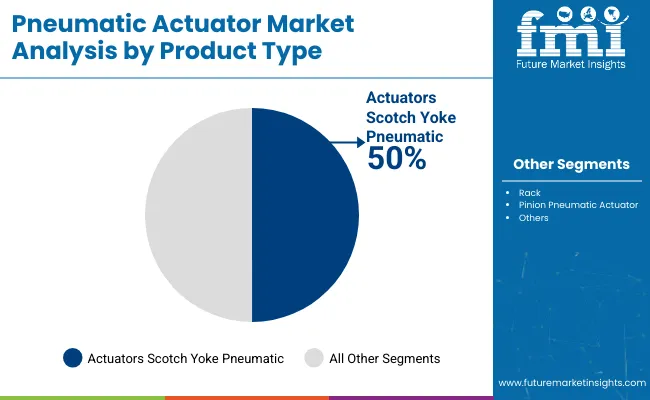
The scotch yoke pneumatic actuators segment represents the dominant force in the pneumatic actuator market, capturing approximately 51.0% of total market share in 2025. This advanced category encompasses robust quarter-turn actuation mechanisms featuring superior torque output characteristics, compact design profiles, and reliable performance in demanding industrial environments, delivering comprehensive actuation capabilities with optimal force transmission efficiency. The scotch yoke segment's market leadership stems from its exceptional torque density enabling high output in compact packages, superior performance in high-cycle applications requiring reliable operation over millions of cycles, and compatibility with large valve sizes in process industries that demand substantial actuation force.
The rack & pinion pneumatic actuators segment maintains a substantial 49.0% market share, serving applications where lightweight design, fast stroking speeds, and cost-effective solutions are priorities, particularly in smaller valve sizes and high-speed automation applications. Rack & pinion designs offer advantages in compact installations, providing efficient quarter-turn actuation with simplified maintenance requirements and modular construction supporting easy field servicing. Despite slightly lower torque density, rack & pinion actuators appeal to operators seeking versatile solutions for general industrial automation and manufacturing process control applications.
Key advantages driving the scotch yoke segment include:
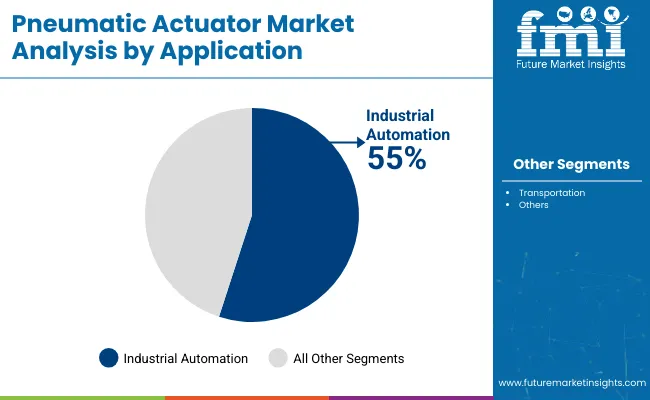
The industrial automation segment represents the leading application category in the pneumatic actuator market, capturing approximately 55.0% of total market share in 2025. This critical segment encompasses manufacturing facilities, process plants, water treatment systems, and industrial production environments where pneumatic actuators deliver reliable valve automation supporting process control, safety systems, and production optimization. The industrial automation segment's dominance reflects the fundamental role of automated valve actuation in modern manufacturing operations, from chemical processing to food production and pharmaceutical manufacturing.
The transportation segment maintains a substantial 45.0% market share, serving rail systems, material handling equipment, and on-vehicle pneumatic applications requiring reliable actuation in mobile and infrastructure applications. Transportation applications include door control systems for rail vehicles, braking system components, and automated material handling equipment in logistics facilities. Despite facing competition from electric and hydraulic alternatives, pneumatic actuation remains preferred for specific transportation applications requiring rapid response, fail-safe operation, and proven reliability in demanding operating environments.
Key factors driving industrial automation segment leadership include:
The market is driven by three concrete demand factors tied to industrial modernization and automation efficiency outcomes.
The Industry 4.0 adoption and smart manufacturing initiatives create increasing requirements for automated valve actuation, with global industrial automation investment growing 7-9% annually requiring pneumatic actuators for process control integration, SCADA connectivity, and distributed control system implementation across manufacturing and process industries.
The brownfield facility modernization and aging infrastructure replacement drive retrofit demand, with pneumatic actuators enabling 30-50% maintenance cost reduction through automated valve control replacing manual operation while improving process safety and operational efficiency in chemical plants, water treatment facilities, and industrial manufacturing sites.
The energy transition projects and renewable infrastructure expansion accelerate actuator adoption, with offshore wind installations, hydrogen production facilities, and battery manufacturing plants requiring reliable valve automation for process control and safety systems supporting emerging energy technologies.
Market restraints include competition from electric actuators affecting market share in precision control applications, with electric alternatives offering 20-30% better energy efficiency and superior positioning accuracy, creating adoption barriers for pneumatic solutions in applications requiring precise modulating control and energy-conscious facility operators. Higher compressed air costs and infrastructure requirements pose operational challenges, as pneumatic systems require capital investment in air compressors, distribution piping, and air treatment equipment that electric actuators eliminate, impacting total cost of ownership comparisons particularly in new facility construction. Maintenance requirements and air leakage concerns create additional operational pressures, with pneumatic systems typically experiencing 20-40% energy losses through system leakage and requiring regular maintenance of air preparation equipment affecting operating cost competitiveness versus alternative actuation technologies.
Key trends indicate accelerated adoption of smart pneumatic actuators with integrated sensors and connectivity, particularly in process industries where IO-Link enabled actuators provide real-time position feedback, diagnostic data, and predictive maintenance capabilities while maintaining pneumatic technology's intrinsic safety and explosion-proof advantages. Energy efficiency optimization trends toward pneumatic actuators equipped with air consumption monitoring, intelligent exhaust control, and variable force control are enabling significant compressed air savings while supporting facility sustainability initiatives and operating cost reduction programs. The market thesis could face disruption if electric actuator costs decline significantly or if emerging technologies such as piezoelectric or magnetostrictive actuation achieve commercial viability with comparable speed and fail-safe characteristics, potentially reshaping actuation technology selection criteria across industrial automation and process control applications.
| Country | CAGR (2025-2035) |
|---|---|
| Germany | 6.8% |
| United Kingdom | 5.2% |
| India | 5.6% |
| USA | 4.8% |
| China | 4.6% |
| Japan | 4.1% |
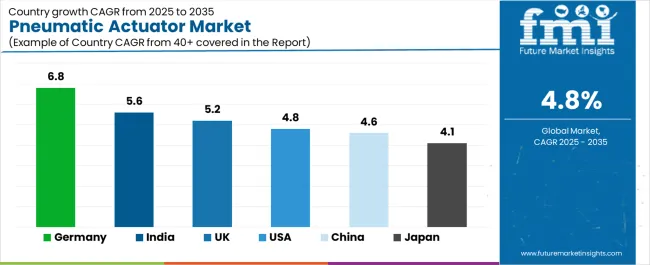
The pneumatic actuator market is gaining momentum worldwide, with Germany taking the lead thanks to Industry 4.0 upgrades in discrete and process plants combined with energy-transition projects using valve automation. Close behind, the United Kingdom benefits from smart-factory retrofits in pharma and food sectors along with offshore wind and hydrogen valve controls, positioning itself as a strategic growth hub in EUropean region. India shows strong advancement, where chemicals, pharma, and food processing capacity additions along with smart water treatment investments strengthen its role in industrial automation. The USA demonstrates robust growth through brownfield modernization in chemicals and water treatment, signaling continued investment in industrial infrastructure. Meanwhile, China stands out for automotive and battery giga-factory expansion, while Japan continue to record consistent progress driven by precision automation and logistics warehouse automation. Together, Germany and the United Kingdom anchor the global expansion story, while emerging markets build momentum and diversity into the market's growth path.
The report covers an in-depth analysis of 40+ countries, Top-performing countries are highlighted below.
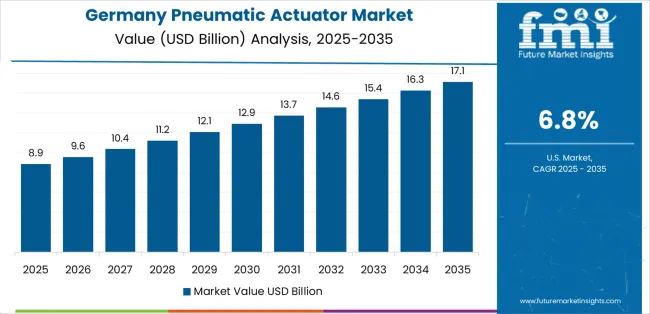
Germany demonstrates the strongest growth potential in the Pneumatic Actuator Market with a CAGR of 6.8% through 2035. The country's leadership position stems from comprehensive Industry 4.0 implementation programs, intensive energy-transition infrastructure projects, and strong machine-building export sectors driving adoption of advanced pneumatic actuation systems. Growth is concentrated in major industrial regions, including North Rhine-Westphalia, Bavaria, Baden-Württemberg, and Lower Saxony, where chemical facilities, automotive plants, and process industries are implementing intelligent pneumatic actuators for valve automation and manufacturing process control. Distribution channels through automation distributors, OEM equipment partnerships, and direct industrial procurement relationships expand deployment across manufacturing clusters and process industry sites. The country's Industrie 4.0 initiative and energy transition programs provide policy support for automation modernization, including financing schemes for facility upgrades and technology adoption incentives.
Key market factors:
In major industrial centers, pharmaceutical facilities, and renewable energy projects, the adoption of pneumatic actuator systems is accelerating across smart factory implementations, offshore wind installations, and hydrogen infrastructure developments, driven by manufacturing modernization and clean energy transition initiatives. The market demonstrates strong growth momentum with a CAGR of 5.2% through 2035, linked to comprehensive industrial retrofit programs and increasing focus on energy efficiency enhancement solutions. British facility operators are implementing intelligent pneumatic actuators and position monitoring platforms to optimize process control while meeting safety and environmental standards in key industrial regions including Southeast England, Midlands, Northwest England, and Scotland. The country's net-zero commitments and pharmaceutical manufacturing excellence create sustained demand for advanced actuation solutions, while increasing emphasis on renewable energy infrastructure drives adoption of pneumatic valve control systems that support clean energy operations.
India's expanding industrial sector demonstrates sophisticated implementation of pneumatic actuator systems, with documented case studies showing 35-45% process efficiency improvements in chemical plants and pharmaceutical facilities through automated valve control adoption. The country's manufacturing infrastructure in major industrial regions, including Gujarat, Maharashtra, Tamil Nadu, and Telangana, showcases integration of pneumatic actuation technologies with existing process control systems, leveraging expertise in chemicals manufacturing and pharmaceutical production. Indian facility operators emphasize automation reliability and cost-effectiveness, creating demand for robust pneumatic actuator solutions that support operational efficiency and quality standards. The market maintains strong growth through focus on industrial capacity expansion and infrastructure modernization, with a CAGR of 5.6% through 2035.
Key development areas:
The U.S. market demonstrates significant advancement in pneumatic actuator implementation based on brownfield facility upgrades and industrial safety enhancement programs for improved operational efficiency. The country shows solid potential with a CAGR of 4.8% through 2035, driven by chemical industry modernization and high safety standards adoption across major industrial corridors, including Gulf Coast petrochemical complex, Midwest manufacturing belt, and Northeast chemical corridor. American facility operators are implementing advanced pneumatic actuators for compliance with process safety management requirements and environmental regulations, particularly in oil & gas midstream facilities and chemical processing plants requiring reliable automated valve control. Technology deployment channels through industrial distributors, automation system integrators, and direct facility procurement programs expand coverage across diverse industrial applications.
Leading market segments:
The Chinese market demonstrates significant advancement in pneumatic actuator implementation based on automotive manufacturing expansion and battery production facility development for enhanced industrial capacity. The country shows solid potential with a CAGR of 4.6% through 2035, driven by automotive sector growth and municipal infrastructure modernization across major industrial regions, including Yangtze River Delta, Pearl River Delta, Bohai Rim, and Central industrial zones. Chinese manufacturers are adopting pneumatic actuation technology for automated assembly systems and process control applications, particularly in electric vehicle production facilities and battery giga-factories requiring reliable automation solutions. Technology deployment channels through domestic actuator manufacturers, international supplier partnerships, and industrial automation integrators expand coverage across manufacturing applications.
Leading market segments:
Japan's pneumatic actuator market demonstrates sophisticated implementation focused on precision automation requirements and compact system designs, with documented integration achieving exceptional reliability in electronics manufacturing and EV supply chain applications. The country maintains steady growth momentum with a CAGR of 4.1% through 2035, driven by advanced manufacturing requirements and operators' emphasis on quality principles aligned with lean manufacturing practices. Major industrial regions, including Tokyo-Yokohama corridor, Nagoya manufacturing belt, Osaka-Kobe industrial zone, and Kyushu technology centers, showcase advanced deployment of low-leakage pneumatic systems that integrate seamlessly with existing automation infrastructure and quality management systems.
Key market characteristics:
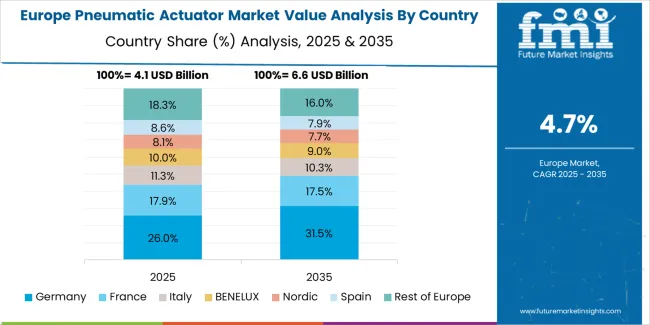
The pneumatic actuator market in Europe accounts for 32.9% of global revenue, representing a substantial share driven by process industries valve actuation and discrete manufacturing automation. Germany leads with approximately 24.6% of European market share in 2025, supported by its advanced industrial automation infrastructure and major process industry operations across Bavaria, North Rhine-Westphalia, and Baden-Württemberg regions. Italy follows with a 14.1% share, driven by comprehensive packaging machinery manufacturing and process equipment production. The United Kingdom holds a 13.8% share, supported by pharmaceutical manufacturing and offshore energy infrastructure projects. France commands a 12.7% share, backed by chemical processing facilities and nuclear power plant automation. Spain accounts for 7.9% through food processing automation and renewable energy installations. The Nordic countries represent 7.1% with strong pulp & paper industry automation and offshore oil & gas applications, while Benelux maintains 6.8% share through chemical manufacturing and port logistics automation. Rest of Europe holds 13.0% share, driven by Central & Eastern European manufacturing expansion and industrial modernization programs. Demand is concentrated in valve actuation for process industries including chemicals, refining, and water treatment, and in discrete manufacturing cells covering machine tools and packaging systems. EU energy-efficiency programs and safety standards are accelerating double-acting, heavy-duty designs with integrated sensors across brownfield retrofits and new facility construction.
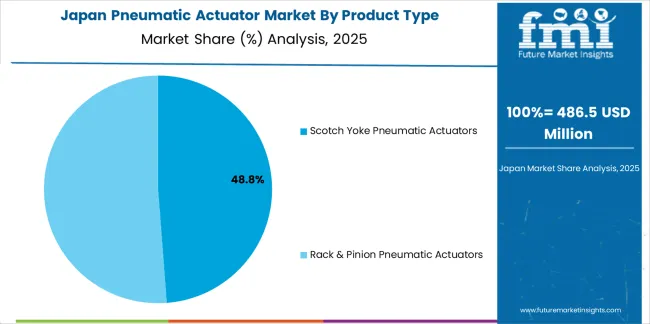
The Japanese pneumatic actuator market demonstrates a mature and quality-focused landscape, characterized by sophisticated integration of precision-engineered compact actuators and low-leakage technologies with existing industrial automation infrastructure across electronics manufacturing facilities, automotive assembly plants, and precision machinery operations. Japan's emphasis on manufacturing excellence and quality assurance drives demand for premium pneumatic actuator equipment that supports lean manufacturing principles and performance expectations in domestic industrial standards. The market benefits from strong partnerships between international actuator manufacturers and domestic automation system integrators including industrial machinery associations, creating comprehensive service ecosystems that prioritize equipment reliability and technical support programs. Manufacturing centers in Tokyo, Osaka, Nagoya, and other major industrial regions showcase advanced pneumatic actuator implementations where automation programs achieve exceptional operational efficiency through precision control systems and integrated predictive maintenance platforms.
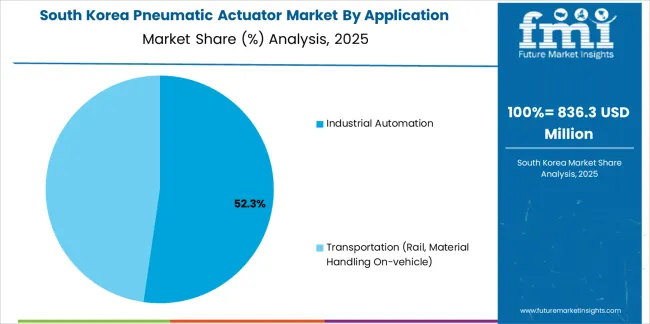
The South Korean pneumatic actuator market is characterized by growing international technology provider presence, with companies maintaining significant positions through comprehensive technical support and application engineering capabilities for semiconductor manufacturing and advanced electronics applications. The market demonstrates increasing emphasis on ultra-clean pneumatic systems and contamination-free actuation technologies, as Korean manufacturers increasingly demand specialized pneumatic actuators that integrate with domestic factory automation systems and sophisticated production control platforms deployed across semiconductor fabs and display panel facilities. Regional automation distributors are gaining market share through strategic partnerships with international manufacturers, offering specialized services including cleanroom-compatible installation support and application-specific actuator configuration programs for demanding electronics manufacturing environments. The competitive landscape shows increasing collaboration between multinational actuator companies and Korean industrial automation specialists, creating hybrid service models that combine international manufacturing expertise with local application knowledge and precision automation requirements.
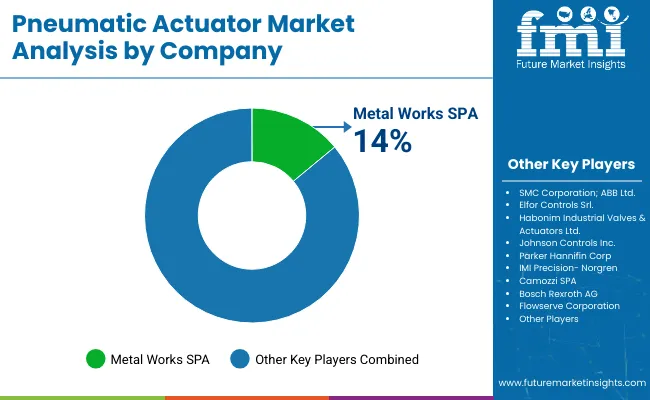
The pneumatic actuator market features approximately 12-18 meaningful players with moderate concentration, where the top three companies control roughly 30-35% of global market share through established distribution networks and comprehensive product portfolios. Competition centers on torque output reliability, integrated diagnostics capabilities, and technical support excellence rather than price competition alone. Emerson Electric Co. leads with approximately 12.5% market share through its comprehensive AVENTICS and ASCO pneumatic actuator portfolio spanning industrial automation and process control applications.
Market leaders include Emerson Electric Co., SMC Corporation, and Parker Hannifin, which maintain competitive advantages through global manufacturing infrastructure, extensive distributor networks, and deep expertise in pneumatic technology across multiple industrial segments, creating trust and reliability advantages with process engineers, automation specialists, and facility operators. These companies leverage research and development capabilities in smart actuator technologies and ongoing technical support relationships to defend market positions while expanding into integrated sensor systems and predictive diagnostics solutions.
Challengers encompass Festo SE & Co. KG and IMI Precision (Norgren), which compete through specialized actuator designs and strong presence in factory automation and mobile equipment markets. Product specialists, including Bosch Rexroth, Rotork, and Camozzi, focus on specific application segments or regional markets, offering differentiated capabilities in mobile hydraulics integration, valve automation packages, and customized actuation solutions. Global players including Flowserve and ABB create competitive pressure through comprehensive valve and actuator packages, process industry expertise, and project execution capabilities, particularly in large-scale infrastructure projects where integrated valve automation solutions provide advantages in engineering coordination and lifecycle support.
Pneumatic actuators represent essential industrial automation equipment that enables facility operators to achieve 40-50% faster valve response times compared to manual operation, delivering superior process control and safety performance with proven reliability in demanding industrial applications. With the market projected to grow from USD 18.0 billion in 2025 to USD 26.8 billion by 2035 at a 4.8% CAGR, these critical automation components offer compelling advantages - rapid response, fail-safe operation, and intrinsic safety characteristics - making them essential for industrial automation (55.0% market share), transportation applications (45.0% share), and process operations requiring automated valve control that electric alternatives cannot provide in hazardous areas and safety-critical applications.
How Governments Could Spur Local Production and Adoption?
How Industry Bodies Could Support Market Development?
How OEMs and Technology Players Could Strengthen the Ecosystem?
How Suppliers Could Navigate the Shift?
How Investors and Financial Enablers Could Unlock Value?
| Item | Value |
|---|---|
| Quantitative Units | USD 18.0 billion |
| Product Type | Scotch Yoke Pneumatic Actuators, Rack & Pinion Pneumatic Actuators |
| Operation | Double-acting, Spring-return |
| Application | Industrial Automation, Transportation (Rail, Material Handling On-vehicle) |
| Capacity Rating | Heavy Duty, Light Duty |
| Regions Covered | North America, Europe, Asia Pacific, Latin America, Middle East & Africa |
| Country Covered | Germany, United Kingdom, India, USA, China, Japan, ASEAN, and 40+ countries |
| Key Companies Profiled | Emerson Electric Co., SMC Corporation, Parker Hannifin, Festo SE & Co. KG, IMI Precision (Norgren), Bosch Rexroth, Rotork, Camozzi, Flowserve, ABB |
| Additional Attributes | Dollar sales by product type, operation, application, and capacity rating categories, regional adoption trends across Europe, Asia Pacific, and North America, competitive landscape with actuator manufacturers and automation system integrators, technical specifications and performance requirements, integration with industrial control systems and SCADA platforms, innovations in smart actuator technology and predictive diagnostics, and development of specialized pneumatic actuators with enhanced energy efficiency and Industry 4.0 connectivity capabilities. |
The global pneumatic actuator market is estimated to be valued at USD 18.0 billion in 2025.
The market size for the pneumatic actuator market is projected to reach USD 28.8 billion by 2035.
The pneumatic actuator market is expected to grow at a 4.8% CAGR between 2025 and 2035.
The key product types in pneumatic actuator market are scotch yoke pneumatic actuators and rack & pinion pneumatic actuators.
In terms of application, industrial automation segment to command 55.0% share in the pneumatic actuator market in 2025.


Full Research Suite comprises of:
Market outlook & trends analysis
Interviews & case studies
Strategic recommendations
Vendor profiles & capabilities analysis
5-year forecasts
8 regions and 60+ country-level data splits
Market segment data splits
12 months of continuous data updates
DELIVERED AS:
PDF EXCEL ONLINE
Market Share Distribution Among Pneumatic Actuator Manufacturers
Pneumatic Strippers Market
Smart Pneumatics Market - Automation & Industry Trends 2025 to 2035
Mining Pneumatic Saw Market Size and Share Forecast Outlook 2025 to 2035
Compact Pneumatic Pressure Sensor Market Size and Share Forecast Outlook 2025 to 2035
Electro-Pneumatic Train Brakes Market Growth - Trends & Forecast 2025 to 2035
Electro-pneumatic Transducers Market
Dual Air Chamber Hydro-pneumatic Suspension Market Size and Share Forecast Outlook 2025 to 2035
Single Air Chamber Hydro-pneumatic Suspension Market Forecast and Outlook 2025 to 2035
VVT Actuators Market Size and Share Forecast Outlook 2025 to 2035
Safety Actuators Market Size and Share Forecast Outlook 2025 to 2035
Linear Actuators Market
Engine Actuators Market
Market Share Insights of Aerosol Actuators Product Providers
Aircraft Actuators Market Size and Share Forecast Outlook 2025 to 2035
Aircraft Actuator Market Size and Share Forecast Outlook 2025 to 2035
Robotics Actuators Market Size and Share Forecast Outlook 2025 to 2035
Automotive Actuator Market Size and Share Forecast Outlook 2025 to 2035
Portable Valve Actuator Market
Electric Linear Actuator Market Trends – Growth & Forecast 2025 to 2035

Thank you!
You will receive an email from our Business Development Manager. Please be sure to check your SPAM/JUNK folder too.
Chat With
MaRIA