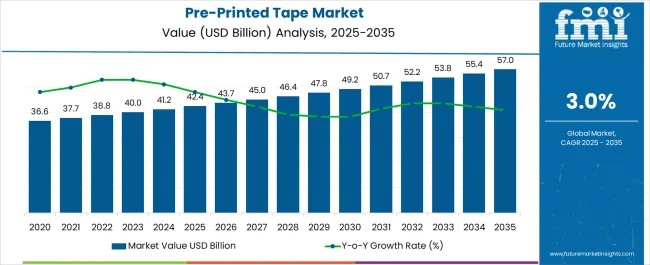
As per FMI Analysts, the global Pre-Printed Tape Market is estimated to be valued at USD 41.2 billion in 2023 and is projected to increase at a CAGR of 3% in the forecast period from 2023 to 2033. The global market share is expected to reach USD 55.4 billion by the end of the forecast period in 2033.
It has been observed that attractive packaging, product differentiation, and technological advancements are driving the demand for pre-printed tape as part of a notable growth in the printing industry. Additionally, there are several advantages associated with the product that has further accelerated the sales of pre-printed tapes in the market.
Pre-printed tapes are also known as custom-printed tapes, which contain all the product-related information. Benefits include decreasing pilferage as it cannot be broken and resealed without being noticed.
Further, the demand for pre-printed tape is also growing for reducing carton costs as inventories of printed cartons are no longer needed, and tracing lost shipments is made easy.
The sales of pre-printed tape in the market are expected to grow significantly owing to its attractiveness and cost-effectiveness, as it provides high quality at a low price. However, the high cost of high-quality printing, coupled with the evaporation of ink, may act as a restraining factor for sales of pre-printed tapes as well.
Building a printing plant costs a lot of capital, and raw material prices fluctuate a lot. These two are key obstacles to the global market share.
Attribute | Details |
---|---|
Global Pre-printed Tape Market Valuation in 2022 | USD 40 billion |
Estimated Global Market Share in 2023 | USD 41.2 billion |
Forecasted Global Market Size by 2033 | USD 55.4 billion |
Projected Global Market Growth Rate from 2023 to 2033 | 3% CAGR |
The global demand for pre-printed tape has received a lot of traction among industrial end users in the last couple of years. As it reduces pilferage due to its inability to be removed and resealed without detection, it reduces packaging costs significantly and is the key reason for such high sales of printed tapes in recent times.
There are some other advantages associated with it in addition to the growth in the printing industry that have accelerated the sales of pre-printed tape in the global market. Further, the demand for attractive packaging, product differentiation, and technological advances are the key drivers of the demand for pre-printed tape.
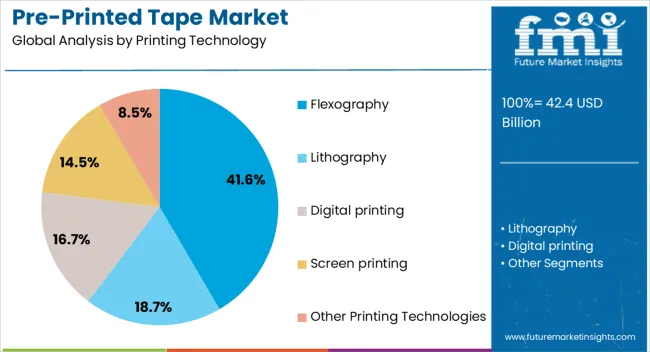
The market share is expected to accelerate with the support of digital printing, which is a cost-effective and attractive solution for manufacturing high-quality tapes. However, the high cost of this method, as well as the evaporative property of the ink may limit the demand for pre-printed tape in this section
The market share in Asia Pacific is projected to experience notable growth in the forthcoming years due to the growth of developing economies like India and China. Moreover, the sales of pre-printed tape in the Asia Pacific are projected to expand at a significant rate, mainly as a result of the growing population and consumerism.
China’s market share is the leading supplier and manufacturer of printing materials and equipment. As a result of the manufacturing and supply of printing equipment and materials in China, a portion of the sales of pre-printed tape in the global market is achieved in the Asia Pacific.
According to the market share value in North America and Europe, the demand for pre-printed tape might expand on average at a rate of 28% and 24%, respectively.
As the market expands steadily in these areas, Latin America and the Middle East & Africa are expected to witness a slow and steady growth in the demand for pre-printed tapes as well.
The sales of pre-printed tape have been experiencing significant growth in the region due to the transition of the global printing industry from conventional to digital printing machines.
In addition, pre-printed tapes are also useful for communicating handling instructions that have emerged to be a crucial factor in boosting the demand for pre-printed tape in the United States of America and Canada.
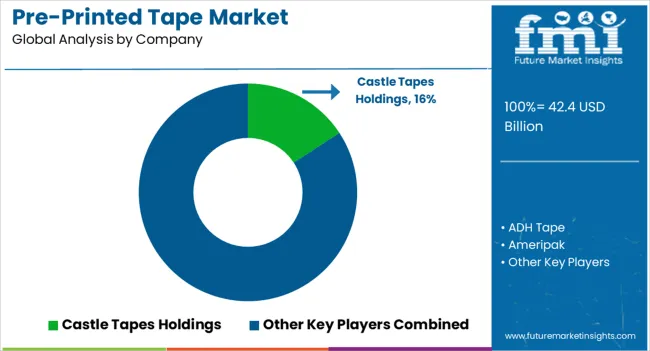
Some of the leading companies operating in the global market include Castle Tapes Holdings, ADH Tape, Ameripak, Preferred Tape, Inc., Nadco Tapes & Labels, Inc., Intertape Polymer Group, ProtoPak Engineering Corporation, and many more.
Manufacturers in the global pre-printed tapes market are expected to perceive significant opportunities as a result of growing investment by numerous large players in developed and emerging economies worldwide.
Moreover, pre-printed tapes are expected to generate substantial opportunities in the global economy as many large companies invest in developed and emerging countries.
Attribute | Details |
---|---|
Growth Rate | CAGR of 3% from 2023 to 2033 |
Base Year for Estimation | 2022 |
Historical Data | 2018 to 2022 |
Forecast Period | 2023 to 2033 |
Quantitative Units | Revenue in USD million and CAGR from 2023 to 2033 |
Report Coverage | Revenue Forecast, Volume Forecast, Company Ranking, Competitive Landscape, Growth Factors, Trends, and Pricing Analysis |
Segments Covered | By Printing Technology, By Material, By Adhesive Type, By Application, By End User, By Region |
Regions Covered | North America; Latin America; Western Europe; Japan; The Middle East and Africa |
Key Countries Profiled | The United States of America, Canada, Brazil, Mexico, Germany, The United Kingdom, France, Spain, Italy, Russia, Poland, Australia, New Zealand, China, India, Japan, GCC Countries, South Africa, North Africa |
Key Companies Profiled | Castle Tapes Holdings; ADH Tape; Ameripak; Preferred Tape, Inc.; Nadco Tapes & Labels, Inc.; Intertape Polymer Group; ProtoPak Engineering Corporation |
Customization & Pricing | Available Upon Request |
Table 1: Global Market Value (US$ Million) Forecast by Region, 2018 to 2033
Table 2: Global Market Volume (Units) Forecast by Region, 2018 to 2033
Table 3: Global Market Value (US$ Million) Forecast by Printing Technology, 2018 to 2033
Table 4: Global Market Volume (Units) Forecast by Printing Technology, 2018 to 2033
Table 5: Global Market Value (US$ Million) Forecast by Material, 2018 to 2033
Table 6: Global Market Volume (Units) Forecast by Material, 2018 to 2033
Table 7: Global Market Value (US$ Million) Forecast by Adhesive Type, 2018 to 2033
Table 8: Global Market Volume (Units) Forecast by Adhesive Type, 2018 to 2033
Table 9: Global Market Value (US$ Million) Forecast by Application, 2018 to 2033
Table 10: Global Market Volume (Units) Forecast by Application, 2018 to 2033
Table 11: Global Market Value (US$ Million) Forecast by End-User, 2018 to 2033
Table 12: Global Market Volume (Units) Forecast by End-User, 2018 to 2033
Table 13: North America Market Value (US$ Million) Forecast by Country, 2018 to 2033
Table 14: North America Market Volume (Units) Forecast by Country, 2018 to 2033
Table 15: North America Market Value (US$ Million) Forecast by Printing Technology, 2018 to 2033
Table 16: North America Market Volume (Units) Forecast by Printing Technology, 2018 to 2033
Table 17: North America Market Value (US$ Million) Forecast by Material, 2018 to 2033
Table 18: North America Market Volume (Units) Forecast by Material, 2018 to 2033
Table 19: North America Market Value (US$ Million) Forecast by Adhesive Type, 2018 to 2033
Table 20: North America Market Volume (Units) Forecast by Adhesive Type, 2018 to 2033
Table 21: North America Market Value (US$ Million) Forecast by Application, 2018 to 2033
Table 22: North America Market Volume (Units) Forecast by Application, 2018 to 2033
Table 23: North America Market Value (US$ Million) Forecast by End-User, 2018 to 2033
Table 24: North America Market Volume (Units) Forecast by End-User, 2018 to 2033
Table 25: Latin America Market Value (US$ Million) Forecast by Country, 2018 to 2033
Table 26: Latin America Market Volume (Units) Forecast by Country, 2018 to 2033
Table 27: Latin America Market Value (US$ Million) Forecast by Printing Technology, 2018 to 2033
Table 28: Latin America Market Volume (Units) Forecast by Printing Technology, 2018 to 2033
Table 29: Latin America Market Value (US$ Million) Forecast by Material, 2018 to 2033
Table 30: Latin America Market Volume (Units) Forecast by Material, 2018 to 2033
Table 31: Latin America Market Value (US$ Million) Forecast by Adhesive Type, 2018 to 2033
Table 32: Latin America Market Volume (Units) Forecast by Adhesive Type, 2018 to 2033
Table 33: Latin America Market Value (US$ Million) Forecast by Application, 2018 to 2033
Table 34: Latin America Market Volume (Units) Forecast by Application, 2018 to 2033
Table 35: Latin America Market Value (US$ Million) Forecast by End-User, 2018 to 2033
Table 36: Latin America Market Volume (Units) Forecast by End-User, 2018 to 2033
Table 37: Western Europe Market Value (US$ Million) Forecast by Country, 2018 to 2033
Table 38: Western Europe Market Volume (Units) Forecast by Country, 2018 to 2033
Table 39: Western Europe Market Value (US$ Million) Forecast by Printing Technology, 2018 to 2033
Table 40: Western Europe Market Volume (Units) Forecast by Printing Technology, 2018 to 2033
Table 41: Western Europe Market Value (US$ Million) Forecast by Material, 2018 to 2033
Table 42: Western Europe Market Volume (Units) Forecast by Material, 2018 to 2033
Table 43: Western Europe Market Value (US$ Million) Forecast by Adhesive Type, 2018 to 2033
Table 44: Western Europe Market Volume (Units) Forecast by Adhesive Type, 2018 to 2033
Table 45: Western Europe Market Value (US$ Million) Forecast by Application, 2018 to 2033
Table 46: Western Europe Market Volume (Units) Forecast by Application, 2018 to 2033
Table 47: Western Europe Market Value (US$ Million) Forecast by End-User, 2018 to 2033
Table 48: Western Europe Market Volume (Units) Forecast by End-User, 2018 to 2033
Table 49: Eastern Europe Market Value (US$ Million) Forecast by Country, 2018 to 2033
Table 50: Eastern Europe Market Volume (Units) Forecast by Country, 2018 to 2033
Table 51: Eastern Europe Market Value (US$ Million) Forecast by Printing Technology, 2018 to 2033
Table 52: Eastern Europe Market Volume (Units) Forecast by Printing Technology, 2018 to 2033
Table 53: Eastern Europe Market Value (US$ Million) Forecast by Material, 2018 to 2033
Table 54: Eastern Europe Market Volume (Units) Forecast by Material, 2018 to 2033
Table 55: Eastern Europe Market Value (US$ Million) Forecast by Adhesive Type, 2018 to 2033
Table 56: Eastern Europe Market Volume (Units) Forecast by Adhesive Type, 2018 to 2033
Table 57: Eastern Europe Market Value (US$ Million) Forecast by Application, 2018 to 2033
Table 58: Eastern Europe Market Volume (Units) Forecast by Application, 2018 to 2033
Table 59: Eastern Europe Market Value (US$ Million) Forecast by End-User, 2018 to 2033
Table 60: Eastern Europe Market Volume (Units) Forecast by End-User, 2018 to 2033
Table 61: South Asia and Pacific Market Value (US$ Million) Forecast by Country, 2018 to 2033
Table 62: South Asia and Pacific Market Volume (Units) Forecast by Country, 2018 to 2033
Table 63: South Asia and Pacific Market Value (US$ Million) Forecast by Printing Technology, 2018 to 2033
Table 64: South Asia and Pacific Market Volume (Units) Forecast by Printing Technology, 2018 to 2033
Table 65: South Asia and Pacific Market Value (US$ Million) Forecast by Material, 2018 to 2033
Table 66: South Asia and Pacific Market Volume (Units) Forecast by Material, 2018 to 2033
Table 67: South Asia and Pacific Market Value (US$ Million) Forecast by Adhesive Type, 2018 to 2033
Table 68: South Asia and Pacific Market Volume (Units) Forecast by Adhesive Type, 2018 to 2033
Table 69: South Asia and Pacific Market Value (US$ Million) Forecast by Application, 2018 to 2033
Table 70: South Asia and Pacific Market Volume (Units) Forecast by Application, 2018 to 2033
Table 71: South Asia and Pacific Market Value (US$ Million) Forecast by End-User, 2018 to 2033
Table 72: South Asia and Pacific Market Volume (Units) Forecast by End-User, 2018 to 2033
Table 73: East Asia Market Value (US$ Million) Forecast by Country, 2018 to 2033
Table 74: East Asia Market Volume (Units) Forecast by Country, 2018 to 2033
Table 75: East Asia Market Value (US$ Million) Forecast by Printing Technology, 2018 to 2033
Table 76: East Asia Market Volume (Units) Forecast by Printing Technology, 2018 to 2033
Table 77: East Asia Market Value (US$ Million) Forecast by Material, 2018 to 2033
Table 78: East Asia Market Volume (Units) Forecast by Material, 2018 to 2033
Table 79: East Asia Market Value (US$ Million) Forecast by Adhesive Type, 2018 to 2033
Table 80: East Asia Market Volume (Units) Forecast by Adhesive Type, 2018 to 2033
Table 81: East Asia Market Value (US$ Million) Forecast by Application, 2018 to 2033
Table 82: East Asia Market Volume (Units) Forecast by Application, 2018 to 2033
Table 83: East Asia Market Value (US$ Million) Forecast by End-User, 2018 to 2033
Table 84: East Asia Market Volume (Units) Forecast by End-User, 2018 to 2033
Table 85: Middle East and Africa Market Value (US$ Million) Forecast by Country, 2018 to 2033
Table 86: Middle East and Africa Market Volume (Units) Forecast by Country, 2018 to 2033
Table 87: Middle East and Africa Market Value (US$ Million) Forecast by Printing Technology, 2018 to 2033
Table 88: Middle East and Africa Market Volume (Units) Forecast by Printing Technology, 2018 to 2033
Table 89: Middle East and Africa Market Value (US$ Million) Forecast by Material, 2018 to 2033
Table 90: Middle East and Africa Market Volume (Units) Forecast by Material, 2018 to 2033
Table 91: Middle East and Africa Market Value (US$ Million) Forecast by Adhesive Type, 2018 to 2033
Table 92: Middle East and Africa Market Volume (Units) Forecast by Adhesive Type, 2018 to 2033
Table 93: Middle East and Africa Market Value (US$ Million) Forecast by Application, 2018 to 2033
Table 94: Middle East and Africa Market Volume (Units) Forecast by Application, 2018 to 2033
Table 95: Middle East and Africa Market Value (US$ Million) Forecast by End-User, 2018 to 2033
Table 96: Middle East and Africa Market Volume (Units) Forecast by End-User, 2018 to 2033
Figure 1: Global Market Value (US$ Million) by Printing Technology, 2023 to 2033
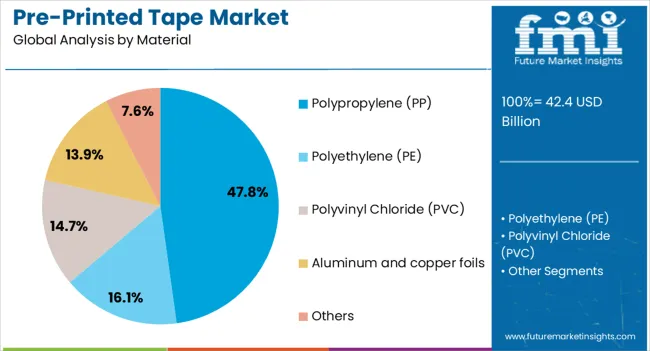
Figure 2: Global Market Value (US$ Million) by Material, 2023 to 2033
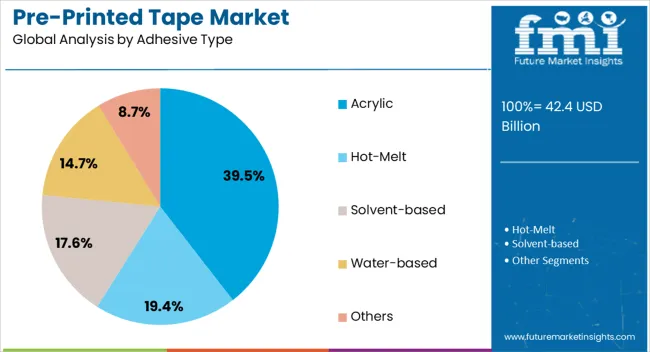
Figure 3: Global Market Value (US$ Million) by Adhesive Type, 2023 to 2033
Figure 4: Global Market Value (US$ Million) by Application, 2023 to 2033
Figure 5: Global Market Value (US$ Million) by End-User, 2023 to 2033
Figure 6: Global Market Value (US$ Million) by Region, 2023 to 2033
Figure 7: Global Market Value (US$ Million) Analysis by Region, 2018 to 2033
Figure 8: Global Market Volume (Units) Analysis by Region, 2018 to 2033
Figure 9: Global Market Value Share (%) and BPS Analysis by Region, 2023 to 2033
Figure 10: Global Market Y-o-Y Growth (%) Projections by Region, 2023 to 2033
Figure 11: Global Market Value (US$ Million) Analysis by Printing Technology, 2018 to 2033
Figure 12: Global Market Volume (Units) Analysis by Printing Technology, 2018 to 2033
Figure 13: Global Market Value Share (%) and BPS Analysis by Printing Technology, 2023 to 2033
Figure 14: Global Market Y-o-Y Growth (%) Projections by Printing Technology, 2023 to 2033
Figure 15: Global Market Value (US$ Million) Analysis by Material, 2018 to 2033
Figure 16: Global Market Volume (Units) Analysis by Material, 2018 to 2033
Figure 17: Global Market Value Share (%) and BPS Analysis by Material, 2023 to 2033
Figure 18: Global Market Y-o-Y Growth (%) Projections by Material, 2023 to 2033
Figure 19: Global Market Value (US$ Million) Analysis by Adhesive Type, 2018 to 2033
Figure 20: Global Market Volume (Units) Analysis by Adhesive Type, 2018 to 2033
Figure 21: Global Market Value Share (%) and BPS Analysis by Adhesive Type, 2023 to 2033
Figure 22: Global Market Y-o-Y Growth (%) Projections by Adhesive Type, 2023 to 2033
Figure 23: Global Market Value (US$ Million) Analysis by Application, 2018 to 2033
Figure 24: Global Market Volume (Units) Analysis by Application, 2018 to 2033
Figure 25: Global Market Value Share (%) and BPS Analysis by Application, 2023 to 2033
Figure 26: Global Market Y-o-Y Growth (%) Projections by Application, 2023 to 2033
Figure 27: Global Market Value (US$ Million) Analysis by End-User, 2018 to 2033
Figure 28: Global Market Volume (Units) Analysis by End-User, 2018 to 2033
Figure 29: Global Market Value Share (%) and BPS Analysis by End-User, 2023 to 2033
Figure 30: Global Market Y-o-Y Growth (%) Projections by End-User, 2023 to 2033
Figure 31: Global Market Attractiveness by Printing Technology, 2023 to 2033
Figure 32: Global Market Attractiveness by Material, 2023 to 2033
Figure 33: Global Market Attractiveness by Adhesive Type, 2023 to 2033
Figure 34: Global Market Attractiveness by Application, 2023 to 2033
Figure 35: Global Market Attractiveness by End-User, 2023 to 2033
Figure 36: Global Market Attractiveness by Region, 2023 to 2033
Figure 37: North America Market Value (US$ Million) by Printing Technology, 2023 to 2033
Figure 38: North America Market Value (US$ Million) by Material, 2023 to 2033
Figure 39: North America Market Value (US$ Million) by Adhesive Type, 2023 to 2033
Figure 40: North America Market Value (US$ Million) by Application, 2023 to 2033
Figure 41: North America Market Value (US$ Million) by End-User, 2023 to 2033
Figure 42: North America Market Value (US$ Million) by Country, 2023 to 2033
Figure 43: North America Market Value (US$ Million) Analysis by Country, 2018 to 2033
Figure 44: North America Market Volume (Units) Analysis by Country, 2018 to 2033
Figure 45: North America Market Value Share (%) and BPS Analysis by Country, 2023 to 2033
Figure 46: North America Market Y-o-Y Growth (%) Projections by Country, 2023 to 2033
Figure 47: North America Market Value (US$ Million) Analysis by Printing Technology, 2018 to 2033
Figure 48: North America Market Volume (Units) Analysis by Printing Technology, 2018 to 2033
Figure 49: North America Market Value Share (%) and BPS Analysis by Printing Technology, 2023 to 2033
Figure 50: North America Market Y-o-Y Growth (%) Projections by Printing Technology, 2023 to 2033
Figure 51: North America Market Value (US$ Million) Analysis by Material, 2018 to 2033
Figure 52: North America Market Volume (Units) Analysis by Material, 2018 to 2033
Figure 53: North America Market Value Share (%) and BPS Analysis by Material, 2023 to 2033
Figure 54: North America Market Y-o-Y Growth (%) Projections by Material, 2023 to 2033
Figure 55: North America Market Value (US$ Million) Analysis by Adhesive Type, 2018 to 2033
Figure 56: North America Market Volume (Units) Analysis by Adhesive Type, 2018 to 2033
Figure 57: North America Market Value Share (%) and BPS Analysis by Adhesive Type, 2023 to 2033
Figure 58: North America Market Y-o-Y Growth (%) Projections by Adhesive Type, 2023 to 2033
Figure 59: North America Market Value (US$ Million) Analysis by Application, 2018 to 2033
Figure 60: North America Market Volume (Units) Analysis by Application, 2018 to 2033
Figure 61: North America Market Value Share (%) and BPS Analysis by Application, 2023 to 2033
Figure 62: North America Market Y-o-Y Growth (%) Projections by Application, 2023 to 2033
Figure 63: North America Market Value (US$ Million) Analysis by End-User, 2018 to 2033
Figure 64: North America Market Volume (Units) Analysis by End-User, 2018 to 2033
Figure 65: North America Market Value Share (%) and BPS Analysis by End-User, 2023 to 2033
Figure 66: North America Market Y-o-Y Growth (%) Projections by End-User, 2023 to 2033
Figure 67: North America Market Attractiveness by Printing Technology, 2023 to 2033
Figure 68: North America Market Attractiveness by Material, 2023 to 2033
Figure 69: North America Market Attractiveness by Adhesive Type, 2023 to 2033
Figure 70: North America Market Attractiveness by Application, 2023 to 2033
Figure 71: North America Market Attractiveness by End-User, 2023 to 2033
Figure 72: North America Market Attractiveness by Country, 2023 to 2033
Figure 73: Latin America Market Value (US$ Million) by Printing Technology, 2023 to 2033
Figure 74: Latin America Market Value (US$ Million) by Material, 2023 to 2033
Figure 75: Latin America Market Value (US$ Million) by Adhesive Type, 2023 to 2033
Figure 76: Latin America Market Value (US$ Million) by Application, 2023 to 2033
Figure 77: Latin America Market Value (US$ Million) by End-User, 2023 to 2033
Figure 78: Latin America Market Value (US$ Million) by Country, 2023 to 2033
Figure 79: Latin America Market Value (US$ Million) Analysis by Country, 2018 to 2033
Figure 80: Latin America Market Volume (Units) Analysis by Country, 2018 to 2033
Figure 81: Latin America Market Value Share (%) and BPS Analysis by Country, 2023 to 2033
Figure 82: Latin America Market Y-o-Y Growth (%) Projections by Country, 2023 to 2033
Figure 83: Latin America Market Value (US$ Million) Analysis by Printing Technology, 2018 to 2033
Figure 84: Latin America Market Volume (Units) Analysis by Printing Technology, 2018 to 2033
Figure 85: Latin America Market Value Share (%) and BPS Analysis by Printing Technology, 2023 to 2033
Figure 86: Latin America Market Y-o-Y Growth (%) Projections by Printing Technology, 2023 to 2033
Figure 87: Latin America Market Value (US$ Million) Analysis by Material, 2018 to 2033
Figure 88: Latin America Market Volume (Units) Analysis by Material, 2018 to 2033
Figure 89: Latin America Market Value Share (%) and BPS Analysis by Material, 2023 to 2033
Figure 90: Latin America Market Y-o-Y Growth (%) Projections by Material, 2023 to 2033
Figure 91: Latin America Market Value (US$ Million) Analysis by Adhesive Type, 2018 to 2033
Figure 92: Latin America Market Volume (Units) Analysis by Adhesive Type, 2018 to 2033
Figure 93: Latin America Market Value Share (%) and BPS Analysis by Adhesive Type, 2023 to 2033
Figure 94: Latin America Market Y-o-Y Growth (%) Projections by Adhesive Type, 2023 to 2033
Figure 95: Latin America Market Value (US$ Million) Analysis by Application, 2018 to 2033
Figure 96: Latin America Market Volume (Units) Analysis by Application, 2018 to 2033
Figure 97: Latin America Market Value Share (%) and BPS Analysis by Application, 2023 to 2033
Figure 98: Latin America Market Y-o-Y Growth (%) Projections by Application, 2023 to 2033
Figure 99: Latin America Market Value (US$ Million) Analysis by End-User, 2018 to 2033
Figure 100: Latin America Market Volume (Units) Analysis by End-User, 2018 to 2033
Figure 101: Latin America Market Value Share (%) and BPS Analysis by End-User, 2023 to 2033
Figure 102: Latin America Market Y-o-Y Growth (%) Projections by End-User, 2023 to 2033
Figure 103: Latin America Market Attractiveness by Printing Technology, 2023 to 2033
Figure 104: Latin America Market Attractiveness by Material, 2023 to 2033
Figure 105: Latin America Market Attractiveness by Adhesive Type, 2023 to 2033
Figure 106: Latin America Market Attractiveness by Application, 2023 to 2033
Figure 107: Latin America Market Attractiveness by End-User, 2023 to 2033
Figure 108: Latin America Market Attractiveness by Country, 2023 to 2033
Figure 109: Western Europe Market Value (US$ Million) by Printing Technology, 2023 to 2033
Figure 110: Western Europe Market Value (US$ Million) by Material, 2023 to 2033
Figure 111: Western Europe Market Value (US$ Million) by Adhesive Type, 2023 to 2033
Figure 112: Western Europe Market Value (US$ Million) by Application, 2023 to 2033
Figure 113: Western Europe Market Value (US$ Million) by End-User, 2023 to 2033
Figure 114: Western Europe Market Value (US$ Million) by Country, 2023 to 2033
Figure 115: Western Europe Market Value (US$ Million) Analysis by Country, 2018 to 2033
Figure 116: Western Europe Market Volume (Units) Analysis by Country, 2018 to 2033
Figure 117: Western Europe Market Value Share (%) and BPS Analysis by Country, 2023 to 2033
Figure 118: Western Europe Market Y-o-Y Growth (%) Projections by Country, 2023 to 2033
Figure 119: Western Europe Market Value (US$ Million) Analysis by Printing Technology, 2018 to 2033
Figure 120: Western Europe Market Volume (Units) Analysis by Printing Technology, 2018 to 2033
Figure 121: Western Europe Market Value Share (%) and BPS Analysis by Printing Technology, 2023 to 2033
Figure 122: Western Europe Market Y-o-Y Growth (%) Projections by Printing Technology, 2023 to 2033
Figure 123: Western Europe Market Value (US$ Million) Analysis by Material, 2018 to 2033
Figure 124: Western Europe Market Volume (Units) Analysis by Material, 2018 to 2033
Figure 125: Western Europe Market Value Share (%) and BPS Analysis by Material, 2023 to 2033
Figure 126: Western Europe Market Y-o-Y Growth (%) Projections by Material, 2023 to 2033
Figure 127: Western Europe Market Value (US$ Million) Analysis by Adhesive Type, 2018 to 2033
Figure 128: Western Europe Market Volume (Units) Analysis by Adhesive Type, 2018 to 2033
Figure 129: Western Europe Market Value Share (%) and BPS Analysis by Adhesive Type, 2023 to 2033
Figure 130: Western Europe Market Y-o-Y Growth (%) Projections by Adhesive Type, 2023 to 2033
Figure 131: Western Europe Market Value (US$ Million) Analysis by Application, 2018 to 2033
Figure 132: Western Europe Market Volume (Units) Analysis by Application, 2018 to 2033
Figure 133: Western Europe Market Value Share (%) and BPS Analysis by Application, 2023 to 2033
Figure 134: Western Europe Market Y-o-Y Growth (%) Projections by Application, 2023 to 2033
Figure 135: Western Europe Market Value (US$ Million) Analysis by End-User, 2018 to 2033
Figure 136: Western Europe Market Volume (Units) Analysis by End-User, 2018 to 2033
Figure 137: Western Europe Market Value Share (%) and BPS Analysis by End-User, 2023 to 2033
Figure 138: Western Europe Market Y-o-Y Growth (%) Projections by End-User, 2023 to 2033
Figure 139: Western Europe Market Attractiveness by Printing Technology, 2023 to 2033
Figure 140: Western Europe Market Attractiveness by Material, 2023 to 2033
Figure 141: Western Europe Market Attractiveness by Adhesive Type, 2023 to 2033
Figure 142: Western Europe Market Attractiveness by Application, 2023 to 2033
Figure 143: Western Europe Market Attractiveness by End-User, 2023 to 2033
Figure 144: Western Europe Market Attractiveness by Country, 2023 to 2033
Figure 145: Eastern Europe Market Value (US$ Million) by Printing Technology, 2023 to 2033
Figure 146: Eastern Europe Market Value (US$ Million) by Material, 2023 to 2033
Figure 147: Eastern Europe Market Value (US$ Million) by Adhesive Type, 2023 to 2033
Figure 148: Eastern Europe Market Value (US$ Million) by Application, 2023 to 2033
Figure 149: Eastern Europe Market Value (US$ Million) by End-User, 2023 to 2033
Figure 150: Eastern Europe Market Value (US$ Million) by Country, 2023 to 2033
Figure 151: Eastern Europe Market Value (US$ Million) Analysis by Country, 2018 to 2033
Figure 152: Eastern Europe Market Volume (Units) Analysis by Country, 2018 to 2033
Figure 153: Eastern Europe Market Value Share (%) and BPS Analysis by Country, 2023 to 2033
Figure 154: Eastern Europe Market Y-o-Y Growth (%) Projections by Country, 2023 to 2033
Figure 155: Eastern Europe Market Value (US$ Million) Analysis by Printing Technology, 2018 to 2033
Figure 156: Eastern Europe Market Volume (Units) Analysis by Printing Technology, 2018 to 2033
Figure 157: Eastern Europe Market Value Share (%) and BPS Analysis by Printing Technology, 2023 to 2033
Figure 158: Eastern Europe Market Y-o-Y Growth (%) Projections by Printing Technology, 2023 to 2033
Figure 159: Eastern Europe Market Value (US$ Million) Analysis by Material, 2018 to 2033
Figure 160: Eastern Europe Market Volume (Units) Analysis by Material, 2018 to 2033
Figure 161: Eastern Europe Market Value Share (%) and BPS Analysis by Material, 2023 to 2033
Figure 162: Eastern Europe Market Y-o-Y Growth (%) Projections by Material, 2023 to 2033
Figure 163: Eastern Europe Market Value (US$ Million) Analysis by Adhesive Type, 2018 to 2033
Figure 164: Eastern Europe Market Volume (Units) Analysis by Adhesive Type, 2018 to 2033
Figure 165: Eastern Europe Market Value Share (%) and BPS Analysis by Adhesive Type, 2023 to 2033
Figure 166: Eastern Europe Market Y-o-Y Growth (%) Projections by Adhesive Type, 2023 to 2033
Figure 167: Eastern Europe Market Value (US$ Million) Analysis by Application, 2018 to 2033
Figure 168: Eastern Europe Market Volume (Units) Analysis by Application, 2018 to 2033
Figure 169: Eastern Europe Market Value Share (%) and BPS Analysis by Application, 2023 to 2033
Figure 170: Eastern Europe Market Y-o-Y Growth (%) Projections by Application, 2023 to 2033
Figure 171: Eastern Europe Market Value (US$ Million) Analysis by End-User, 2018 to 2033
Figure 172: Eastern Europe Market Volume (Units) Analysis by End-User, 2018 to 2033
Figure 173: Eastern Europe Market Value Share (%) and BPS Analysis by End-User, 2023 to 2033
Figure 174: Eastern Europe Market Y-o-Y Growth (%) Projections by End-User, 2023 to 2033
Figure 175: Eastern Europe Market Attractiveness by Printing Technology, 2023 to 2033
Figure 176: Eastern Europe Market Attractiveness by Material, 2023 to 2033
Figure 177: Eastern Europe Market Attractiveness by Adhesive Type, 2023 to 2033
Figure 178: Eastern Europe Market Attractiveness by Application, 2023 to 2033
Figure 179: Eastern Europe Market Attractiveness by End-User, 2023 to 2033
Figure 180: Eastern Europe Market Attractiveness by Country, 2023 to 2033
Figure 181: South Asia and Pacific Market Value (US$ Million) by Printing Technology, 2023 to 2033
Figure 182: South Asia and Pacific Market Value (US$ Million) by Material, 2023 to 2033
Figure 183: South Asia and Pacific Market Value (US$ Million) by Adhesive Type, 2023 to 2033
Figure 184: South Asia and Pacific Market Value (US$ Million) by Application, 2023 to 2033
Figure 185: South Asia and Pacific Market Value (US$ Million) by End-User, 2023 to 2033
Figure 186: South Asia and Pacific Market Value (US$ Million) by Country, 2023 to 2033
Figure 187: South Asia and Pacific Market Value (US$ Million) Analysis by Country, 2018 to 2033
Figure 188: South Asia and Pacific Market Volume (Units) Analysis by Country, 2018 to 2033
Figure 189: South Asia and Pacific Market Value Share (%) and BPS Analysis by Country, 2023 to 2033
Figure 190: South Asia and Pacific Market Y-o-Y Growth (%) Projections by Country, 2023 to 2033
Figure 191: South Asia and Pacific Market Value (US$ Million) Analysis by Printing Technology, 2018 to 2033
Figure 192: South Asia and Pacific Market Volume (Units) Analysis by Printing Technology, 2018 to 2033
Figure 193: South Asia and Pacific Market Value Share (%) and BPS Analysis by Printing Technology, 2023 to 2033
Figure 194: South Asia and Pacific Market Y-o-Y Growth (%) Projections by Printing Technology, 2023 to 2033
Figure 195: South Asia and Pacific Market Value (US$ Million) Analysis by Material, 2018 to 2033
Figure 196: South Asia and Pacific Market Volume (Units) Analysis by Material, 2018 to 2033
Figure 197: South Asia and Pacific Market Value Share (%) and BPS Analysis by Material, 2023 to 2033
Figure 198: South Asia and Pacific Market Y-o-Y Growth (%) Projections by Material, 2023 to 2033
Figure 199: South Asia and Pacific Market Value (US$ Million) Analysis by Adhesive Type, 2018 to 2033
Figure 200: South Asia and Pacific Market Volume (Units) Analysis by Adhesive Type, 2018 to 2033
Figure 201: South Asia and Pacific Market Value Share (%) and BPS Analysis by Adhesive Type, 2023 to 2033
Figure 202: South Asia and Pacific Market Y-o-Y Growth (%) Projections by Adhesive Type, 2023 to 2033
Figure 203: South Asia and Pacific Market Value (US$ Million) Analysis by Application, 2018 to 2033
Figure 204: South Asia and Pacific Market Volume (Units) Analysis by Application, 2018 to 2033
Figure 205: South Asia and Pacific Market Value Share (%) and BPS Analysis by Application, 2023 to 2033
Figure 206: South Asia and Pacific Market Y-o-Y Growth (%) Projections by Application, 2023 to 2033
Figure 207: South Asia and Pacific Market Value (US$ Million) Analysis by End-User, 2018 to 2033
Figure 208: South Asia and Pacific Market Volume (Units) Analysis by End-User, 2018 to 2033
Figure 209: South Asia and Pacific Market Value Share (%) and BPS Analysis by End-User, 2023 to 2033
Figure 210: South Asia and Pacific Market Y-o-Y Growth (%) Projections by End-User, 2023 to 2033
Figure 211: South Asia and Pacific Market Attractiveness by Printing Technology, 2023 to 2033
Figure 212: South Asia and Pacific Market Attractiveness by Material, 2023 to 2033
Figure 213: South Asia and Pacific Market Attractiveness by Adhesive Type, 2023 to 2033
Figure 214: South Asia and Pacific Market Attractiveness by Application, 2023 to 2033
Figure 215: South Asia and Pacific Market Attractiveness by End-User, 2023 to 2033
Figure 216: South Asia and Pacific Market Attractiveness by Country, 2023 to 2033
Figure 217: East Asia Market Value (US$ Million) by Printing Technology, 2023 to 2033
Figure 218: East Asia Market Value (US$ Million) by Material, 2023 to 2033
Figure 219: East Asia Market Value (US$ Million) by Adhesive Type, 2023 to 2033
Figure 220: East Asia Market Value (US$ Million) by Application, 2023 to 2033
Figure 221: East Asia Market Value (US$ Million) by End-User, 2023 to 2033
Figure 222: East Asia Market Value (US$ Million) by Country, 2023 to 2033
Figure 223: East Asia Market Value (US$ Million) Analysis by Country, 2018 to 2033
Figure 224: East Asia Market Volume (Units) Analysis by Country, 2018 to 2033
Figure 225: East Asia Market Value Share (%) and BPS Analysis by Country, 2023 to 2033
Figure 226: East Asia Market Y-o-Y Growth (%) Projections by Country, 2023 to 2033
Figure 227: East Asia Market Value (US$ Million) Analysis by Printing Technology, 2018 to 2033
Figure 228: East Asia Market Volume (Units) Analysis by Printing Technology, 2018 to 2033
Figure 229: East Asia Market Value Share (%) and BPS Analysis by Printing Technology, 2023 to 2033
Figure 230: East Asia Market Y-o-Y Growth (%) Projections by Printing Technology, 2023 to 2033
Figure 231: East Asia Market Value (US$ Million) Analysis by Material, 2018 to 2033
Figure 232: East Asia Market Volume (Units) Analysis by Material, 2018 to 2033
Figure 233: East Asia Market Value Share (%) and BPS Analysis by Material, 2023 to 2033
Figure 234: East Asia Market Y-o-Y Growth (%) Projections by Material, 2023 to 2033
Figure 235: East Asia Market Value (US$ Million) Analysis by Adhesive Type, 2018 to 2033
Figure 236: East Asia Market Volume (Units) Analysis by Adhesive Type, 2018 to 2033
Figure 237: East Asia Market Value Share (%) and BPS Analysis by Adhesive Type, 2023 to 2033
Figure 238: East Asia Market Y-o-Y Growth (%) Projections by Adhesive Type, 2023 to 2033
Figure 239: East Asia Market Value (US$ Million) Analysis by Application, 2018 to 2033
Figure 240: East Asia Market Volume (Units) Analysis by Application, 2018 to 2033
Figure 241: East Asia Market Value Share (%) and BPS Analysis by Application, 2023 to 2033
Figure 242: East Asia Market Y-o-Y Growth (%) Projections by Application, 2023 to 2033
Figure 243: East Asia Market Value (US$ Million) Analysis by End-User, 2018 to 2033
Figure 244: East Asia Market Volume (Units) Analysis by End-User, 2018 to 2033
Figure 245: East Asia Market Value Share (%) and BPS Analysis by End-User, 2023 to 2033
Figure 246: East Asia Market Y-o-Y Growth (%) Projections by End-User, 2023 to 2033
Figure 247: East Asia Market Attractiveness by Printing Technology, 2023 to 2033
Figure 248: East Asia Market Attractiveness by Material, 2023 to 2033
Figure 249: East Asia Market Attractiveness by Adhesive Type, 2023 to 2033
Figure 250: East Asia Market Attractiveness by Application, 2023 to 2033
Figure 251: East Asia Market Attractiveness by End-User, 2023 to 2033
Figure 252: East Asia Market Attractiveness by Country, 2023 to 2033
Figure 253: Middle East and Africa Market Value (US$ Million) by Printing Technology, 2023 to 2033
Figure 254: Middle East and Africa Market Value (US$ Million) by Material, 2023 to 2033
Figure 255: Middle East and Africa Market Value (US$ Million) by Adhesive Type, 2023 to 2033
Figure 256: Middle East and Africa Market Value (US$ Million) by Application, 2023 to 2033
Figure 257: Middle East and Africa Market Value (US$ Million) by End-User, 2023 to 2033
Figure 258: Middle East and Africa Market Value (US$ Million) by Country, 2023 to 2033
Figure 259: Middle East and Africa Market Value (US$ Million) Analysis by Country, 2018 to 2033
Figure 260: Middle East and Africa Market Volume (Units) Analysis by Country, 2018 to 2033
Figure 261: Middle East and Africa Market Value Share (%) and BPS Analysis by Country, 2023 to 2033
Figure 262: Middle East and Africa Market Y-o-Y Growth (%) Projections by Country, 2023 to 2033
Figure 263: Middle East and Africa Market Value (US$ Million) Analysis by Printing Technology, 2018 to 2033
Figure 264: Middle East and Africa Market Volume (Units) Analysis by Printing Technology, 2018 to 2033
Figure 265: Middle East and Africa Market Value Share (%) and BPS Analysis by Printing Technology, 2023 to 2033
Figure 266: Middle East and Africa Market Y-o-Y Growth (%) Projections by Printing Technology, 2023 to 2033
Figure 267: Middle East and Africa Market Value (US$ Million) Analysis by Material, 2018 to 2033
Figure 268: Middle East and Africa Market Volume (Units) Analysis by Material, 2018 to 2033
Figure 269: Middle East and Africa Market Value Share (%) and BPS Analysis by Material, 2023 to 2033
Figure 270: Middle East and Africa Market Y-o-Y Growth (%) Projections by Material, 2023 to 2033
Figure 271: Middle East and Africa Market Value (US$ Million) Analysis by Adhesive Type, 2018 to 2033
Figure 272: Middle East and Africa Market Volume (Units) Analysis by Adhesive Type, 2018 to 2033
Figure 273: Middle East and Africa Market Value Share (%) and BPS Analysis by Adhesive Type, 2023 to 2033
Figure 274: Middle East and Africa Market Y-o-Y Growth (%) Projections by Adhesive Type, 2023 to 2033
Figure 275: Middle East and Africa Market Value (US$ Million) Analysis by Application, 2018 to 2033
Figure 276: Middle East and Africa Market Volume (Units) Analysis by Application, 2018 to 2033
Figure 277: Middle East and Africa Market Value Share (%) and BPS Analysis by Application, 2023 to 2033
Figure 278: Middle East and Africa Market Y-o-Y Growth (%) Projections by Application, 2023 to 2033
Figure 279: Middle East and Africa Market Value (US$ Million) Analysis by End-User, 2018 to 2033
Figure 280: Middle East and Africa Market Volume (Units) Analysis by End-User, 2018 to 2033
Figure 281: Middle East and Africa Market Value Share (%) and BPS Analysis by End-User, 2023 to 2033
Figure 282: Middle East and Africa Market Y-o-Y Growth (%) Projections by End-User, 2023 to 2033
Figure 283: Middle East and Africa Market Attractiveness by Printing Technology, 2023 to 2033
Figure 284: Middle East and Africa Market Attractiveness by Material, 2023 to 2033
Figure 285: Middle East and Africa Market Attractiveness by Adhesive Type, 2023 to 2033
Figure 286: Middle East and Africa Market Attractiveness by Application, 2023 to 2033
Figure 287: Middle East and Africa Market Attractiveness by End-User, 2023 to 2033
Figure 288: Middle East and Africa Market Attractiveness by Country, 2023 to 2033
The global sales of pre-printed tapes are poised to surge at 3% CAGR through 2033.
The global market could have a value of around USD 41.2 billion in 2023.
Rising demand is expected to drive North America market at 28% CAGR through 2033.
The overall market may witness a growth of 24% per year till 2033.
China is expected to drive the regional market in the coming days.
Explore Similar Insights
Thank you!
You will receive an email from our Business Development Manager. Please be sure to check your SPAM/JUNK folder too.