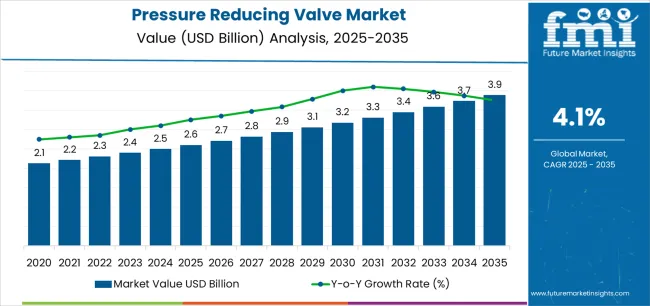
The pressure reducing valve market stands at the threshold of a decade-long expansion trajectory that promises to reshape fluid control technology and pressure management solutions. The market's journey from USD 2.6 billion in 2025 to USD 3.9 billion by 2035 represents substantial growth, demonstrating the accelerating adoption of advanced pressure control technology and fluid management optimization across residential facilities, industrial operations, and commercial infrastructure sectors.
The first half of the decade (2025-2030) will witness the market climbing from USD 2.6 billion to approximately USD 3.2 billion, adding USD 0.6 billion in value, which constitutes 46% of the total forecast growth period. This phase will be characterized by the rapid adoption of direct acting valve systems, driven by increasing industrial fluid control requirements and the growing need for advanced pressure regulation solutions worldwide. Enhanced control capabilities and automated monitoring systems will become standard expectations rather than premium options.
The latter half (2030-2035) will witness continued growth from USD 3.2 billion to USD 3.9 billion, representing an addition of USD 0.7 billion or 54% of the decade's expansion. This period will be defined by mass market penetration of intelligent pressure control technologies, integration with comprehensive fluid management platforms, and seamless compatibility with existing industrial infrastructure. The market trajectory signals fundamental shifts in how facilities approach pressure regulation and system optimization, with participants positioned to benefit from growing demand across multiple valve types and pressure segments.
| Period | Primary Revenue Buckets | Share | Notes |
|---|---|---|---|
| Today | New valve sales (direct acting, pilot operating) | 42% | Capex-led, system integration-driven purchases |
| Spare parts & components | 23% | Diaphragms, springs, seals for maintenance | |
| Service & maintenance contracts | 20% | Preventive maintenance, calibration support | |
| Upgrades & retrofits | 15% | Technology enhancement, pressure optimization | |
| Future (3-5 yrs) | Intelligent valve systems | 38-42% | IoT integration, smart pressure monitoring |
| Digital monitoring & analytics | 18-22% | Real-time pressure tracking, predictive maintenance | |
| Service-as-a-subscription | 16-20% | Performance guarantees, uptime-based pricing | |
| Components & replacement parts | 12-16% | Precision components, specialized materials | |
| Installation & commissioning services | 8-12% | System integration, pressure testing support | |
| Data services (pressure metrics, system efficiency, compliance) | 4-6% | Benchmarking for facility operators |
| Metric | Value |
|---|---|
| Market Value (2025) | USD 2.6 billion |
| Market Forecast (2035) | USD 3.9 billion |
| Growth Rate | 4.1% CAGR |
| Leading Product | Direct Acting Valves |
| Primary Application | Residential Segment |
The market demonstrates strong fundamentals with direct acting valve systems capturing a dominant share through advanced pressure control capabilities and fluid management optimization. Residential applications drive primary demand, supported by increasing building construction and pressure regulation requirements. Geographic expansion remains concentrated in developed markets with established infrastructure, while emerging economies show accelerating adoption rates driven by urbanization initiatives and rising safety standards.
Design for precision, not just pressure reduction
Primary Classification: The market segments by product type into direct acting valves and pilot operating valves, representing the evolution from basic pressure control equipment to sophisticated regulation solutions for comprehensive fluid management optimization.
Secondary Classification: Material type segmentation divides the market into stainless steel, cast steel, carbon steel, cast iron, ductile iron, and others sectors, reflecting distinct requirements for durability, corrosion resistance, and operational standards.
Tertiary Classification: Operating pressure segmentation covers 50 to 200 psig, 201 to 500 psig, 501 to 800 psig, and above 800 psig ranges, while application types span liquid, gas, and steam. End-use applications encompass residential, commercial, industrial, power generation, pharmaceuticals, pulp & paper, chemicals, food & beverages, oil & gas, and others.
Regional Classification: Geographic distribution covers North America, Latin America, Western Europe, Eastern Europe, East Asia, South Asia Pacific, and Middle East & Africa, with developed markets leading adoption while emerging economies show accelerating growth patterns driven by industrial expansion programs.
The segmentation structure reveals technology progression from standard pressure control equipment toward sophisticated regulation systems with enhanced precision and monitoring capabilities, while application diversity spans from residential facilities to industrial operations requiring precise pressure management solutions.
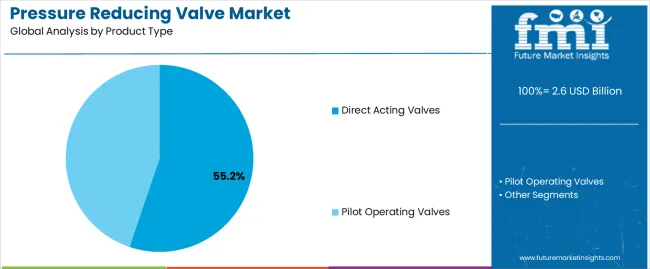
Market Position: Direct Acting Valves systems command the leading position in the pressure reducing valve market with 55.2% market share through advanced pressure control features, including superior regulation accuracy, operational efficiency, and fluid management optimization that enable facilities to achieve optimal pressure consistency across diverse residential, commercial, and industrial environments.
Value Drivers: The segment benefits from facility operator preference for reliable pressure control systems that provide consistent regulation performance, simplified installation, and operational efficiency optimization without requiring complex pilot systems or infrastructure modifications. Advanced design features enable automated pressure adjustment, flow consistency, and integration with existing fluid management equipment, where operational performance and safety compliance represent critical facility requirements.
Competitive Advantages: Direct Acting Valves systems differentiate through proven operational reliability, consistent pressure characteristics, and integration with residential and commercial systems that enhance facility effectiveness while maintaining optimal safety standards suitable for diverse fluid management applications.
Key market characteristics:
Within Direct Acting Valves, Industrial applications lead with 40.0% share, driven by process control requirements and manufacturing facility demand for precise pressure regulation in production operations. Residential applications account for 34.0% share through building plumbing systems, water distribution networks, and household pressure management requirements. Commercial applications capture 27.0% share, including office buildings, retail facilities, and institutional infrastructure requiring reliable pressure control solutions.
Pilot Operating Valves maintain a 44.8% market position in the pressure reducing valve market due to their high-capacity properties and precision advantages. These systems appeal to facilities requiring large flow capacity with accurate downstream pressure control for high-volume industrial applications. Market growth is driven by industrial expansion, emphasizing reliable pressure regulation solutions and operational efficiency through advanced valve designs.
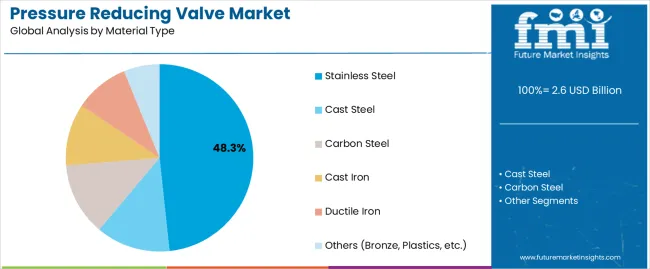
Market Context: Stainless Steel valves demonstrate strong market dominance in the pressure reducing valve market with 48.3% market share due to widespread adoption of corrosion-resistant systems and increasing focus on durability optimization, operational longevity, and fluid compatibility applications that maximize valve lifespan while maintaining performance standards.
Appeal Factors: Stainless Steel valve operators prioritize material durability, corrosion resistance, and compatibility with diverse fluid types that enables reliable operations across multiple application scenarios. The segment benefits from substantial industrial investment and modernization programs that emphasize the acquisition of stainless steel valves for longevity optimization and maintenance reduction applications.
Growth Drivers: Industrial expansion programs incorporate stainless steel valves as standard equipment for fluid control operations, while pharmaceutical and food processing growth increases demand for sanitary material capabilities that comply with hygiene standards and minimize contamination risks.
Market Challenges: Higher material costs and fabrication complexity may limit adoption in cost-sensitive applications or budget-constrained scenarios.
Application dynamics include:
Cast Steel applications capture 20.0% market share through high-pressure requirements in industrial facilities, power generation, and heavy-duty applications requiring robust pressure control and structural durability capabilities.
Carbon Steel applications account for 15.0% market share, including general industrial operations, water distribution, and standard pressure control applications where cost considerations balance with performance requirements.
Cast Iron applications capture 8.0% market share through established infrastructure requirements in municipal water systems, legacy installations, and traditional plumbing applications demanding proven pressure control materials.
Ductile Iron applications account for 5.0% market share, including water distribution networks, municipal infrastructure, and impact-resistant applications requiring enhanced material properties over standard cast iron.
Others materials capture 3.7% market share, encompassing bronze valves for marine applications, plastic valves for corrosive environments, and specialized material solutions for unique pressure control requirements.
Market Position: 50 to 200 Psig pressure range commands significant market position with 40.0% market share through optimal pressure balance that meets versatility and application flexibility for diverse residential and commercial applications.
Value Drivers: This pressure range provides the ideal combination of control capability and broad applicability, meeting requirements for building systems, water distribution, and general industrial applications without excessive pressure complexity or specialized equipment.
Growth Characteristics: The segment benefits from broad applicability across residential and commercial sectors, standardized pressure specifications, and established infrastructure programs that support widespread adoption and operational efficiency.
201 to 500 Psig applications capture 33.0% market share through industrial process requirements, manufacturing facilities, and commercial operations requiring moderate to high pressure control capabilities.
501 to 800 Psig applications account for 15.0% market share, including high-pressure industrial processes, power generation facilities, and specialized applications demanding robust pressure regulation under elevated pressure conditions.
Above 800 Psig applications capture 12.0% market share through extreme pressure requirements in oil & gas operations, chemical processing, and specialized industrial applications requiring maximum pressure control capabilities.
Market Context: Liquid applications dominate the market with 45.0% market share, reflecting the primary demand source for pressure reducing valve technology in water systems, process fluids, and chemical distribution operations.
Business Model Advantages: Liquid control systems provide direct market demand for advanced valve equipment, driving technology innovation and precision enhancement while maintaining flow consistency and operational efficiency requirements.
Operational Benefits: Liquid applications include water distribution, chemical processing, and industrial fluid management that drive consistent demand for valve systems while providing access to latest control technologies.
Gas applications capture 30.0% market share through natural gas distribution requirements, compressed air systems, and industrial gas control operations requiring specialized pressure regulation and safety compliance.
Steam applications account for 25.0% market share, including power generation, heating systems, and industrial process steam requiring high-temperature pressure control and thermal management capabilities.
Market Context: Residential applications lead the market with 27.0% market share due to widespread building construction and household plumbing system requirements for pressure control and water management.
Business Model Advantages: Residential installations provide consistent market demand for valve equipment, driven by new construction, renovation projects, and infrastructure upgrades requiring reliable pressure regulation solutions.
Operational Benefits: Residential applications include household plumbing, water distribution, and building systems that drive steady demand for valve products while supporting standardized installation practices.
Commercial applications capture 22.0% market share through building management requirements in office complexes, retail facilities, hotels, and institutional buildings requiring centralized pressure control systems.
Industrial applications account for 25.0% market share, including manufacturing facilities, processing plants, and production operations requiring precise pressure regulation for process optimization and equipment protection.
Power Generation applications capture 8.0% market share through steam system requirements, cooling water management, and plant operations demanding reliable pressure control under demanding operating conditions.
Pharmaceuticals applications account for 5.0% market share, including cleanroom facilities, process systems, and manufacturing operations requiring validated pressure control and contamination prevention.
Pulp & Paper applications capture 5.0% market share through process steam requirements, chemical distribution, and production operations requiring consistent pressure regulation and reliability.
Chemicals applications account for 4.0% market share, including process control, corrosive fluid handling, and specialized manufacturing requiring material-compatible pressure regulation solutions.
Food & Beverages applications capture 4.0% market share through sanitary process requirements, steam control, and production operations demanding hygienic pressure regulation and cleaning validation.
Oil & Gas applications account for 3.0% market share, including upstream operations, refining processes, and distribution systems requiring high-pressure control and hazardous environment compatibility.
Others applications capture 2.0% market share, encompassing marine systems, mining operations, and specialized industrial applications requiring customized pressure reducing valve solutions.
| Category | Factor | Impact | Why It Matters |
|---|---|---|---|
| Driver | Urbanization & residential construction growth | ★★★★★ | Expanding building infrastructure requires reliable pressure control systems with consistent performance and safety compliance across plumbing networks. |
| Driver | Industrial expansion & process automation | ★★★★★ | Transforms advanced pressure control from "optional" to "mandatory"; vendors that provide precision regulation and integration support gain competitive advantage. |
| Driver | Water infrastructure modernization & efficiency programs | ★★★★☆ | Municipal systems need advanced pressure management; demand for leak reduction and energy efficiency expanding addressable market. |
| Restraint | Price sensitivity & competition from low-cost alternatives | ★★★★☆ | Small facility operators defer premium purchases; increases cost pressure and slows advanced technology adoption in emerging markets. |
| Restraint | Complex installation requirements & maintenance needs | ★★★☆☆ | Multi-application facilities face lengthy commissioning procedures and calibration requirements, limiting operational flexibility and increasing complexity. |
| Trend | IoT integration & smart monitoring | ★★★★★ | Real-time pressure tracking, predictive maintenance, and data analytics transform operations; digital connectivity and remote monitoring become core value propositions. |
| Trend | Energy efficiency & sustainability focus | ★★★★☆ | Efficient pressure control systems reduce energy consumption; demand for optimization capabilities and green building compliance driving competition. |
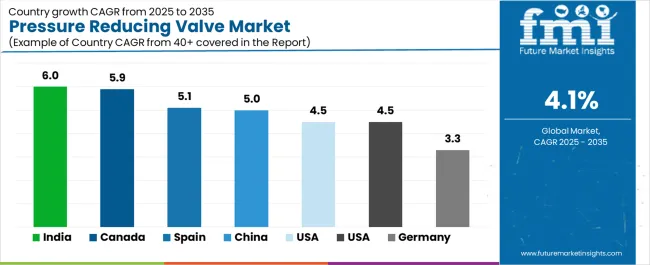
The pressure reducing valve market demonstrates varied regional dynamics with Growth Leaders including India (6.0% growth rate) and Canada (5.9% growth rate) driving expansion through rapid industrialization initiatives and infrastructure development. Steady Performers encompass Spain (5.1% growth rate), China (5.0% growth rate), and developing regions, benefiting from urbanization and industrial expansion. Mature Markets feature United States (4.5% growth rate), Australia (4.5% growth rate), and Germany (3.3% growth rate), where established infrastructure and replacement demand support consistent growth patterns.
Regional synthesis reveals South Asian markets leading adoption through industrial development and urban infrastructure expansion, while North American countries maintain steady expansion supported by residential construction and industrial facility modernization. European markets show moderate growth driven by infrastructure upgrade applications and safety regulation compliance trends.
| Region/Country | 2025-2035 Growth | How to win | What to watch out |
|---|---|---|---|
| India | 6.0% | Focus on cost-effective solutions | Infrastructure delays; payment cycles |
| Canada | 5.9% | Lead with industrial systems | Resource sector volatility; skilled labor |
| Spain | 5.1% | Provide gas distribution expertise | Economic uncertainty; regulatory changes |
| China | 5.0% | Target urbanization projects | Localization requirements; price competition |
| USA | 4.5% | Offer smart valve solutions | Regulatory complexity; installation costs |
| Australia | 4.5% | Push water efficiency systems | Climate variability; remote service challenges |
| Germany | 3.3% | Deliver precision engineering | Over-specification; lengthy approval cycles |
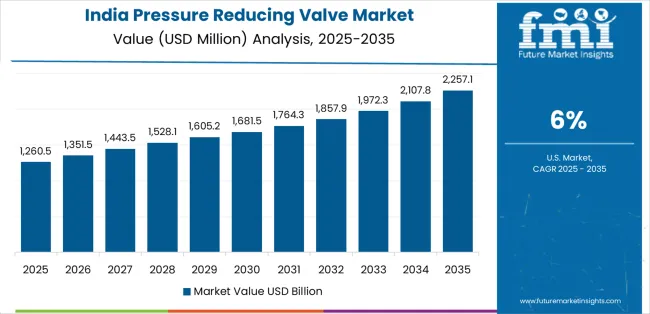
India establishes fastest market growth through aggressive industrialization programs and comprehensive urban infrastructure development, integrating advanced pressure reducing valves as standard components in building construction and industrial facility installations. The country's 6.0% growth rate reflects government initiatives promoting manufacturing expansion and Smart Cities Mission programs that mandate the use of reliable pressure control systems in residential, commercial, and industrial facilities. Growth concentrates in major urban centers, including Mumbai, Delhi, and Bangalore, where infrastructure development showcases integrated valve systems that appeal to facility operators seeking advanced pressure management capabilities and water conservation applications.
Indian manufacturers are developing cost-effective valve solutions that combine domestic production advantages with adequate performance features, including basic pressure regulation and durable construction capabilities. Distribution channels through plumbing equipment suppliers and industrial distributors expand market access, while government support for infrastructure development supports adoption across diverse residential and industrial segments.
Strategic Market Indicators:
In Toronto, Calgary, and Vancouver, industrial facilities and resource extraction operations are implementing advanced pressure reducing valves as standard equipment for process optimization and safety compliance applications, driven by increasing industrial investment and infrastructure modernization programs that emphasize the importance of reliable pressure control capabilities. The market holds a 5.9% growth rate, supported by mining sector expansion and oil & gas infrastructure programs that promote advanced valve systems for industrial and commercial facilities. Canadian operators are adopting valve systems that provide consistent operational performance and safety compliance features, particularly appealing in resource regions where process reliability and environmental standards represent critical operational requirements.
Market expansion benefits from growing industrial capabilities and water infrastructure upgrade initiatives that enable modernization of aging pressure control systems for municipal and commercial applications. Technology adoption follows patterns established in industrial equipment, where reliability and safety drive procurement decisions and operational deployment.
Market Intelligence Brief:
Spain demonstrates strong market growth through gas distribution network expansion and comprehensive infrastructure modernization development, integrating pressure reducing valves across residential and industrial gas applications. The country's 5.1% growth rate reflects government energy infrastructure investment and safety regulation implementation that supports adoption of pressure control systems in natural gas distribution and facility operations. Growth concentrates in major cities, including Madrid, Barcelona, and Valencia, where gas network development showcases valve installations that appeal to utility operators seeking safety compliance capabilities.
Spanish infrastructure providers are adopting advanced valve solutions that balance performance characteristics with regulatory compliance requirements, particularly important in gas distribution and commercial building applications. The market benefits from growing natural gas infrastructure and increasing safety awareness in residential and commercial sectors.
Market Intelligence Brief:
In Beijing, Shanghai, and Guangzhou, residential developments and industrial facilities are implementing pressure reducing valves as standard equipment for building systems and process control applications, driven by increasing urbanization investment and manufacturing expansion programs that emphasize the importance of reliable pressure regulation capabilities. The market holds a 5.0% growth rate, supported by government urban development initiatives and industrial modernization programs that promote valve systems for residential and industrial facilities. Chinese operators are adopting valve systems that provide consistent operational performance and cost-effective features, particularly appealing in urban regions where building construction and water management represent critical infrastructure requirements.
Market expansion benefits from massive residential construction volumes and industrial park development that enables widespread adoption of pressure control systems for building and manufacturing applications. Technology adoption follows patterns established in construction equipment, where affordability and availability drive procurement decisions and operational deployment.
Market Intelligence Brief:
USA establishes market leadership through comprehensive residential construction programs and advanced industrial infrastructure development, integrating pressure reducing valves across residential, commercial, and industrial applications. The country's 4.5% growth rate reflects established building code relationships and mature pressure control technology adoption that supports widespread use of regulation systems in plumbing and process facilities. Growth concentrates in major metropolitan areas and industrial centers, including Texas, California, and the Northeast corridor, where construction activity showcases mature valve deployment that appeals to facility operators seeking proven pressure control capabilities and code compliance applications.
American equipment providers leverage established distribution networks and comprehensive code compliance support, including technical documentation and certification programs that create customer relationships and operational advantages. The market benefits from FHA regulations and building standards that mandate pressure control valve use while supporting technology advancement and operational optimization.
Market Intelligence Brief:
Australia demonstrates market growth through water resource management initiatives and comprehensive infrastructure development, integrating pressure reducing valves across residential and agricultural applications. The country's 4.5% growth rate reflects government water conservation programs and drought management strategies that support adoption of pressure control systems in urban and rural facilities. Growth concentrates in major cities, including Sydney, Melbourne, and Brisbane, where water infrastructure showcases valve installations that appeal to facility operators seeking efficiency optimization capabilities.
Australian operators are adopting pressure management solutions that reduce water waste and improve distribution efficiency, particularly important in water-stressed regions where conservation and leak reduction represent critical operational priorities. The market benefits from government water efficiency mandates and infrastructure upgrade programs supporting valve technology advancement.
Market Intelligence Brief:
Germany's advanced industrial technology market demonstrates sophisticated pressure reducing valve deployment with documented operational effectiveness in manufacturing applications and fluid control systems through integration with existing automation platforms and facility infrastructure. The country leverages engineering expertise in precision control technology and process integration to maintain a 3.3% growth rate. Industrial centers, including Baden-Württemberg, Bavaria, and North Rhine-Westphalia, showcase premium installations where valve systems integrate with comprehensive process control platforms and facility management systems to optimize production operations and quality effectiveness.
German manufacturers prioritize valve precision and EU compliance in equipment development, creating demand for premium systems with advanced features, including process monitoring integration and automated pressure adjustment systems. The market benefits from established industrial technology infrastructure and willingness to invest in precision control technologies that provide long-term operational benefits and compliance with international manufacturing standards.
Market Intelligence Brief:
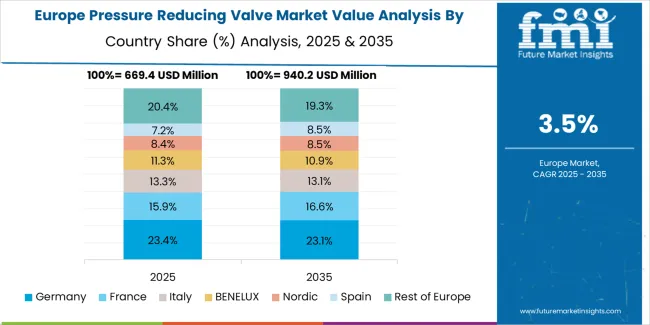
The pressure reducing valve market in Europe is projected to grow from USD 2.4 billion in 2025 to USD 3.5 billion by 2035, registering a CAGR of 3.9% over the forecast period. Germany is expected to maintain its leadership position with a 23.4% market share in 2025, declining slightly to 23.0% by 2035, supported by its advanced industrial infrastructure and precision manufacturing requirements in automotive and chemical sectors.
France follows with a 17.6% share in 2025, projected to reach 17.9% by 2035, driven by water management programs in agriculture and residential market expansion initiatives. United Kingdom holds a 14.6% share in 2025, expected to reach 14.5% by 2035 through residential and commercial HVAC systems and water infrastructure modernization projects. Italy commands a 13.4% share, while Spain accounts for 16.3% in 2025, rising to 16.5% by 2035, supported by strong demand for gas pressure control in natural gas distribution networks and industrial applications. The Rest of Europe region constitutes 14.6% in 2025, reaching 14.8% by 2035, attributed to ongoing infrastructure development in Eastern European countries and Nordic region facility modernization programs.
| Stakeholder | What they actually control | Typical strengths | Typical blind spots |
|---|---|---|---|
| Global platforms | Distribution reach, comprehensive product portfolios, service networks | Broad availability, proven reliability, multi-region support | Technology refresh cycles; customer lock-in dependency |
| Technology innovators | R&D capabilities; smart valve systems; IoT monitoring interfaces | Latest features first; attractive ROI on intelligent control applications | Service density outside core regions; installation complexity |
| Regional specialists | Local compliance, fast delivery, nearby technical support | "Close to site" service; pragmatic pricing; local building codes | Technology gaps; talent retention in technical services |
| Service-focused ecosystems | Installation support, maintenance SLAs, calibration services | Lowest real downtime; comprehensive support packages | Service costs if overpromised; technology obsolescence |
| Niche specialists | Specialized applications, custom materials, extreme pressure solutions | Win process industry applications; specialized certifications | Scalability limitations; narrow market focus |
| Item | Value |
|---|---|
| Quantitative Units | USD 2.6 billion |
| Product Type | Direct Acting Valves, Pilot Operating Valves |
| Material Type | Stainless Steel, Cast Steel, Carbon Steel, Cast Iron, Ductile Iron, Others |
| Operating Pressure | 50 to 200 Psig, 201 to 500 Psig, 501 to 800 Psig, Above 800 Psig |
| Application | Liquid, Gas, Steam |
| End Use | Residential, Commercial, Industrial, Power Generation, Pharmaceuticals, Pulp & Paper, Chemicals, Food & Beverages, Oil & Gas, Others |
| Regions Covered | North America, Latin America, Western Europe, Eastern Europe, East Asia, South Asia Pacific, Middle East & Africa |
| Countries Covered | United States, China, Germany, India, Canada, Spain, Australia, United Kingdom, France, Italy, and 25+ additional countries |
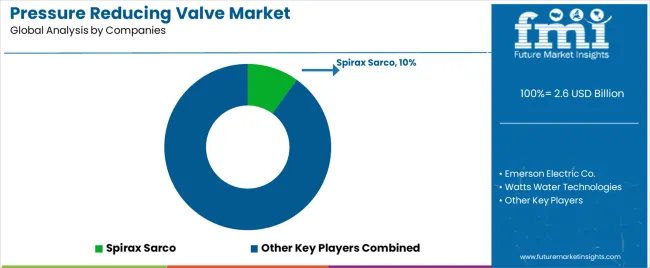
| Key Companies Profiled | Spirax Sarco, Emerson Electric Co., Watts Water Technologies, Danfoss A/S, Parker Hannifin, CIRCOR International Inc., Honeywell International, Cla-Val, Xylem Inc., Flowserve Corporation |
| Additional Attributes | Dollar sales by product type and material categories, regional adoption trends across South Asia Pacific, North America, and Western Europe, competitive landscape with valve manufacturers and fluid control suppliers, facility operator preferences for pressure regulation control and system reliability, integration with building management platforms and process control systems, innovations in valve technology and precision enhancement, and development of intelligent valve solutions with enhanced performance and operational optimization capabilities. |
The global pressure reducing valve market is estimated to be valued at USD 2.6 billion in 2025.
The market size for the pressure reducing valve market is projected to reach USD 3.9 billion by 2035.
The pressure reducing valve market is expected to grow at a 4.1% CAGR between 2025 and 2035.
The key product types in pressure reducing valve market are direct acting valves and pilot operating valves.
In terms of material type, stainless steel segment to command 48.3% share in the pressure reducing valve market in 2025.


Full Research Suite comprises of:
Market outlook & trends analysis
Interviews & case studies
Strategic recommendations
Vendor profiles & capabilities analysis
5-year forecasts
8 regions and 60+ country-level data splits
Market segment data splits
12 months of continuous data updates
DELIVERED AS:
PDF EXCEL ONLINE
Pressure Compensated Pump Market Size and Share Forecast Outlook 2025 to 2035
Pressure Switch Market Forecast Outlook 2025 to 2035
Pressure-Volume Loop Systems Market Size and Share Forecast Outlook 2025 to 2035
Pressure Transmitter Market Size and Share Forecast Outlook 2025 to 2035
Pressure Monitoring Extension Tubing Sets Market Size and Share Forecast Outlook 2025 to 2035
Pressure Sensitive Labeling Machine Market Size and Share Forecast Outlook 2025 to 2035
Pressure Bandages Market Size and Share Forecast Outlook 2025 to 2035
Pressure-Sensitive Adhesives Market Size and Share Forecast Outlook 2025 to 2035
Pressure Gauges Market Size and Share Forecast Outlook 2025 to 2035
Pressure-Controlled Vacuum Sealers Market Size and Share Forecast Outlook 2025 to 2035
Pressure Sensitive Tapes and Labels Market Size, Share & Forecast 2025 to 2035
Pressure Infusion Bags Market Analysis - Size, Share, and Forecast 2025 to 2035
Pressure Ulcer Detection Devices Market Trends – Growth & Forecast 2025 to 2035
Pressure Cushions Market Trends - Growth, Size & Forecast 2025 to 2035
Pressure Infusion Cuffs Market Growth – Trends & Future Outlook 2024-2034
Pressure Cookers Market
Pressure Calibrator Market
Pressure Redistribution Pads Market
Pressure Relief Valve Market Size and Share Forecast Outlook 2025 to 2035
Pressure Relief Valve (PRV) Market

Thank you!
You will receive an email from our Business Development Manager. Please be sure to check your SPAM/JUNK folder too.
Chat With
MaRIA