
- Market Size (2026)
- USD 2280.0 Mn
- Forecast (2036)
- USD 7081.3 Mn
- CAGR (2026 to 2036)
- 12.0%
How big is the Progressive Web Apps Market in 2026?
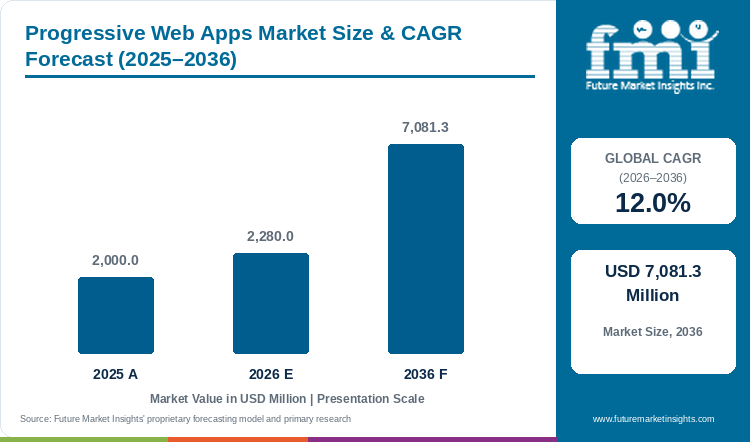
The global progressive web apps market is on course to reach USD 7,081.3 million by 2036, a 12.0% CAGR from 2026 to 2036. The market was valued at USD 2,000.0 million in 2025 and is estimated at USD 2,280.0 million in 2026.
Progressive Web Apps Market Size and Forecast
Table 1: Progressive Web Apps Market Size and Forecast
| Market size and forecast | Value |
|---|---|
| Market size in 2025 | USD 2,000.0 million |
| Estimated market size in 2026 | USD 2,280.0 million |
| Projected market size by 2036 | USD 7,081.3 million |
| CAGR from 2026 to 2036 | 12.0% |
Source: Future Market Insights analysis of the progressive web apps market, 2026.
Browser distribution is becoming easier while the work behind a reliable storefront remains substantial. Adobe documents PWA Studio as a storefront toolset for Adobe Commerce and Magento Open Source. Salesforce pairs its PWA Kit with managed hosting and monitoring.
Apple widened distribution in September 2025 when Safari 26 allowed any site added to an iPhone or iPad Home Screen to open as a web app by default. That change expands the potential audience. FMI expects contracts to put more weight on testing and continuing support as basic installation becomes less distinctive. Ionic's February 2025 decision to end new commercial product sales also makes support continuity a concrete purchasing issue. Its open-source Framework and Capacitor remained supported. Buyers comparing the broader mobile application development platform market must therefore assess both the build and the support behind it.
Key Market Trends & Insights
- Implementation Services grows at a 12.6% CAGR in FMI's outlook and reaches 42.2% of component revenue by 2036. Its share passes Development Platforms and Tools as integration work captures a larger part of contract value.
- Reusable caching modules reduce repeated development work but leave key decisions with the delivery team. Google provides Workbox modules for routing, caching and update handling, while fresh prices and cached pages remain application decisions.
- Desktop distribution is now available alongside mobile delivery. Microsoft's documentation describes installation through browsers and the Microsoft Store, and device capabilities differ by route.
Regional Highlights
- Share of global revenue grows for India, China and Brazil. FMI projects India rising from 10.0% to 13.4%, China rising from 6.0% to 6.7% and Brazil rising from 3.0% to 3.4% by 2036.
- Global share declines for the United States, Germany and Japan even as revenue grows. FMI's 2036 shares are the United States 31.0% (from 33.0%), Germany 5.1% (from 6.0%) and Japan 4.3% (from 5.0%).
Analyst Perspective
“The next purchasing test concerns who owns a failed transaction after a browser update. Installation features are becoming widely available. Merchants still pay for dependable baskets, current stock information and releases that do not interrupt trading. Suppliers with a clear division of responsibility between storefront code and hosted services have a stronger renewal proposition than a provider selling installation alone.”
- Sudip saha, Principal Consultant, FMI
How is the Progressive Web Apps Market segmented?
- By component: Development Platforms and Tools, Implementation Services, and Maintenance and Support.
- By end use: Retail and E-commerce, Media and Publishing, Banking and Financial Services, Travel and Hospitality, Healthcare, and Other.
- By enterprise size: Large Enterprises, Mid-sized Businesses, and Small Businesses.
- By region: North America, Latin America, Western Europe, East Asia, South Asia and Pacific, and Rest of world.
Why does the Development Platforms and Tools segment lead by Component in the Progressive Web Apps Market in 2026?
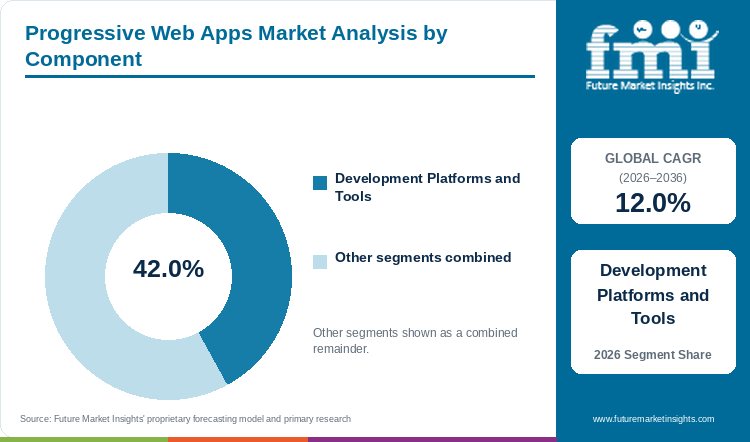
The Development Platforms and Tools segment holds 42.0% of the Progressive Web Apps Market by component in 2026.
Platform spending starts before a storefront can generate a transaction. The merchant selects the framework and the supporting delivery environment while establishing how the frontend connects to commerce functions. PWA Studio supplies build tools and storefront libraries for a defined backend family. That positioning makes backend compatibility part of the initial product choice.
The tools category also contains offers with very different sources of revenue. Google's Workbox simplifies service-worker development without providing the full operating commitment of an enterprise commerce contract. A comparison of company names therefore overstates the similarity of competing offers. Some suppliers shape the technical foundation while others sell the work needed to make that foundation suitable for a customer.
FMI forecasts Development Platforms and Tools revenue rising from USD 957.6 million in 2026 to USD 2,745.4 million in 2036. Its 11.1% CAGR remains substantial even as its share declines. Implementation Services grows faster because a reusable starting point leaves authentication and merchandising decisions to be built. Platform vendors retain influence when agencies and merchants continue building around their interfaces. Their commercial strength needs to be assessed alongside the support and implementation partners responsible for the live application.
Implementation Services and Maintenance and Support together hold the remaining 58.0% by component.
Table 2: Component, 2026 Share
| Leading Share | 2026 market share |
|---|---|
| Development Platforms and Tools | 42.0% |
| All Other Segments Combined Share | 58.0% |
Source: Future Market Insights analysis of the progressive web apps market, 2026.
Why does the Retail and E-commerce segment lead by End Use in the Progressive Web Apps Market in 2026?
The Retail and E-commerce segment holds 34.0% of the Progressive Web Apps Market by end use in 2026.
Retail purchases concentrate spending because the browser interface sits directly on the path from product discovery to payment. Retailers have a visible commercial reason to investigate slow pages or failed basket updates. The U.S. Census Bureau recorded USD 300.2 billion of seasonally adjusted retail e-commerce sales in the first quarter of 2025, the transaction base against which merchants evaluate frontend work.
Salesforce's managed environment is specifically designed to deploy and monitor PWA Kit storefronts. Its role differs from a general site conversion utility. Large merchants often need a staged transition because catalog and customer services continue operating during a frontend change. FMI expects that migration work to help sustain the category's spending lead.
Retail and E-commerce revenue reaches USD 2,421.4 million in 2036 from USD 775.2 million in 2026. The broader e-commerce platform market is closely related. Other end uses remain important. Healthcare records the higher 14.1% forecast CAGR but begins from a smaller 9.0% share in 2026.
Media and Publishing, Banking and Financial Services, Travel and Hospitality, Healthcare and Other together account for the remaining 66.0% by end use.
Table 3: End Use, 2026 Share
| Leading Share | 2026 market share |
|---|---|
| Retail and E-commerce | 34.0% |
| All Other Segments Combined Share | 66.0% |
Source: Future Market Insights analysis of the progressive web apps market, 2026.
Why does the Large Enterprises segment lead by Enterprise Size in the Progressive Web Apps Market in 2026?
The Large Enterprises segment holds 52.0% of the Progressive Web Apps Market by enterprise size in 2026.
Large customers bring more systems and more release dependencies into a frontend project. A business operating several brands must decide which code can be shared and where prices or content differ. Alokai documents multistore support and a common data layer among its storefront capabilities. Those features address a different commercial problem from adding an installation button to a single site.
The 52.0% share measures spending. A complex contract can carry more value than many small conversions. Large buyers also have existing content operations. Coordination with the web content management market matters when a storefront release must preserve publishing workflows and campaign timing.
FMI forecasts Large Enterprises revenue at USD 3,333.6 million by 2036. Its 10.9% CAGR is below the 12.4% projected for Mid-sized Businesses and 13.9% for Small Businesses. The spending mix consequently broadens over time. Smaller buyers gain access through more limited offers such as Progressier's installation and notification toolkit or Appy Pie's website conversion service. Their relevance is that different application needs can support different contract sizes. Suppliers need a delivery model that matches the buyer's operating complexity.
Mid-sized Businesses and Small Businesses together hold the remaining 48.0% by enterprise size.
Table 4: Enterprise Size, 2026 Share
| Leading Share | 2026 market share |
|---|---|
| Large Enterprises | 52.0% |
| All Other Segments Combined Share | 48.0% |
Source: Future Market Insights analysis of the progressive web apps market, 2026.
What are the key drivers restraints and opportunities?
Easier browser distribution supports adoption. Cross-browser behavior and continuing service responsibilities constrain delivery. Commerce integration and managed maintenance create a larger revenue opportunity than installation alone.
Driver
Merchants can distribute an application through a web address and offer installation on supporting devices. The commercial incentive is strongest where the same trading service must reach desktop and mobile users.
Restraint
Browser capabilities and application behavior need separate testing.
Opportunity
Implementation and support providers can take responsibility for recurring release work and backend integration. FMI forecasts their combined component share increasing from 58.0% in 2026 to 61.2% in 2036.
How do purchasing rules and qualification affect progressive web apps market demand?
The expansion of browser distribution lowers an entry barrier without removing the need for paid delivery work. Safari 26's September 2025 change gives users a more consistent route to opening a Home Screen site as an application. A merchant still needs to decide how the application behaves when its customer account service cannot be reached. FMI expects initial adoption to be strongest where merchants already own a useful web service and want to improve how customers return to it.
Reusable storefront components can bring more projects within reach. Shopify's Hydrogen separates the choice of a starter storefront from adding its commerce tools to an existing project. Some customers commission a new interface. Others add capability to a service they already operate.
What limits reliable progressive web apps market supply and quality?
Support arrangements can change during the life of an application. Ionic stopped taking new commercial customers in February 2025 while confirming that Framework and Capacitor would continue as maintained open-source projects. Procurement teams therefore need to distinguish the availability of code from the availability of paid assistance. FMI expects continuity planning to affect renewal decisions where the application depends on a vendor's managed feature.
Caching also creates commercial risks that are specific to the transaction. Static imagery can remain useful after a network interruption. An old price or stock response requires different treatment. Workbox offers routing and cache-management modules instead of a universal merchandising policy. The supplier's value lies in choosing and verifying the appropriate behavior. A weak implementation can transfer apparent frontend savings into customer-service work or failed orders.
Where can suppliers win additional business in the progressive web apps market?
The clearest opening is a defined operating service with measurable responsibility for releases. Managed Runtime provides deployment and monitoring infrastructure for PWA Kit applications. Buyers can assess the division between that hosted environment and the agency maintaining storefront code. A contract with an explicit boundary is easier to evaluate than an undifferentiated promise of an app-like experience.
Smaller buyers create a second opportunity around limited, repeatable features. Progressier lists installation pages and push notifications among its tools. Appy Pie offers website-to-PWA conversion alongside an Android route. These offers broaden the addressable budget range. Revenue growth will depend on whether customers retain the service after installation and continue receiving a useful operational benefit. Teams that assemble such features with visual builders overlap with the low-code development platform market.
Progressive Web Apps Market by Country (2026 to 2036)
Table 5: Progressive Web Apps Market Country Growth Forecast
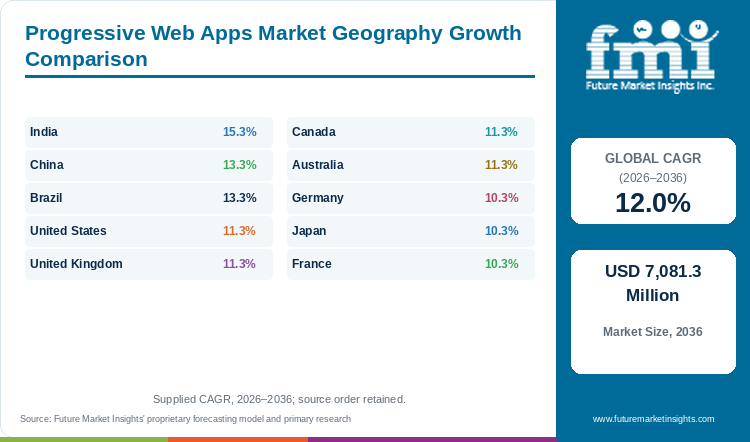
| Country | CAGR, 2026 to 2036 |
|---|---|
| India | 15.3% |
| China | 13.3% |
| Brazil | 13.3% |
| United States | 11.3% |
| United Kingdom | 11.3% |
| Canada | 11.3% |
| Australia | 11.3% |
| Germany | 10.3% |
| Japan | 10.3% |
| France | 10.3% |
Source: Future Market Insights analysis of the progressive web apps market, 2026.
India
India's payment activity provides a concrete test for frontend integration. NPCI's October 2026 statistics recorded 25,466.7 million UPI transactions. It indicates why a merchant's browser application must work with payment flows that customers already recognize. An installation feature has little commercial value if the handoff to payment or the return to order confirmation fails.
FMI forecasts India's progressive web apps revenue growing at 15.3% annually from 2026 to 2036. Revenue rises from USD 228.0 million to USD 947.4 million. This is the fastest rate among the ten named countries. The forecast points to more than a replication of large enterprise storefront projects. Smaller merchants and service businesses can also enter through limited application offers while retaining their existing web presence. India adds USD 719.4 million, ranking second for increase. India's slice of global revenue goes from 10.0% to 13.4%.
India also has direct historical evidence of the commercial purpose of this architecture. The Flipkart Lite case study describes a reversal of the retailer's 2015 app-only approach. It reported lower data use than the native application and a 70.0% higher conversion rate among visitors arriving through the Home Screen route. Their relevance is the decision to serve customers through the browser even when a native application exists. Implementation providers still need to connect that access route to payment confirmation and order recovery.
China
China offers a large web-commerce setting but that scale must be interpreted carefully. The National Bureau of Statistics put 2025 online retail sales at CNY 15,972.2 billion in its January 2026 release. Online sales of physical goods accounted for 26.1% of total consumer-goods retail sales. These figures include commerce through channels that are not PWAs. FMI therefore treats them as evidence of commercial transaction activity and not as a direct count of addressable application projects.
The progressive web apps market in China is forecast at a 13.3% CAGR over 2026 to 2036. Revenue grows from USD 136.8 million to USD 477.0 million. The rate places China above the global outlook while its 2026 share remains 6.0%. That leaves China with 6.7% of global revenue in 2036, against 6.0% in 2026.
A supplier's proposition must fit the particular customer journey. A retailer with a useful owned website faces a different choice from one whose transactions mainly occur through another platform. An installable browser frontend is commercially relevant when the merchant can bring customers back to that owned service and maintain its transaction systems. FMI expects implementation providers to benefit from precise project boundaries. They should establish which catalog, account and payment functions remain in existing systems before promising a uniform app experience. That discipline also prevents a broad online-sales indicator from becoming an unsupported forecast of PWA penetration.
Brazil
Brazil's payment infrastructure makes completion of the transaction a central frontend issue. The Finance Ministry's August 2026 account of the central bank's Pix management report stated that Pix handled nearly 80.0 billion transactions in 2025. Its commercial implication for browser applications is the need to integrate payment confirmation into the merchant's actual order process.
FMI forecasts a 13.3% CAGR for Brazil's progressive web apps market from 2026 to 2036. Revenue reaches USD 238.5 million in 2036 from USD 68.4 million in 2026. The expansion is faster than the global 12.0% outlook. A wider group of businesses can commission browser applications as more reusable delivery options become available. The application still needs to serve a defined transaction or service journey. Brazil's revenue grows 3.5 times over the decade, against 3.1 times globally. Brazil's share of global revenue rises from 3.0% to 3.4%.
Suppliers can address that demand through different commercial packages. A simple website conversion may suit a business seeking a more accessible return-visit route. A retailer connecting payment and inventory services requires integration work and an ongoing support commitment. FMI expects buyers to place particular weight on order-state consistency. The merchant needs to know whether a payment succeeded even when a customer closes or reloads the application. Companies able to demonstrate that complete journey have a stronger basis for recurring local contracts.
United States
The United States begins with the largest revenue base. FMI assigns the country USD 752.4 million in 2026 and projects USD 2,194.4 million by 2036. Its 11.3% CAGR over 2026 to 2036 reflects spending on established commercial applications as well as new projects. The Census Bureau's first-quarter 2025 release placed seasonally adjusted retail e-commerce sales at USD 300.2 billion. The scale of online trade gives merchants a financial reason to scrutinize browser checkout performance. Its 11.3% CAGR runs 0.7 percentage points below the 12.0% global rate. The United States ranks first by 2026 revenue.
A commercial application serving an existing customer base must preserve product discovery and account access during migration. For U.S. suppliers, the revenue proposition consequently extends into controlled releases and integration support. The platform documentation describes browser distribution together with the option to submit a PWA to an app-store listing. That adds a desktop channel to the delivery discussion while leaving device compatibility dependent on the chosen capabilities.
FMI sees the country's large enterprise segment as an anchor for recurring work. Buyers comparing a storefront platform with a specialist implementation agency need to determine which organization owns changes to the live service. A cheaper frontend build carries limited value if routine commerce changes repeatedly require a separate project. Support renewals and clear operating responsibilities are therefore central to the national revenue outlook.
United Kingdom
Great Britain's online retail channel is already substantial. ONS reported an online share of 28.8% in August 2026 and online spending growth of 10.1% in the three months to August compared with a year earlier. The series covers Great Britain instead of the whole United Kingdom. Its relevance to PWA suppliers is the value of trading already passing through browser storefronts. A merchant can consider frontend work as a way to protect an established channel instead of start a new one.
The United Kingdom market is forecast to advance at an 11.3% CAGR between 2026 and 2036. FMI projects revenue of USD 159.6 million in 2026 and USD 465.5 million in 2036. This outlook supports both storefront projects and the maintenance needed after launch. Commercial buyers need confidence that a campaign or product-catalog change will not disturb a familiar checkout route. The United Kingdom records a USD 305.9 million increase, fourth of the ten.
George.com provides a historical example of incremental replacement. A February 2018 case study reported that the clothing retailer deployed its PWA in stages and recorded a 31.0% increase in mobile conversion. The useful commercial lesson is that a merchant can test the value of frontend changes before completing a wider rollout. FMI expects migration sequencing to remain relevant where an established online channel cannot pause trading. Publishing and booking services create additional demand beyond retail.
Canada
Canadian merchants have a visible online transaction base to maintain. Statistics Canada reported seasonally adjusted retail e-commerce sales of CAD 5.1 billion in March 2026. They accounted for 7.1% of total retail trade in that release. The series measures sales instead of software purchases. It provides a useful starting point for assessing why retailers allocate spending to the browser service through which a customer reaches checkout.
FMI forecasts Canada's progressive web apps market to expand at an 11.3% CAGR from 2026 to 2036. Revenue advances from USD 91.2 million to USD 266.0 million. The outlook includes work for businesses that already have a functioning web storefront and need a better return-visit experience. It also includes smaller application projects whose scope is limited to particular browser capabilities.
Shopify's Hydrogen documentation describes a choice between deploying a storefront starting point and adding its tools to an existing project. A supplier can preserve parts of the merchant's service while addressing a defined frontend need. FMI expects proposal quality to depend on identifying what stays with the commerce platform and what the implementation provider must support. Buyers also need clarity over continuing hosting and release charges. An application with manageable operating work can remain useful after the launch campaign ends. The national forecast is consequently linked to retained commercial service instead of the number of installation prompts displayed.
Australia
Australian online retailing was growing when the ABS ended its Retail Trade series. The final June 2025 release recorded seasonally adjusted online sales of AUD 4,703.8 million. They were 13.0% above June 2024. The ABS then transitioned household-spending reporting to a different publication. It supports the commercial relevance of maintaining browser transactions without implying a particular software architecture.
The progressive web apps market in Australia is projected at an 11.3% CAGR between 2026 and 2036. FMI expects revenue to increase from USD 68.4 million to USD 199.5 million. For a smaller national revenue base, a range of contract sizes matters. A merchant may want an installation feature for an existing site while another requires a commerce frontend with continuing operational support. Global revenue share for Australia decreases from 3.0% to 2.8%.
The commercial assessment should distinguish those requirements before comparing prices. One service provider offers installation and notification functions that can complement an application. FMI expects this distinction to protect buyers from overestimating what a lightweight service includes. Larger projects need explicit treatment of release responsibility and browser testing. Smaller projects need a bounded purpose that remains valuable after initial conversion. Providers that can serve both groups through clearly separated offers have a wider route to Australian demand than those relying on a single full-rebuild proposal.
Germany
Germany's opportunity starts with a broad population of experienced online buyers. Destatis reported in November 2024 that roughly 83.0% of people aged 16 to 74 had bought or ordered something online at least once. It nevertheless establishes that basic familiarity with web purchasing is not the principal problem a new commercial interface must solve.
FMI projects a 10.3% CAGR for Germany's progressive web apps market from 2026 to 2036. Revenue increases from USD 136.8 million to USD 364.5 million. The forecast is consistent with a market where replacement quality matters as much as first adoption. Customers who already understand browser shopping need a clear reason to accept a new interaction. Poor account recovery or a confusing payment transition can undermine the value of the installable interface. Germany's 10.3% CAGR sits 1.7 points below the global 12.0%.
For suppliers, the commercial task is to document how a new frontend fits the merchant's existing operating process. Commerce software selection also affects the available starting point. PWA Studio is designed for a defined set of commerce platforms, making backend alignment relevant before a project is priced. FMI expects buyers to compare compatibility and continuing release effort alongside the visible design. A smaller initial scope can be useful when it lets a merchant verify behavior before replacing more of the service. The national outlook rewards dependable modernization instead of installation volume alone.
Japan
Japan's existing commerce systems shape the cost of changing its customer interface. METI's survey released in August 2025 placed domestic B2C electronic commerce at JPY 26.1 trillion in 2024. Growth was 5.1% from the previous year. It shows why integration with an established merchant operation is more commercially relevant than merely adding another browser channel.
FMI forecasts Japanese progressive web apps revenue at USD 114.0 million in 2026 and USD 303.7 million by 2036. The 2026 to 2036 CAGR is 10.3%. The national market includes buyers whose requirement is a controlled renewal of services that already generate transactions. Japan records a USD 189.7 million increase, sixth of the ten. Japan holds 5.0% of the world total in 2026 and 4.3% in 2036. From 2026 to 2036, revenue in Japan rises 2.7 times and global revenue 3.1 times.
Publishing provides a distinctly Japanese example beyond the retail channel. Nikkei launched its multi-page PWA in November 2017. Another case study reported a 58.0% increase in subscription conversions and described five frontend engineers working for a year on the improvement. They demonstrate that PWA work can involve a substantial renewal of an established publishing service. FMI expects Japan's opportunity to include applications where reading continuity and paid account access carry commercial value. This broadens demand beyond storefront kits while preserving the need for a carefully defined implementation scope.
France
France's distance-selling growth offers a measured commercial context. INSEE reported that distance-selling volumes increased by 2.2% in 2025. Its June 2026 assessment also placed distance selling at 8.3% of retail sales excluding automobiles, parts and repairs. That category is not identical to every measure of e-commerce. For PWA providers, the relevant point is that remote trading continues alongside physical stores and must fit the retailer's broader operating model.
France's progressive web apps market is projected to grow from USD 91.2 million in 2026 to USD 243.0 million in 2036. FMI's forecast CAGR is 10.3% across 2026 to 2036. The opportunity includes frontend modernization where a merchant wants to keep the current commerce backend. That arrangement can preserve existing investment while changing the customer-facing application.
Product availability and order status still need to remain consistent with the service processing the transaction. Alokai documents a data-normalization approach for storefronts connected to different commerce backends. Its role illustrates the integration work involved without demonstrating a national adoption share. FMI expects agencies to compete on the scope of migration and the continuing effort required from a merchant's team. A proposal that explains how publishing and merchandising changes will be handled is more useful than an unsupported promise of instant app conversion. The national forecast consequently includes both new application work and support for existing commercial services.
Who are the notable companies in the Progressive Web Apps Market?
Notable companies in the Progressive Web Apps Market include Google, Microsoft, Adobe, Salesforce and Shopify.
Google and Microsoft influence the delivery foundation through browser-related tooling and distribution. Adobe and Salesforce offer commerce-specific storefront technologies. Their relevance should be assessed through the products used in a project instead of their overall corporate revenue. Adobe PWA Studio is tied to Adobe Commerce and Magento Open Source. Salesforce Managed Runtime hosts PWA Kit storefronts.
Shopify and BigCommerce are commerce platforms with headless storefront tooling. Hydrogen and Catalyst provide starting points for application work but a headless storefront does not by itself prove offline behavior. BigCommerce remains a product brand under Commerce.com following the parent's 2025 name change. Alokai addresses frontend integration across commerce systems. Progressier and Appy Pie serve more bounded installation and conversion needs.
Ionic requires particular care in competitive comparisons. Its Framework and Capacitor remain maintained open-source projects. The company ended new sales of its commercial products in February 2025. FMI therefore includes Ionic as a relevant framework participant while avoiding the assumption that its former commercial services are available to a new buyer on the old basis.
Browser foundations and distribution: Google and Microsoft.
Commerce storefront platforms and integration: Adobe, Salesforce, Shopify, BigCommerce and Alokai.
Frameworks and focused application tools: Ionic, Appy Pie and Progressier.
Key Developments in the Progressive Web Apps Market
- On 3 June 2026, Google announced PWA Origin Migration in Chrome 150. The feature lets an installed web app move to a new same-site origin without users uninstalling and reinstalling it.
- On 7 July 2026, Microsoft reported the same same-site origin migration for installed PWAs in Edge. Both releases lower the cost of rebranding or restructuring a PWA after launch.
Key Players in the Progressive Web Apps Market
- Microsoft
- Adobe
- Salesforce
- Shopify
- BigCommerce
- Ionic
- Appy Pie
- Progressier
- Alokai
Progressive Web Apps Market Report Scope
Table 6: Progressive Web Apps Market Report Scope
| Coverage field | Report scope |
|---|---|
| Market definition | Business spending on web applications designed for browser installation and offline operation, including development platforms, frameworks, storefront kits and implementation services |
| Boundary | Application tools and services within the stated scope, excluding the gross value of retail transactions and general corporate software revenue |
| Quantitative Units | USD million |
| Component coverage | Development Platforms and Tools, Implementation Services, Maintenance and Support |
| End-use and buyer coverage | Six end-use categories and Large Enterprises, Mid-sized Businesses and Small Businesses |
| Country coverage | United States, India, United Kingdom, Germany, China, Japan, France, Canada, Australia and Brazil |
| Competitive coverage | Google, Microsoft, Adobe, Salesforce, Shopify, BigCommerce, Ionic, Appy Pie, Progressier and Alokai |
| Regions covered | North America, Latin America, Western Europe, East Asia, South Asia and Pacific and Rest of world aggregate |
Source: Future Market Insights analysis of the progressive web apps market, 2026.
Progressive Web Apps Market Research Methodology
The progressive web apps assessment combines FMI's numerical outlook with secondary review of original browser and vendor documentation. National statistical and payment publications supply commercial context. Analysis distinguishes application spending from retail sales and payment activity. Consistency checks cover forecast periods, segment allocations and the application volume basis. Competitive discussion reflects documented product roles and material service changes without attributing general corporate revenue to the PWA market.
Progressive Web Apps Market by Segments
Progressive Web Apps Market segmented by Component:
- Development Platforms and Tools
- Implementation Services
- Maintenance and Support
Progressive Web Apps Market segmented by End Use:
- Retail and E-commerce
- Media and Publishing
- Banking and Financial Services
- Travel and Hospitality
- Healthcare
- Other
Progressive Web Apps Market segmented by Enterprise Size:
- Large Enterprises
- Mid-sized Businesses
- Small Businesses
Progressive Web Apps Market by Region
- North America
- United States
- Canada
- Latin America
- Brazil
- Western Europe
- United Kingdom
- Germany
- France
- East Asia
- China
- Japan
- South Asia and Pacific
- India
- Australia
- Rest of world aggregate
Research Sources and Bibliography
- Adobe. PWA Studio. Accessed 9 November 2026. https://developer.adobe.com/commerce/pwa-studio/
- Alokai. Alokai Storefront. Accessed 9 November 2026. https://docs.alokai.com/storefront
- Appy Pie. PWA Builder: Convert Website to PWA for iOS and Android. Accessed 9 November 2026. https://www.appypie.com/convert-website-to-pwa-builder/
- Australian Bureau of Statistics. (2025, July 31). Retail Trade, Australia, June 2025. https://www.abs.gov.au/statistics/industry/retail-and-wholesale-trade/retail-trade-australia/jun-2025
- BigCommerce. Catalyst. Developer documentation. Accessed 9 November 2026. https://docs.bigcommerce.com/developer/docs/storefront/catalyst/overview
- Commerce.com. (2025, July 31). Introducing Commerce, the New Parent Brand of BigCommerce, Feedonomics and Makeswift, Powering an AI-Driven Future. https://investors.bigcommerce.com/news-releases/news-release-details/introducing-commerce-new-parent-brand-bigcommerce-feedonomics/
- Destatis. (2024, November 28). 83 Prozent der 16- bis 74-Jahrigen kaufen online ein. Press release 446. https://www.destatis.de/DE/Presse/Pressemitteilungen/2024/11/PD24_446_63.html
- Google Chrome for Developers. What is Workbox? Accessed 9 November 2026. https://developer.chrome.com/docs/workbox/what-is-workbox
- Google Chrome for Developers. (2026, June 3). Seamless PWA origin migration: Change domains without losing users. https://developer.chrome.com/blog/seamless-pwa-origin-migration
- Google web.dev. Flipkart triples time-on-site with Progressive Web App. Historical case study concerning the 2015 Flipkart Lite project. Accessed 9 November 2026. https://web.dev/case-studies/flipkart
- Google web.dev. (2018, February 23). George.com enhances the mobile customer experience with new Progressive Web App. https://web.dev/case-studies/asda-george
- Google web.dev. Nikkei achieves a new level of quality and performance with their multi-page PWA. Historical case study concerning the November 2017 launch. Accessed 9 November 2026. https://web.dev/case-studies/nikkei
- INSEE. (2026, June 18). Le compte du commerce en 2025. INSEE Premiere 2111. https://www.insee.fr/fr/statistiques/9008999
- Ionic. (2025, February 11). Important Announcement: The Future of Ionic's Commercial Products. https://ionic.io/blog/important-announcement-the-future-of-ionics-commercial-products
- Microsoft Edge Blog. (2026, July 7). New in Edge for developers: Style layout gaps, improve keyboard accessibility and migrate your PWA to a new origin. https://blogs.windows.com/msedgedev/2026/07/07/new-in-edge-for-developers-style-layout-gaps-improve-keyboard-accessibility-and-migrate-your-pwa-to-a-new-origin/
- Microsoft Learn. Overview of Progressive Web Apps. Accessed 9 November 2026. https://learn.microsoft.com/en-us/microsoft-edge/progressive-web-apps/
- Ministry of Economy, Trade and Industry, Japan. (2025, August 26). Results of FY2024 E-Commerce Market Survey Compiled. https://www.meti.go.jp/english/press/2025/0826_003.html
- Ministry of Finance, Brazil. (2026, August 19). Pix consolida lideranca nos pagamentos digitais e projeta novas evolucoes ate 2030. https://www.gov.br/fazenda/pt-br/composicao/orgaos/orgaos-colegiados/crsfn/acesso-a-informacao/noticias/2026/pix-consolida-lideranca-nos-pagamentos-digitais-e-projeta-novas-evolucoes-ate-2030
- National Bureau of Statistics of China. (2026, January 20). Total Retail Sales of Consumer Goods in December 2025. https://www.stats.gov.cn/english/PressRelease/202601/t20260120_1962354.html
- National Payments Corporation of India. UPI Product Statistics, October 2026. Accessed 9 November 2026. https://www.npci.org.in/product/upi/product-statistics
- Office for National Statistics. (2026, September 18). Retail sales, Great Britain: August 2026. https://www.ons.gov.uk/businessindustryandtrade/retailindustry/bulletins/retailsales/august2026
- Progressier. Progressier Features. Accessed 9 November 2026. https://progressier.com/features
- Salesforce Developers. Managed Runtime Overview. Accessed 9 November 2026. https://developer.salesforce.com/docs/commerce/b2c-commerce/guide/mrt-overview.html
- Shopify. Get started with Hydrogen. Accessed 9 November 2026. https://shopify.dev/docs/storefronts/hydrogen/getting-started
- Statistics Canada. (2026, May 22). Retail trade, March 2026. https://www150.statcan.gc.ca/n1/daily-quotidien/260522/dq260522a-eng.htm
- U.S. Census Bureau. (2025, May 19). Quarterly Retail E-Commerce Sales, First Quarter 2025. https://www2.census.gov/retail/releases/historical/ecomm/25q1.pdf
- WebKit. (2025, September 15). WebKit Features in Safari 26.0. https://webkit.org/blog/17333/webkit-features-in-safari-26-0/
This bibliography is provided for reader reference and is not exhaustive. The full report contains the complete reference list and detailed citations.
Table of Content
- Key Takeaways
- Market Size and CAGR
- Top Growth Driver
- Fastest Growing Segment
- Leading Region
- Key Companies
- Emerging Opportunities
- Executive Summary
- Global Market Outlook
- Demand-side Trends
- Supply-side Trends
- Technology Roadmap Analysis
- Analysis and Recommendations
- Analyst Perspective (What is happening? Why now? What should investors know?)
- Key Questions Answered
- How large is the market?
- What is the CAGR?
- What are key trends?
- Which region dominates?
- Who are the leaders?
Read More...
- Market Overview
- Market Coverage / Taxonomy
- Market Definition / Scope / Limitations
- Research Methodology
- Chapter Orientation
- Analytical Lens and Working Hypotheses
- Market Structure, Signals, and Trend Drivers
- Benchmarking and Cross-market Comparability
- Market Sizing, Forecasting, and Opportunity Mapping
- Research Design and Evidence Framework
- Desk Research Programme (Secondary Evidence)
- Expert Input and Fieldwork (Primary Evidence)
- Tooling, Models, and Reference Databases
- Data Engineering and Model Build
- Quality Assurance and Audit Trail
- Market Background
- Market Dynamics (Drivers, Restraints, Opportunity, Trends)
- Scenario Forecast (Optimistic, Likely, Conservative)
- Impact Analysis
- AI Impact
- Sustainability Impact
- Regulatory Impact
- Technology Impact
- Consumer / Buyer Analysis
- Purchase Drivers
- Adoption Barriers
- Buyer Journey
- Opportunity Map Analysis
- Product Life Cycle Analysis
- Supply Chain Analysis
- Investment Feasibility Matrix
- Value Chain Analysis
- PESTLE and Porter's Analysis
- Regulatory Landscape
- Regional Parent Market Outlook
- Production and Consumption Statistics
- Import and Export Statistics
- Global Market Analysis and Forecast, 2021 to 2036
- Historical Market Size Value (USD Million) Analysis, 2021 to 2025
- Current and Future Market Size Value (USD Million) Projections, 2026 to 2036
- Y-o-Y Growth Trend Analysis
- Absolute $ Opportunity Analysis
- Global Market Pricing Analysis, 2021 to 2036
- Global Market Analysis and Forecast, By Component, 2021 to 2036
- Introduction / Key Findings
- Historical Market Size Value (USD Million) Analysis By Component, 2021 to 2025
- Current and Future Market Size Value (USD Million) Analysis and Forecast By Component, 2026 to 2036
- Development Platforms and Tools
- Implementation Services
- Maintenance and Support
- Y-o-Y Growth Trend Analysis By Component, 2021 to 2025
- Absolute $ Opportunity Analysis By Component, 2026 to 2036
- Global Market Analysis and Forecast, By End Use, 2021 to 2036
- Introduction / Key Findings
- Historical Market Size Value (USD Million) Analysis By End Use, 2021 to 2025
- Current and Future Market Size Value (USD Million) Analysis and Forecast By End Use, 2026 to 2036
- Retail and E-commerce
- Media and Publishing
- Banking and Financial Services
- Travel and Hospitality
- Healthcare
- Other
- Y-o-Y Growth Trend Analysis By End Use, 2021 to 2025
- Absolute $ Opportunity Analysis By End Use, 2026 to 2036
- Global Market Analysis and Forecast, By Enterprise Size, 2021 to 2036
- Introduction / Key Findings
- Historical Market Size Value (USD Million) Analysis By Enterprise Size, 2021 to 2025
- Current and Future Market Size Value (USD Million) Analysis and Forecast By Enterprise Size, 2026 to 2036
- Large Enterprises
- Mid-sized Businesses
- Small Businesses
- Y-o-Y Growth Trend Analysis By Enterprise Size, 2021 to 2025
- Absolute $ Opportunity Analysis By Enterprise Size, 2026 to 2036
- Global Market Analysis and Forecast, By Region, 2021 to 2036
- Introduction
- Historical Market Size Value (USD Million) Analysis By Region, 2021 to 2025
- Current Market Size Value (USD Million) Analysis and Forecast By Region, 2026 to 2036
- North America
- Latin America
- Western Europe
- East Asia
- South Asia and Pacific
- Market Attractiveness Analysis By Region
- North America Market Analysis and Forecast, By Country, 2021 to 2036
- Historical Market Size Value (USD Million) Trend Analysis By Market Taxonomy, 2021 to 2025
- Market Size Value (USD Million) Forecast By Market Taxonomy, 2026 to 2036
- By Country
- United States
- Canada
- By Component
- By End Use
- By Enterprise Size
- By Country
- Market Attractiveness Analysis
- By Country
- By Component
- By End Use
- By Enterprise Size
- Key Takeaways
- Latin America Market Analysis and Forecast, By Country
- Historical Market Size Value (USD Million) Trend Analysis By Market Taxonomy, 2021 to 2025
- Market Size Value (USD Million) Forecast By Market Taxonomy, 2026 to 2036
- By Country
- Brazil
- By Component
- By End Use
- By Enterprise Size
- By Country
- Market Attractiveness Analysis
- By Country
- By Component
- By End Use
- By Enterprise Size
- Key Takeaways
- Western Europe Market Analysis and Forecast, By Country
- Historical Market Size Value (USD Million) Trend Analysis By Market Taxonomy, 2021 to 2025
- Market Size Value (USD Million) Forecast By Market Taxonomy, 2026 to 2036
- By Country
- United Kingdom
- Germany
- France
- By Component
- By End Use
- By Enterprise Size
- By Country
- Market Attractiveness Analysis
- By Country
- By Component
- By End Use
- By Enterprise Size
- Key Takeaways
- East Asia Market Analysis and Forecast, By Country
- Historical Market Size Value (USD Million) Trend Analysis By Market Taxonomy, 2021 to 2025
- Market Size Value (USD Million) Forecast By Market Taxonomy, 2026 to 2036
- By Country
- China
- Japan
- By Component
- By End Use
- By Enterprise Size
- By Country
- Market Attractiveness Analysis
- By Country
- By Component
- By End Use
- By Enterprise Size
- Key Takeaways
- South Asia and Pacific Market Analysis and Forecast, By Country
- Historical Market Size Value (USD Million) Trend Analysis By Market Taxonomy, 2021 to 2025
- Market Size Value (USD Million) Forecast By Market Taxonomy, 2026 to 2036
- By Country
- India
- Australia
- Rest of world aggregate
- By Component
- By End Use
- By Enterprise Size
- By Country
- Market Attractiveness Analysis
- By Country
- By Component
- By End Use
- By Enterprise Size
- Key Takeaways
- Key Countries Market Analysis
- United States
- Pricing Analysis
- Market Share Analysis, 2025
- By Component
- By End Use
- By Enterprise Size
- Canada
- Pricing Analysis
- Market Share Analysis, 2025
- By Component
- By End Use
- By Enterprise Size
- Brazil
- Pricing Analysis
- Market Share Analysis, 2025
- By Component
- By End Use
- By Enterprise Size
- Germany
- Pricing Analysis
- Market Share Analysis, 2025
- By Component
- By End Use
- By Enterprise Size
- United Kingdom
- Pricing Analysis
- Market Share Analysis, 2025
- By Component
- By End Use
- By Enterprise Size
- France
- Pricing Analysis
- Market Share Analysis, 2025
- By Component
- By End Use
- By Enterprise Size
- India
- Pricing Analysis
- Market Share Analysis, 2025
- By Component
- By End Use
- By Enterprise Size
- China
- Pricing Analysis
- Market Share Analysis, 2025
- By Component
- By End Use
- By Enterprise Size
- Japan
- Pricing Analysis
- Market Share Analysis, 2025
- By Component
- By End Use
- By Enterprise Size
- Australia
- Pricing Analysis
- Market Share Analysis, 2025
- By Component
- By End Use
- By Enterprise Size
- United States
- Market Structure Analysis
- Competition Dashboard
- Competition Benchmarking
- Market Share Analysis of Top Players
- By Regional
- By Component
- By End Use
- By Enterprise Size
- Emerging Startups
- Innovation Benchmarking
- Competition Analysis
- Competition Deep Dive
- Google
- Overview
- Product Portfolio
- Profitability by Market Segments
- Sales Footprint
- Strategy Overview
- Marketing Strategy
- Product Strategy
- Channel Strategy
- Microsoft
- Adobe
- Salesforce
- Shopify
- BigCommerce
- Ionic
- Appy Pie
- Progressier
- Alokai
- Google
- Case Studies
- Success Stories
- Recent Developments
- Competition Deep Dive
- Assumptions & Acronyms Used
List of Tables
- Table 1: Global Market Value (USD Million) Forecast by Region, 2021 to 2036
- Table 2: Global Market Value (USD Million) Forecast by Component, 2021 to 2036
- Table 3: Global Market Value (USD Million) Forecast by End Use, 2021 to 2036
- Table 4: Global Market Value (USD Million) Forecast by Enterprise Size, 2021 to 2036
- Table 5: North America Market Value (USD Million) Forecast by Country, 2021 to 2036
- Table 6: North America Market Value (USD Million) Forecast by Component, 2021 to 2036
- Table 7: North America Market Value (USD Million) Forecast by End Use, 2021 to 2036
- Table 8: North America Market Value (USD Million) Forecast by Enterprise Size, 2021 to 2036
- Table 9: Latin America Market Value (USD Million) Forecast by Country, 2021 to 2036
- Table 10: Latin America Market Value (USD Million) Forecast by Component, 2021 to 2036
- Table 11: Latin America Market Value (USD Million) Forecast by End Use, 2021 to 2036
- Table 12: Latin America Market Value (USD Million) Forecast by Enterprise Size, 2021 to 2036
- Table 13: Western Europe Market Value (USD Million) Forecast by Country, 2021 to 2036
- Table 14: Western Europe Market Value (USD Million) Forecast by Component, 2021 to 2036
- Table 15: Western Europe Market Value (USD Million) Forecast by End Use, 2021 to 2036
- Table 16: Western Europe Market Value (USD Million) Forecast by Enterprise Size, 2021 to 2036
- Table 17: East Asia Market Value (USD Million) Forecast by Country, 2021 to 2036
- Table 18: East Asia Market Value (USD Million) Forecast by Component, 2021 to 2036
- Table 19: East Asia Market Value (USD Million) Forecast by End Use, 2021 to 2036
- Table 20: East Asia Market Value (USD Million) Forecast by Enterprise Size, 2021 to 2036
- Table 21: South Asia and Pacific Market Value (USD Million) Forecast by Country, 2021 to 2036
- Table 22: South Asia and Pacific Market Value (USD Million) Forecast by Component, 2021 to 2036
- Table 23: South Asia and Pacific Market Value (USD Million) Forecast by End Use, 2021 to 2036
- Table 24: South Asia and Pacific Market Value (USD Million) Forecast by Enterprise Size, 2021 to 2036
List of Figures
- Figure 1: Global Market Pricing Analysis
- Figure 2: Global Market Value (USD Million) Forecast 2021-2036
- Figure 3: Global Market Value Share and BPS Analysis by Component, 2026 and 2036
- Figure 4: Global Market Y-o-Y Growth Comparison by Component, 2026-2036
- Figure 5: Global Market Attractiveness Analysis by Component
- Figure 6: Global Market Value Share and BPS Analysis by End Use, 2026 and 2036
- Figure 7: Global Market Y-o-Y Growth Comparison by End Use, 2026-2036
- Figure 8: Global Market Attractiveness Analysis by End Use
- Figure 9: Global Market Value Share and BPS Analysis by Enterprise Size, 2026 and 2036
- Figure 10: Global Market Y-o-Y Growth Comparison by Enterprise Size, 2026-2036
- Figure 11: Global Market Attractiveness Analysis by Enterprise Size
- Figure 12: Global Market Value (USD Million) Share and BPS Analysis by Region, 2026 and 2036
- Figure 13: Global Market Y-o-Y Growth Comparison by Region, 2026-2036
- Figure 14: Global Market Attractiveness Analysis by Region
- Figure 15: North America Market Incremental Dollar Opportunity, 2026-2036
- Figure 16: Latin America Market Incremental Dollar Opportunity, 2026-2036
- Figure 17: Western Europe Market Incremental Dollar Opportunity, 2026-2036
- Figure 18: East Asia Market Incremental Dollar Opportunity, 2026-2036
- Figure 19: South Asia and Pacific Market Incremental Dollar Opportunity, 2026-2036
- Figure 20: North America Market Value Share and BPS Analysis by Country, 2026 and 2036
- Figure 21: North America Market Value Share and BPS Analysis by Component, 2026 and 2036
- Figure 22: North America Market Y-o-Y Growth Comparison by Component, 2026-2036
- Figure 23: North America Market Attractiveness Analysis by Component
- Figure 24: North America Market Value Share and BPS Analysis by End Use, 2026 and 2036
- Figure 25: North America Market Y-o-Y Growth Comparison by End Use, 2026-2036
- Figure 26: North America Market Attractiveness Analysis by End Use
- Figure 27: North America Market Value Share and BPS Analysis by Enterprise Size, 2026 and 2036
- Figure 28: North America Market Y-o-Y Growth Comparison by Enterprise Size, 2026-2036
- Figure 29: North America Market Attractiveness Analysis by Enterprise Size
- Figure 30: Latin America Market Value Share and BPS Analysis by Country, 2026 and 2036
- Figure 31: Latin America Market Value Share and BPS Analysis by Component, 2026 and 2036
- Figure 32: Latin America Market Y-o-Y Growth Comparison by Component, 2026-2036
- Figure 33: Latin America Market Attractiveness Analysis by Component
- Figure 34: Latin America Market Value Share and BPS Analysis by End Use, 2026 and 2036
- Figure 35: Latin America Market Y-o-Y Growth Comparison by End Use, 2026-2036
- Figure 36: Latin America Market Attractiveness Analysis by End Use
- Figure 37: Latin America Market Value Share and BPS Analysis by Enterprise Size, 2026 and 2036
- Figure 38: Latin America Market Y-o-Y Growth Comparison by Enterprise Size, 2026-2036
- Figure 39: Latin America Market Attractiveness Analysis by Enterprise Size
- Figure 40: Western Europe Market Value Share and BPS Analysis by Country, 2026 and 2036
- Figure 41: Western Europe Market Value Share and BPS Analysis by Component, 2026 and 2036
- Figure 42: Western Europe Market Y-o-Y Growth Comparison by Component, 2026-2036
- Figure 43: Western Europe Market Attractiveness Analysis by Component
- Figure 44: Western Europe Market Value Share and BPS Analysis by End Use, 2026 and 2036
- Figure 45: Western Europe Market Y-o-Y Growth Comparison by End Use, 2026-2036
- Figure 46: Western Europe Market Attractiveness Analysis by End Use
- Figure 47: Western Europe Market Value Share and BPS Analysis by Enterprise Size, 2026 and 2036
- Figure 48: Western Europe Market Y-o-Y Growth Comparison by Enterprise Size, 2026-2036
- Figure 49: Western Europe Market Attractiveness Analysis by Enterprise Size
- Figure 50: East Asia Market Value Share and BPS Analysis by Country, 2026 and 2036
- Figure 51: East Asia Market Value Share and BPS Analysis by Component, 2026 and 2036
- Figure 52: East Asia Market Y-o-Y Growth Comparison by Component, 2026-2036
- Figure 53: East Asia Market Attractiveness Analysis by Component
- Figure 54: East Asia Market Value Share and BPS Analysis by End Use, 2026 and 2036
- Figure 55: East Asia Market Y-o-Y Growth Comparison by End Use, 2026-2036
- Figure 56: East Asia Market Attractiveness Analysis by End Use
- Figure 57: East Asia Market Value Share and BPS Analysis by Enterprise Size, 2026 and 2036
- Figure 58: East Asia Market Y-o-Y Growth Comparison by Enterprise Size, 2026-2036
- Figure 59: East Asia Market Attractiveness Analysis by Enterprise Size
- Figure 60: South Asia and Pacific Market Value Share and BPS Analysis by Country, 2026 and 2036
- Figure 61: South Asia and Pacific Market Value Share and BPS Analysis by Component, 2026 and 2036
- Figure 62: South Asia and Pacific Market Y-o-Y Growth Comparison by Component, 2026-2036
- Figure 63: South Asia and Pacific Market Attractiveness Analysis by Component
- Figure 64: South Asia and Pacific Market Value Share and BPS Analysis by End Use, 2026 and 2036
- Figure 65: South Asia and Pacific Market Y-o-Y Growth Comparison by End Use, 2026-2036
- Figure 66: South Asia and Pacific Market Attractiveness Analysis by End Use
- Figure 67: South Asia and Pacific Market Value Share and BPS Analysis by Enterprise Size, 2026 and 2036
- Figure 68: South Asia and Pacific Market Y-o-Y Growth Comparison by Enterprise Size, 2026-2036
- Figure 69: South Asia and Pacific Market Attractiveness Analysis by Enterprise Size
- Figure 70: Global Market - Tier Structure Analysis
- Figure 71: Global Market - Company Share Analysis
Frequently Asked Questions
How big is the progressive web apps market in 2026?
FMI estimates the market at USD 2,280.0 million in 2026, up from USD 2,000.0 million in 2025. It is forecast to reach USD 7,081.3 million by 2036 at a 12.0% CAGR.
Which component leads the progressive web apps market in 2026?
Development Platforms and Tools leads by component with 42.0% in 2026. All other segments together hold 58.0%.
Which end use and enterprise size lead in 2026?
Retail and E-commerce holds 34.0% by end use and Large Enterprises holds 52.0% by enterprise size in FMI's 2026 assessment.
Which market is forecast to grow fastest through 2036?
India has the highest forecast CAGR at 15.3% during 2026 to 2036, followed by China and Brazil at 13.3%.
Does an installable or headless storefront automatically provide offline transactions?
No. Installation and storefront architecture do not establish how a transaction behaves without a network. Browser features and the application's caching and backend arrangements require separate assessment.[1][2][18]
Preview the report firsthand - request a free sample
Get SampleGet the brochure for pricing and purchase details.
Get PDF
