Reports

- Global Locations -

Headquarters

Future Market Insights, Inc.

Christiana Corporate, 200
Continental Drive, Suite 401,
Newark, Delaware - 19713,
United States

T: +1-845-579-5705

Americas

Future Market Insights, Inc.

616 Corporate Way, Suite 2-9018,
Valley Cottage, NY 10989, United States

T: +1-347-918-3531

MEA

Future Market Insights

1602-6 Jumeirah Bay X2 Tower, Plot No: JLT-PH2-X2A,
Jumeirah Lakes Towers, Dubai,
United Arab Emirates

Europe

Future Market Insights

3rd Floor, 207 Regent Street,
W1B 3HH London
United Kingdom

T: + 44 (0) 20 8123 9659
D: +44 (0) 20 3287 4268

Asia Pacific

Future Market Insights

IndiaLand Global Tech Park, Unit UG-1, Behind Grand HighStreet, Phase 1, Hinjawadi, MH, Pune – 411057, India

Website Builder Tool Market Overview (2023 to 2033)

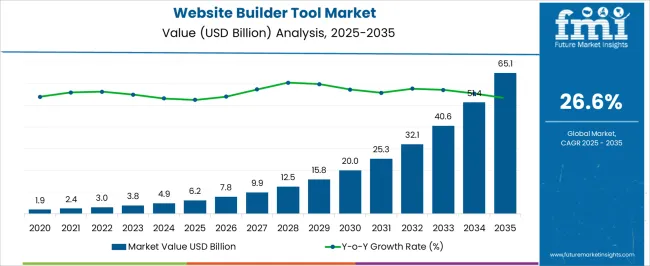
The website builder tool market leads to an approximate CAGR of 28% in the global market, during the forecast period and projects revenue valued at US$ 3754.2 million in 2023, and is expected to cross US$ 44322.2 million by 2033.

Attributes Details
Website Builder Tool Market Size (2023) US$ 3,754.2 million
Website Builder Tool Market Size (2033) US$ 44,322.2 million
Website Builder Tool Market CAGR 28%

Technological trends driven by the consumer’s demand for an increase in convenience, functionality, and efficiency surges the adoption of best website builder tool and easy website builder tool adoption trends. Cloud-based services from large enterprises as well as SMEs boost the sales of website builder tools along with website builder tool market future trends.

The high demand for PC website builders providing innovative website building options expands the free website builder tool market share. Increased safety and security measures and advantages related to data storage regarding cloud technologies propel the sales of website builder tools as well as website builder tool market key trends and opportunities. Different e-commerce free website builder tool with content management systems (CMS) used to build web pages and blog posts broaden the website builder tool market size.

Don't pay for what you don't need

Customize your report by selecting specific countries or regions and save 30%!

Key Features that Impact the Website Builder Tool Market

  • Inexperience or lack of knowledge regarding coding with minimal charges increases the adoption of website builder tools and also escalates the demand for website builder tools.
  • Several features, such as domain registration, hosted services, responsive web design, and search engine optimization capabilities, promote the website builder tool market growth.
  • Plenty of customization options owing to e-commerce incorporation with extremely user-friendly templates with high flexibility providers drive the sales of website builder tool. Social distancing due to the lockdown pertaining to COVID-19 surged growth in the e-commerce sector, consecutively expanding the website builder tool market size.
  • The rising adoption of smartphones and the use of social media across the world elevates the adoption of website builder tools.
  • Growing penetration of the internet across the globe, especially in developing economies, surges the demand for easy website builder tool. The growth of the online shopping sector provides scope for brands demanding a wider scale audience, bolstering the website builder tool market opportunities and website builder tool market share.
  • Other features of online shopping, such as the increasing number of smartphone users, convenient shopping methods, enormous variety, etc., increase the sales of the best website builder tool.
  • Technological developments expand the website builder tool market future trends owing to high demands in creating attractive and effective websites.

The Restraints of the Website Builder Tool Market Growth

  • The website builder tool market share hampers due to a lack of awareness regarding the benefits of online website builder software for businesses and industries.
  • Lack of awareness of the advantages of online website builder software and deploying traditional website building approaches in developing or underdeveloped economies further curbs the demand for website builder tools as well as website builder tool market key trends and opportunities.
  • Limited knowledge regarding monitor screen size, website appearance in mobile view, and SEO restraints further hinder the sales of website builder tools.
  • An excessive amount of flexibility and customization requirements by large enterprises unable to be executed by website builder software obstructs the website builder tool market growth.
  • The availability of free website building software options at online search engines thwarts the website builder tool market size. Threats from open source and improper selection of website building software impede the adoption of website builder tools.
  • Threats to data security and the high deployment cost of certain website building software further inhibit the demand for website builder tools.
Sudip Saha
Sudip Saha

Principal Consultant

Talk to Analyst

Find your sweet spots for generating winning opportunities in this market.

Scopes of the Website Builder Tool Market

Market players are banking on technological advancements surging better user interfaces by introducing new frameworks, design trends, and mobile app developments to satisfy huge consumer demands and promote the best website builder tool market growth.

Machine learning and AI implementation to further improve user interface increases demand for website builder tools. Implementation of progressive web apps catering to various consumer demands further surges the sales of website builder tools.

Various features, including robust integration with a wide array of third-party services like calendars, Instagram feeds, and maps, increase the demand for website builder tools. Government compliance, investments, and requirements contribute to the global website builder tool market share.

Region Wise Insights

North America Website Builder Tool Market Growth

North America leads the website builder tool market share with an approximate revenue of 38%. The early adoption of technology and its eventual advancements promise website builder tool market growth in this region.

Global technological advancement presents immense growth opportunities for website builder providers in this region. The presence of skillful website building vendors and providers benefits the website builder tool market size of this region.

Growth Outlook for the Asia Pacific Website Builder Tool Market

The Asia Pacific is the second and fastest-growing region in website builder tool market share. This is owing to the rising number of start-ups and small businesses in the developing economies of this region.

Japan experiencing an increase in the adoption of cloud-based services from large enterprises as well as SMEs, driving the demand for website builder tool.
Performance of the Europe Website Builder Tool Market

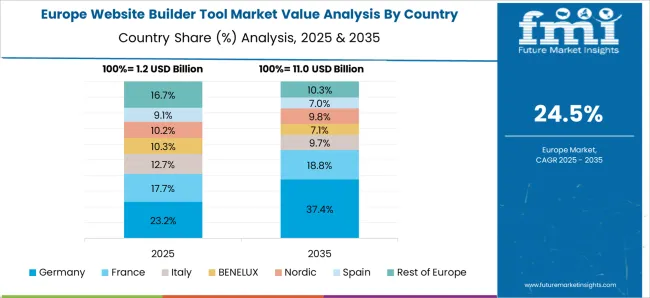
Europe projects a revenue share of 25% and is a growing website builder tool market. Owing to technological advancements and the presence of website builder providers in this region, the website builder tool market share experiences growth.

The increasing importance of having a strong online presence for businesses surges the website builder tool market growth by generating the demand for website builder tools. The cost-effective feature of these tools, including ease of use, propels the website builder tool market share.

Get the data you need at a Fraction of the cost

Personalize your report by choosing insights you need
and save 40%!

Category Wise Insights

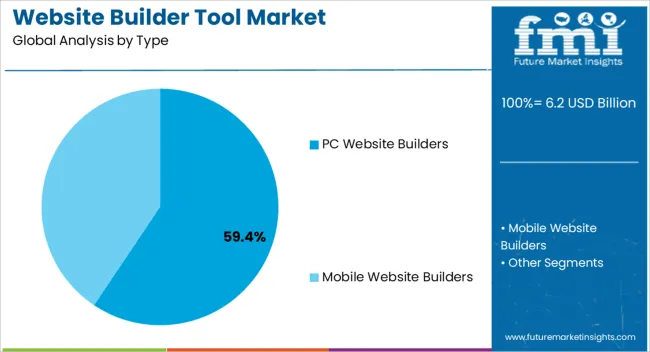
The website builders market is divided into two types: PC website builders and mobile website builders, with the PC website builders sector accounting for the highest CAGR of 27.5% throughout the period of projection.

The growing demand for PC-based website issues around the world is expected to drive demand for PC website builders in the next years. Almost every company in the entire globe has a website, consequently website builders are providing unique PC website creation choices.

The Start-up Ecosystem in the Website Builder Tool Market

Communicating and marketing have become routine among people. The advent of technology offers newer and better services and products that increase engagement in both social media and e-commerce.

Several start-up companies are implementing useful strategies to reach their potential customers in the ecommerce website builder tool market share.

Renderforest, FRONTASTIC, Shogun, Universe, Strikingly, Webflow, etc. provide various adoption of website builder tools such as responsive websites with drag and drop features, pre-designed templates and platforms, creation of online business cards, API-first e-commerce and CMS platforms for businesses, slideshow, and animated video maker, etc.
Competitive Landscape of the Website Builder Tool Market

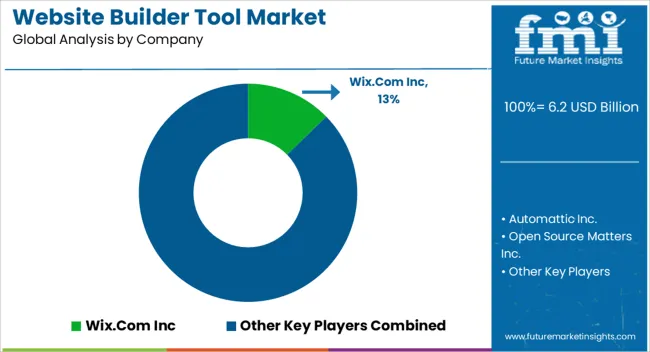
Some of the key market participants in the website builder tool market are Wix.com Inc., Automattic Inc., Open Source Matters Inc., Weebly, Inc., Webs, Duda and Doodlebit LLC, Yola Inc., IM CREATOR, SQUARESPACE, Sitey, JIMDO GmBH, WebStarts, GoDaddy, Mono Solutions, Shopify, Ecwid, Wordpress.Com, Basekit, Unbounce, Instapage, Webflow, The Endurance International Group Inc., Square Inc., WOW Slider, SITE123, Simbla Inc., Sitey, bluehost Inc., IM Creator Ltd., Homestead Technologies Inc., Zoho Corporation Pvt. Ltd., etc.

The ability to express one’s own brand in an inventive way to attract an audience is intriguing, as well as creating a website showcasing the product line, brand vision and goals, achievements, etc. Key website builder tool market players are utilizing this concept to develop different ecommerce website builder tool to attain these features.

Some of the recent developments in the website builder tool market are

  • In September 2020, GoDaddy announced its popular content design app over by GoDaddy, which is now deeply integrated into websites + marketing.
  • In August 2021, Wix announced the launch of a native mobile app builder which provides users with the ability to create and customize their own tailor-made app without a single line of code.
  • In September 2020, Mono Solutions announced a partnership with Lokale Internetwerbung GmBH & Co. KG, which brings the addition of Mono Websites to their proprietary toolbox offering.
  • Wix's new AI Site Generator feature, which was released in July 2023, allows Wix customers to define their objectives and produce a website replete with a homepage, internal pages, text and photos, and business-specific modules for events, reservations, and more.
  • Appy Pie website builder unveiled the integration of new and sophisticated features to its AI website builder in July 2023, with the goal of assisting businesses of all sizes across multiple verticals. Companies can simply express their website requirements utilizing text or voice prompts to offer basic information such as the website's name, kind, niche, design, and aims.

Report Scope

Report Attribute Details
Growth Rate CAGR of 28% from 2023 to 2033
Website Builder Tool Market Size (2023) US$ 3,754.2 million
Website Builder Tool Market Size (2033) US$ 44,322.2 million
Base year for estimation 2022
Historical data 2018 to 2022
Forecast period 2023 to 2033
Quantitative units Revenue in USD million and CAGR from 2023 to 2033
Report Coverage Revenue forecast, volume forecast, company ranking, competitive landscape, growth factors, and trends, Pricing Analysis
Segments Covered
  • Type
  • Application
  • Region
Regions Covered
  • North America
  • Latin America
  • Western Europe
  • Eastern Europe
  • South Asia & Pacific
  • East Asia
  • Middle East & Africa
Country scope
  • United States
  • Canada
  • Brazil
  • Mexico
  • Germany
  • United Kingdom
  • France
  • Spain
  • Italy
  • Poland
  • Russia
  • Czech Republic
  • Romania
  • India
  • Bangladesh
  • Australia
  • New Zealand
  • China
  • Japan
  • South Korea
  • GCC Countries
  • South Africa
  • Israel
Key companies profiled
  • Wix.com Inc.
  • Automattic Inc.
  • Open Source Matters Inc.
  • Weebly, Inc.
  • Webs
  • Duda and Doodlebit LLC
  • Yola Inc.
  • IM CREATOR
  • SQUARESPACE
  • Sitey
  • JIMDO GmBH
  • WebStarts
  • GoDaddy
  • Mono Solutions
  • Shopify
  • Ecwid,
  • Wordpress.Com
  • Basekit
  • Unbounce
  • Instapage
  • Webflow
  • The Endurance International Group Inc.
  • Square Inc.
  • WOW Slider
  • SITE123,
  • Simbla Inc.
  • Sitey
  • bluehost Inc.
  • IM Creator Ltd.
  • Homestead Technologies Inc.
  • Zoho Corporation Pvt. Ltd.
Customization & Pricing Available upon Request

Key Segments Covered

By Type:

  • PC Website Builders
  • Mobile Website Builders

By Application:

  • Personal Website
  • School or College Websites
  • Business Website
  • Others

By Region:

  • North America
  • Latin America
  • Western Europe
  • Eastern Europe
  • South Asia & Pacific
  • East Asia\
  • Middle East & Africa

Frequently Asked Questions

What is the Growth Potential of the Market?

The growth potential of the market is 28% through 2033.

What can be the Top Trend for the Market?

Technological trends are driven by the consumer’s demand for an increase in convenience.

What Limits the Growth Potential of the Market?

Lack of awareness of the advantages of online website builder software limits market growth.

What is Asia Pacific’s Growth Outlook?

The rising number of start-ups and small businesses surges the growth outlook.

What Drives Sales of the Market?

The high demand for PC website builders providing innovative website-building drives sales.

Table of Content

1. Executive Summary

    1.1. Global Market Outlook

    1.2. Demand-side Trends

    1.3. Supply-side Trends

    1.4. Technology Roadmap Analysis

    1.5. Analysis and Recommendations

2. Market Overview

    2.1. Market Coverage / Taxonomy

    2.2. Market Definition / Scope / Limitations

3. Market Background

    3.1. Market Dynamics

        3.1.1. Drivers

        3.1.2. Restraints

        3.1.3. Opportunity

        3.1.4. Trends

    3.2. Scenario Forecast

        3.2.1. Demand in Optimistic Scenario

        3.2.2. Demand in Likely Scenario

        3.2.3. Demand in Conservative Scenario

    3.3. Opportunity Map Analysis

    3.4. Investment Feasibility Matrix

    3.5. PESTLE and Porter’s Analysis

    3.6. Regulatory Landscape

        3.6.1. By Key Regions

        3.6.2. By Key Countries

    3.7. Regional Parent Market Outlook

4. Global Market Analysis 2018 to 2022 and Forecast, 2023 to 2033

    4.1. Historical Market Size Value (US$ Million) Analysis, 2018 to 2022

    4.2. Current and Future Market Size Value (US$ Million) Projections, 2023 to 2033

        4.2.1. Y-o-Y Growth Trend Analysis

        4.2.2. Absolute $ Opportunity Analysis

5. Global Market Analysis 2018 to 2022 and Forecast 2023 to 2033, By Type

    5.1. Introduction / Key Findings

    5.2. Historical Market Size Value (US$ Million) Analysis By Type, 2018 to 2022

    5.3. Current and Future Market Size Value (US$ Million) Analysis and Forecast By Type, 2023 to 2033

        5.3.1. PC Website Builders

        5.3.2. Mobile Website Builders

    5.4. Y-o-Y Growth Trend Analysis By Type, 2018 to 2022

    5.5. Absolute $ Opportunity Analysis By Type, 2023 to 2033

6. Global Market Analysis 2018 to 2022 and Forecast 2023 to 2033, By Application

    6.1. Introduction / Key Findings

    6.2. Historical Market Size Value (US$ Million) Analysis By Application, 2018 to 2022

    6.3. Current and Future Market Size Value (US$ Million) Analysis and Forecast By Application, 2023 to 2033

        6.3.1. Personal Website

        6.3.2. School or College Websites

        6.3.3. Business Website

        6.3.4. Others

    6.4. Y-o-Y Growth Trend Analysis By Application, 2018 to 2022

    6.5. Absolute $ Opportunity Analysis By Application, 2023 to 2033

7. Global Market Analysis 2018 to 2022 and Forecast 2023 to 2033, By Region

    7.1. Introduction

    7.2. Historical Market Size Value (US$ Million) Analysis By Region, 2018 to 2022

    7.3. Current Market Size Value (US$ Million) Analysis and Forecast By Region, 2023 to 2033

        7.3.1. North America

        7.3.2. Latin America

        7.3.3. Western Europe

        7.3.4. Eastern Europe

        7.3.5. South Asia and Pacific

        7.3.6. East Asia

        7.3.7. Middle East and Africa

    7.4. Market Attractiveness Analysis By Region

8. North America Market Analysis 2018 to 2022 and Forecast 2023 to 2033, By Country

    8.1. Historical Market Size Value (US$ Million) Trend Analysis By Market Taxonomy, 2018 to 2022

    8.2. Market Size Value (US$ Million) Forecast By Market Taxonomy, 2023 to 2033

        8.2.1. By Country

            8.2.1.1. USA

            8.2.1.2. Canada

        8.2.2. By Type

        8.2.3. By Application

    8.3. Market Attractiveness Analysis

        8.3.1. By Country

        8.3.2. By Type

        8.3.3. By Application

    8.4. Key Takeaways

9. Latin America Market Analysis 2018 to 2022 and Forecast 2023 to 2033, By Country

    9.1. Historical Market Size Value (US$ Million) Trend Analysis By Market Taxonomy, 2018 to 2022

    9.2. Market Size Value (US$ Million) Forecast By Market Taxonomy, 2023 to 2033

        9.2.1. By Country

            9.2.1.1. Brazil

            9.2.1.2. Mexico

            9.2.1.3. Rest of Latin America

        9.2.2. By Type

        9.2.3. By Application

    9.3. Market Attractiveness Analysis

        9.3.1. By Country

        9.3.2. By Type

        9.3.3. By Application

    9.4. Key Takeaways

10. Western Europe Market Analysis 2018 to 2022 and Forecast 2023 to 2033, By Country

    10.1. Historical Market Size Value (US$ Million) Trend Analysis By Market Taxonomy, 2018 to 2022

    10.2. Market Size Value (US$ Million) Forecast By Market Taxonomy, 2023 to 2033

        10.2.1. By Country

            10.2.1.1. Germany

            10.2.1.2. UK

            10.2.1.3. France

            10.2.1.4. Spain

            10.2.1.5. Italy

            10.2.1.6. Rest of Western Europe

        10.2.2. By Type

        10.2.3. By Application

    10.3. Market Attractiveness Analysis

        10.3.1. By Country

        10.3.2. By Type

        10.3.3. By Application

    10.4. Key Takeaways

11. Eastern Europe Market Analysis 2018 to 2022 and Forecast 2023 to 2033, By Country

    11.1. Historical Market Size Value (US$ Million) Trend Analysis By Market Taxonomy, 2018 to 2022

    11.2. Market Size Value (US$ Million) Forecast By Market Taxonomy, 2023 to 2033

        11.2.1. By Country

            11.2.1.1. Poland

            11.2.1.2. Russia

            11.2.1.3. Czech Republic

            11.2.1.4. Romania

            11.2.1.5. Rest of Eastern Europe

        11.2.2. By Type

        11.2.3. By Application

    11.3. Market Attractiveness Analysis

        11.3.1. By Country

        11.3.2. By Type

        11.3.3. By Application

    11.4. Key Takeaways

12. South Asia and Pacific Market Analysis 2018 to 2022 and Forecast 2023 to 2033, By Country

    12.1. Historical Market Size Value (US$ Million) Trend Analysis By Market Taxonomy, 2018 to 2022

    12.2. Market Size Value (US$ Million) Forecast By Market Taxonomy, 2023 to 2033

        12.2.1. By Country

            12.2.1.1. India

            12.2.1.2. Bangladesh

            12.2.1.3. Australia

            12.2.1.4. New Zealand

            12.2.1.5. Rest of South Asia and Pacific

        12.2.2. By Type

        12.2.3. By Application

    12.3. Market Attractiveness Analysis

        12.3.1. By Country

        12.3.2. By Type

        12.3.3. By Application

    12.4. Key Takeaways

13. East Asia Market Analysis 2018 to 2022 and Forecast 2023 to 2033, By Country

    13.1. Historical Market Size Value (US$ Million) Trend Analysis By Market Taxonomy, 2018 to 2022

    13.2. Market Size Value (US$ Million) Forecast By Market Taxonomy, 2023 to 2033

        13.2.1. By Country

            13.2.1.1. China

            13.2.1.2. Japan

            13.2.1.3. South Korea

        13.2.2. By Type

        13.2.3. By Application

    13.3. Market Attractiveness Analysis

        13.3.1. By Country

        13.3.2. By Type

        13.3.3. By Application

    13.4. Key Takeaways

14. Middle East and Africa Market Analysis 2018 to 2022 and Forecast 2023 to 2033, By Country

    14.1. Historical Market Size Value (US$ Million) Trend Analysis By Market Taxonomy, 2018 to 2022

    14.2. Market Size Value (US$ Million) Forecast By Market Taxonomy, 2023 to 2033

        14.2.1. By Country

            14.2.1.1. GCC Countries

            14.2.1.2. South Africa

            14.2.1.3. Israel

            14.2.1.4. Rest of MEA

        14.2.2. By Type

        14.2.3. By Application

    14.3. Market Attractiveness Analysis

        14.3.1. By Country

        14.3.2. By Type

        14.3.3. By Application

    14.4. Key Takeaways

15. Key Countries Market Analysis

    15.1. USA

        15.1.1. Pricing Analysis

        15.1.2. Market Share Analysis, 2022

            15.1.2.1. By Type

            15.1.2.2. By Application

    15.2. Canada

        15.2.1. Pricing Analysis

        15.2.2. Market Share Analysis, 2022

            15.2.2.1. By Type

            15.2.2.2. By Application

    15.3. Brazil

        15.3.1. Pricing Analysis

        15.3.2. Market Share Analysis, 2022

            15.3.2.1. By Type

            15.3.2.2. By Application

    15.4. Mexico

        15.4.1. Pricing Analysis

        15.4.2. Market Share Analysis, 2022

            15.4.2.1. By Type

            15.4.2.2. By Application

    15.5. Germany

        15.5.1. Pricing Analysis

        15.5.2. Market Share Analysis, 2022

            15.5.2.1. By Type

            15.5.2.2. By Application

    15.6. UK

        15.6.1. Pricing Analysis

        15.6.2. Market Share Analysis, 2022

            15.6.2.1. By Type

            15.6.2.2. By Application

    15.7. France

        15.7.1. Pricing Analysis

        15.7.2. Market Share Analysis, 2022

            15.7.2.1. By Type

            15.7.2.2. By Application

    15.8. Spain

        15.8.1. Pricing Analysis

        15.8.2. Market Share Analysis, 2022

            15.8.2.1. By Type

            15.8.2.2. By Application

    15.9. Italy

        15.9.1. Pricing Analysis

        15.9.2. Market Share Analysis, 2022

            15.9.2.1. By Type

            15.9.2.2. By Application

    15.10. Poland

        15.10.1. Pricing Analysis

        15.10.2. Market Share Analysis, 2022

            15.10.2.1. By Type

            15.10.2.2. By Application

    15.11. Russia

        15.11.1. Pricing Analysis

        15.11.2. Market Share Analysis, 2022

            15.11.2.1. By Type

            15.11.2.2. By Application

    15.12. Czech Republic

        15.12.1. Pricing Analysis

        15.12.2. Market Share Analysis, 2022

            15.12.2.1. By Type

            15.12.2.2. By Application

    15.13. Romania

        15.13.1. Pricing Analysis

        15.13.2. Market Share Analysis, 2022

            15.13.2.1. By Type

            15.13.2.2. By Application

    15.14. India

        15.14.1. Pricing Analysis

        15.14.2. Market Share Analysis, 2022

            15.14.2.1. By Type

            15.14.2.2. By Application

    15.15. Bangladesh

        15.15.1. Pricing Analysis

        15.15.2. Market Share Analysis, 2022

            15.15.2.1. By Type

            15.15.2.2. By Application

    15.16. Australia

        15.16.1. Pricing Analysis

        15.16.2. Market Share Analysis, 2022

            15.16.2.1. By Type

            15.16.2.2. By Application

    15.17. New Zealand

        15.17.1. Pricing Analysis

        15.17.2. Market Share Analysis, 2022

            15.17.2.1. By Type

            15.17.2.2. By Application

    15.18. China

        15.18.1. Pricing Analysis

        15.18.2. Market Share Analysis, 2022

            15.18.2.1. By Type

            15.18.2.2. By Application

    15.19. Japan

        15.19.1. Pricing Analysis

        15.19.2. Market Share Analysis, 2022

            15.19.2.1. By Type

            15.19.2.2. By Application

    15.20. South Korea

        15.20.1. Pricing Analysis

        15.20.2. Market Share Analysis, 2022

            15.20.2.1. By Type

            15.20.2.2. By Application

    15.21. GCC Countries

        15.21.1. Pricing Analysis

        15.21.2. Market Share Analysis, 2022

            15.21.2.1. By Type

            15.21.2.2. By Application

    15.22. South Africa

        15.22.1. Pricing Analysis

        15.22.2. Market Share Analysis, 2022

            15.22.2.1. By Type

            15.22.2.2. By Application

    15.23. Israel

        15.23.1. Pricing Analysis

        15.23.2. Market Share Analysis, 2022

            15.23.2.1. By Type

            15.23.2.2. By Application

16. Market Structure Analysis

    16.1. Competition Dashboard

    16.2. Competition Benchmarking

    16.3. Market Share Analysis of Top Players

        16.3.1. By Regional

        16.3.2. By Type

        16.3.3. By Application

17. Competition Analysis

    17.1. Competition Deep Dive

        17.1.1. Wix.com Inc

            17.1.1.1. Overview

            17.1.1.2. Product Portfolio

            17.1.1.3. Profitability by Market Segments

            17.1.1.4. Sales Footprint

            17.1.1.5. Strategy Overview

                17.1.1.5.1. Marketing Strategy

        17.1.2. Automattic Inc.

            17.1.2.1. Overview

            17.1.2.2. Product Portfolio

            17.1.2.3. Profitability by Market Segments

            17.1.2.4. Sales Footprint

            17.1.2.5. Strategy Overview

                17.1.2.5.1. Marketing Strategy

        17.1.3. Open Source Matters Inc.

            17.1.3.1. Overview

            17.1.3.2. Product Portfolio

            17.1.3.3. Profitability by Market Segments

            17.1.3.4. Sales Footprint

            17.1.3.5. Strategy Overview

                17.1.3.5.1. Marketing Strategy

        17.1.4. Weebly

            17.1.4.1. Overview

            17.1.4.2. Product Portfolio

            17.1.4.3. Profitability by Market Segments

            17.1.4.4. Sales Footprint

            17.1.4.5. Strategy Overview

                17.1.4.5.1. Marketing Strategy

        17.1.5. Webs

            17.1.5.1. Overview

            17.1.5.2. Product Portfolio

            17.1.5.3. Profitability by Market Segments

            17.1.5.4. Sales Footprint

            17.1.5.5. Strategy Overview

                17.1.5.5.1. Marketing Strategy

        17.1.6. Duda and Doodlebit LLC

            17.1.6.1. Overview

            17.1.6.2. Product Portfolio

            17.1.6.3. Profitability by Market Segments

            17.1.6.4. Sales Footprint

            17.1.6.5. Strategy Overview

                17.1.6.5.1. Marketing Strategy

        17.1.7. Yola Inc.

            17.1.7.1. Overview

            17.1.7.2. Product Portfolio

            17.1.7.3. Profitability by Market Segments

            17.1.7.4. Sales Footprint

            17.1.7.5. Strategy Overview

                17.1.7.5.1. Marketing Strategy

        17.1.8. IM CREATOR

            17.1.8.1. Overview

            17.1.8.2. Product Portfolio

            17.1.8.3. Profitability by Market Segments

            17.1.8.4. Sales Footprint

            17.1.8.5. Strategy Overview

                17.1.8.5.1. Marketing Strategy

        17.1.9. SQUARESPACE

            17.1.9.1. Overview

            17.1.9.2. Product Portfolio

            17.1.9.3. Profitability by Market Segments

            17.1.9.4. Sales Footprint

            17.1.9.5. Strategy Overview

                17.1.9.5.1. Marketing Strategy

        17.1.10. Sitey

            17.1.10.1. Overview

            17.1.10.2. Product Portfolio

            17.1.10.3. Profitability by Market Segments

            17.1.10.4. Sales Footprint

            17.1.10.5. Strategy Overview

                17.1.10.5.1. Marketing Strategy

        17.1.11. JIMDO GmBH

            17.1.11.1. Overview

            17.1.11.2. Product Portfolio

            17.1.11.3. Profitability by Market Segments

            17.1.11.4. Sales Footprint

            17.1.11.5. Strategy Overview

                17.1.11.5.1. Marketing Strategy

        17.1.12. WebStarts

            17.1.12.1. Overview

            17.1.12.2. Product Portfolio

            17.1.12.3. Profitability by Market Segments

            17.1.12.4. Sales Footprint

            17.1.12.5. Strategy Overview

                17.1.12.5.1. Marketing Strategy

        17.1.13. GoDaddy

            17.1.13.1. Overview

            17.1.13.2. Product Portfolio

            17.1.13.3. Profitability by Market Segments

            17.1.13.4. Sales Footprint

            17.1.13.5. Strategy Overview

                17.1.13.5.1. Marketing Strategy

        17.1.14. Mono Solutions

            17.1.14.1. Overview

            17.1.14.2. Product Portfolio

            17.1.14.3. Profitability by Market Segments

            17.1.14.4. Sales Footprint

            17.1.14.5. Strategy Overview

                17.1.14.5.1. Marketing Strategy

        17.1.15. Shopify

            17.1.15.1. Overview

            17.1.15.2. Product Portfolio

            17.1.15.3. Profitability by Market Segments

            17.1.15.4. Sales Footprint

            17.1.15.5. Strategy Overview

                17.1.15.5.1. Marketing Strategy

        17.1.16. Ecwid

            17.1.16.1. Overview

            17.1.16.2. Product Portfolio

            17.1.16.3. Profitability by Market Segments

            17.1.16.4. Sales Footprint

            17.1.16.5. Strategy Overview

                17.1.16.5.1. Marketing Strategy

        17.1.17. Wordpress.Com

            17.1.17.1. Overview

            17.1.17.2. Product Portfolio

            17.1.17.3. Profitability by Market Segments

            17.1.17.4. Sales Footprint

            17.1.17.5. Strategy Overview

                17.1.17.5.1. Marketing Strategy

18. Assumptions & Acronyms Used

19. Research Methodology

List of Tables

Table 1: Global Market Value (US$ Million) Forecast by Region, 2018 to 2033

Table 2: Global Market Value (US$ Million) Forecast by Type, 2018 to 2033

Table 3: Global Market Value (US$ Million) Forecast by Application, 2018 to 2033

Table 4: North America Market Value (US$ Million) Forecast by Country, 2018 to 2033

Table 5: North America Market Value (US$ Million) Forecast by Type, 2018 to 2033

Table 6: North America Market Value (US$ Million) Forecast by Application, 2018 to 2033

Table 7: Latin America Market Value (US$ Million) Forecast by Country, 2018 to 2033

Table 8: Latin America Market Value (US$ Million) Forecast by Type, 2018 to 2033

Table 9: Latin America Market Value (US$ Million) Forecast by Application, 2018 to 2033

Table 10: Western Europe Market Value (US$ Million) Forecast by Country, 2018 to 2033

Table 11: Western Europe Market Value (US$ Million) Forecast by Type, 2018 to 2033

Table 12: Western Europe Market Value (US$ Million) Forecast by Application, 2018 to 2033

Table 13: Eastern Europe Market Value (US$ Million) Forecast by Country, 2018 to 2033

Table 14: Eastern Europe Market Value (US$ Million) Forecast by Type, 2018 to 2033

Table 15: Eastern Europe Market Value (US$ Million) Forecast by Application, 2018 to 2033

Table 16: South Asia and Pacific Market Value (US$ Million) Forecast by Country, 2018 to 2033

Table 17: South Asia and Pacific Market Value (US$ Million) Forecast by Type, 2018 to 2033

Table 18: South Asia and Pacific Market Value (US$ Million) Forecast by Application, 2018 to 2033

Table 19: East Asia Market Value (US$ Million) Forecast by Country, 2018 to 2033

Table 20: East Asia Market Value (US$ Million) Forecast by Type, 2018 to 2033

Table 21: East Asia Market Value (US$ Million) Forecast by Application, 2018 to 2033

Table 22: Middle East and Africa Market Value (US$ Million) Forecast by Country, 2018 to 2033

Table 23: Middle East and Africa Market Value (US$ Million) Forecast by Type, 2018 to 2033

Table 24: Middle East and Africa Market Value (US$ Million) Forecast by Application, 2018 to 2033

List of Charts

Figure 1: Global Market Value (US$ Million) by Type, 2023 to 2033

Figure 2: Global Market Value (US$ Million) by Application, 2023 to 2033

Figure 3: Global Market Value (US$ Million) by Region, 2023 to 2033

Figure 4: Global Market Value (US$ Million) Analysis by Region, 2018 to 2033

Figure 5: Global Market Value Share (%) and BPS Analysis by Region, 2023 to 2033

Figure 6: Global Market Y-o-Y Growth (%) Projections by Region, 2023 to 2033

Figure 7: Global Market Value (US$ Million) Analysis by Type, 2018 to 2033

Figure 8: Global Market Value Share (%) and BPS Analysis by Type, 2023 to 2033

Figure 9: Global Market Y-o-Y Growth (%) Projections by Type, 2023 to 2033

Figure 10: Global Market Value (US$ Million) Analysis by Application, 2018 to 2033

Figure 11: Global Market Value Share (%) and BPS Analysis by Application, 2023 to 2033

Figure 12: Global Market Y-o-Y Growth (%) Projections by Application, 2023 to 2033

Figure 13: Global Market Attractiveness by Type, 2023 to 2033

Figure 14: Global Market Attractiveness by Application, 2023 to 2033

Figure 15: Global Market Attractiveness by Region, 2023 to 2033

Figure 16: North America Market Value (US$ Million) by Type, 2023 to 2033

Figure 17: North America Market Value (US$ Million) by Application, 2023 to 2033

Figure 18: North America Market Value (US$ Million) by Country, 2023 to 2033

Figure 19: North America Market Value (US$ Million) Analysis by Country, 2018 to 2033

Figure 20: North America Market Value Share (%) and BPS Analysis by Country, 2023 to 2033

Figure 21: North America Market Y-o-Y Growth (%) Projections by Country, 2023 to 2033

Figure 22: North America Market Value (US$ Million) Analysis by Type, 2018 to 2033

Figure 23: North America Market Value Share (%) and BPS Analysis by Type, 2023 to 2033

Figure 24: North America Market Y-o-Y Growth (%) Projections by Type, 2023 to 2033

Figure 25: North America Market Value (US$ Million) Analysis by Application, 2018 to 2033

Figure 26: North America Market Value Share (%) and BPS Analysis by Application, 2023 to 2033

Figure 27: North America Market Y-o-Y Growth (%) Projections by Application, 2023 to 2033

Figure 28: North America Market Attractiveness by Type, 2023 to 2033

Figure 29: North America Market Attractiveness by Application, 2023 to 2033

Figure 30: North America Market Attractiveness by Country, 2023 to 2033

Figure 31: Latin America Market Value (US$ Million) by Type, 2023 to 2033

Figure 32: Latin America Market Value (US$ Million) by Application, 2023 to 2033

Figure 33: Latin America Market Value (US$ Million) by Country, 2023 to 2033

Figure 34: Latin America Market Value (US$ Million) Analysis by Country, 2018 to 2033

Figure 35: Latin America Market Value Share (%) and BPS Analysis by Country, 2023 to 2033

Figure 36: Latin America Market Y-o-Y Growth (%) Projections by Country, 2023 to 2033

Figure 37: Latin America Market Value (US$ Million) Analysis by Type, 2018 to 2033

Figure 38: Latin America Market Value Share (%) and BPS Analysis by Type, 2023 to 2033

Figure 39: Latin America Market Y-o-Y Growth (%) Projections by Type, 2023 to 2033

Figure 40: Latin America Market Value (US$ Million) Analysis by Application, 2018 to 2033

Figure 41: Latin America Market Value Share (%) and BPS Analysis by Application, 2023 to 2033

Figure 42: Latin America Market Y-o-Y Growth (%) Projections by Application, 2023 to 2033

Figure 43: Latin America Market Attractiveness by Type, 2023 to 2033

Figure 44: Latin America Market Attractiveness by Application, 2023 to 2033

Figure 45: Latin America Market Attractiveness by Country, 2023 to 2033

Figure 46: Western Europe Market Value (US$ Million) by Type, 2023 to 2033

Figure 47: Western Europe Market Value (US$ Million) by Application, 2023 to 2033

Figure 48: Western Europe Market Value (US$ Million) by Country, 2023 to 2033

Figure 49: Western Europe Market Value (US$ Million) Analysis by Country, 2018 to 2033

Figure 50: Western Europe Market Value Share (%) and BPS Analysis by Country, 2023 to 2033

Figure 51: Western Europe Market Y-o-Y Growth (%) Projections by Country, 2023 to 2033

Figure 52: Western Europe Market Value (US$ Million) Analysis by Type, 2018 to 2033

Figure 53: Western Europe Market Value Share (%) and BPS Analysis by Type, 2023 to 2033

Figure 54: Western Europe Market Y-o-Y Growth (%) Projections by Type, 2023 to 2033

Figure 55: Western Europe Market Value (US$ Million) Analysis by Application, 2018 to 2033

Figure 56: Western Europe Market Value Share (%) and BPS Analysis by Application, 2023 to 2033

Figure 57: Western Europe Market Y-o-Y Growth (%) Projections by Application, 2023 to 2033

Figure 58: Western Europe Market Attractiveness by Type, 2023 to 2033

Figure 59: Western Europe Market Attractiveness by Application, 2023 to 2033

Figure 60: Western Europe Market Attractiveness by Country, 2023 to 2033

Figure 61: Eastern Europe Market Value (US$ Million) by Type, 2023 to 2033

Figure 62: Eastern Europe Market Value (US$ Million) by Application, 2023 to 2033

Figure 63: Eastern Europe Market Value (US$ Million) by Country, 2023 to 2033

Figure 64: Eastern Europe Market Value (US$ Million) Analysis by Country, 2018 to 2033

Figure 65: Eastern Europe Market Value Share (%) and BPS Analysis by Country, 2023 to 2033

Figure 66: Eastern Europe Market Y-o-Y Growth (%) Projections by Country, 2023 to 2033

Figure 67: Eastern Europe Market Value (US$ Million) Analysis by Type, 2018 to 2033

Figure 68: Eastern Europe Market Value Share (%) and BPS Analysis by Type, 2023 to 2033

Figure 69: Eastern Europe Market Y-o-Y Growth (%) Projections by Type, 2023 to 2033

Figure 70: Eastern Europe Market Value (US$ Million) Analysis by Application, 2018 to 2033

Figure 71: Eastern Europe Market Value Share (%) and BPS Analysis by Application, 2023 to 2033

Figure 72: Eastern Europe Market Y-o-Y Growth (%) Projections by Application, 2023 to 2033

Figure 73: Eastern Europe Market Attractiveness by Type, 2023 to 2033

Figure 74: Eastern Europe Market Attractiveness by Application, 2023 to 2033

Figure 75: Eastern Europe Market Attractiveness by Country, 2023 to 2033

Figure 76: South Asia and Pacific Market Value (US$ Million) by Type, 2023 to 2033

Figure 77: South Asia and Pacific Market Value (US$ Million) by Application, 2023 to 2033

Figure 78: South Asia and Pacific Market Value (US$ Million) by Country, 2023 to 2033

Figure 79: South Asia and Pacific Market Value (US$ Million) Analysis by Country, 2018 to 2033

Figure 80: South Asia and Pacific Market Value Share (%) and BPS Analysis by Country, 2023 to 2033

Figure 81: South Asia and Pacific Market Y-o-Y Growth (%) Projections by Country, 2023 to 2033

Figure 82: South Asia and Pacific Market Value (US$ Million) Analysis by Type, 2018 to 2033

Figure 83: South Asia and Pacific Market Value Share (%) and BPS Analysis by Type, 2023 to 2033

Figure 84: South Asia and Pacific Market Y-o-Y Growth (%) Projections by Type, 2023 to 2033

Figure 85: South Asia and Pacific Market Value (US$ Million) Analysis by Application, 2018 to 2033

Figure 86: South Asia and Pacific Market Value Share (%) and BPS Analysis by Application, 2023 to 2033

Figure 87: South Asia and Pacific Market Y-o-Y Growth (%) Projections by Application, 2023 to 2033

Figure 88: South Asia and Pacific Market Attractiveness by Type, 2023 to 2033

Figure 89: South Asia and Pacific Market Attractiveness by Application, 2023 to 2033

Figure 90: South Asia and Pacific Market Attractiveness by Country, 2023 to 2033

Figure 91: East Asia Market Value (US$ Million) by Type, 2023 to 2033

Figure 92: East Asia Market Value (US$ Million) by Application, 2023 to 2033

Figure 93: East Asia Market Value (US$ Million) by Country, 2023 to 2033

Figure 94: East Asia Market Value (US$ Million) Analysis by Country, 2018 to 2033

Figure 95: East Asia Market Value Share (%) and BPS Analysis by Country, 2023 to 2033

Figure 96: East Asia Market Y-o-Y Growth (%) Projections by Country, 2023 to 2033

Figure 97: East Asia Market Value (US$ Million) Analysis by Type, 2018 to 2033

Figure 98: East Asia Market Value Share (%) and BPS Analysis by Type, 2023 to 2033

Figure 99: East Asia Market Y-o-Y Growth (%) Projections by Type, 2023 to 2033

Figure 100: East Asia Market Value (US$ Million) Analysis by Application, 2018 to 2033

Figure 101: East Asia Market Value Share (%) and BPS Analysis by Application, 2023 to 2033

Figure 102: East Asia Market Y-o-Y Growth (%) Projections by Application, 2023 to 2033

Figure 103: East Asia Market Attractiveness by Type, 2023 to 2033

Figure 104: East Asia Market Attractiveness by Application, 2023 to 2033

Figure 105: East Asia Market Attractiveness by Country, 2023 to 2033

Figure 106: Middle East and Africa Market Value (US$ Million) by Type, 2023 to 2033

Figure 107: Middle East and Africa Market Value (US$ Million) by Application, 2023 to 2033

Figure 108: Middle East and Africa Market Value (US$ Million) by Country, 2023 to 2033

Figure 109: Middle East and Africa Market Value (US$ Million) Analysis by Country, 2018 to 2033

Figure 110: Middle East and Africa Market Value Share (%) and BPS Analysis by Country, 2023 to 2033

Figure 111: Middle East and Africa Market Y-o-Y Growth (%) Projections by Country, 2023 to 2033

Figure 112: Middle East and Africa Market Value (US$ Million) Analysis by Type, 2018 to 2033

Figure 113: Middle East and Africa Market Value Share (%) and BPS Analysis by Type, 2023 to 2033

Figure 114: Middle East and Africa Market Y-o-Y Growth (%) Projections by Type, 2023 to 2033

Figure 115: Middle East and Africa Market Value (US$ Million) Analysis by Application, 2018 to 2033

Figure 116: Middle East and Africa Market Value Share (%) and BPS Analysis by Application, 2023 to 2033

Figure 117: Middle East and Africa Market Y-o-Y Growth (%) Projections by Application, 2023 to 2033

Figure 118: Middle East and Africa Market Attractiveness by Type, 2023 to 2033

Figure 119: Middle East and Africa Market Attractiveness by Application, 2023 to 2033

Figure 120: Middle East and Africa Market Attractiveness by Country, 2023 to 2033

Recommendations

Technology

Web Conferencing Market

Published : October 2023

Technology

Web Real Time Communication Solution Market

Published : June 2023

Technology

Web Content Management Market

Published : July 2022

Explore Technology Insights

View Reports

Website Builder Tool Market