The tool holders market stands at the threshold of a decade-long expansion trajectory that promises to reshape precision machining technology and manufacturing efficiency solutions. The market's journey from USD 1,366.2 million in 2025 to USD 2,268.1 million by 2035 represents substantial growth, demonstrating the accelerating adoption of advanced tool holding technology and machining precision optimization across automotive manufacturing, aerospace operations, and general fabrication sectors.
The first half of the decade (2025 to 2030) will witness the market climbing from USD 1,366.2 million to approximately USD 1,760.3 million, adding USD 394.1 million in value, which constitutes 44% of the total forecast growth period. This phase will be characterized by the rapid adoption of precision taper systems, driven by increasing manufacturing automation and the growing need for advanced tool holding solutions worldwide. Enhanced rigidity capabilities and automated tool change systems will become standard expectations rather than premium options.
The latter half (2030 to 2035) will witness continued growth from USD 1,760.3 million to USD 2,268.1 million, representing an addition of USD 507.8 million or 56% of the decade's expansion. This period will be defined by mass market penetration of high-speed machining technologies, integration with comprehensive smart manufacturing platforms, and seamless compatibility with existing CNC infrastructure. The market trajectory signals fundamental shifts in how manufacturing facilities approach machining efficiency and tool management, with participants positioned to benefit from growing demand across multiple taper types and industry segments.
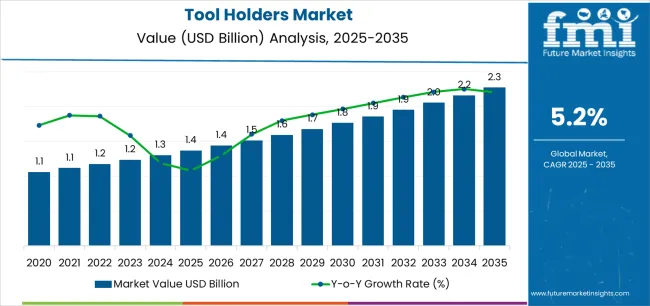
| Period | Primary Revenue Buckets | Share | Notes |
|---|---|---|---|
| Today | New tool holder sales (BT, HSK, others) | 58% | Capex-driven, CNC machine upgrades |
| Replacement & wear parts | 22% | Tool wear, precision degradation | |
| Specialized taper systems | 12% | High-speed machining, aerospace applications | |
| Aftermarket accessories | 8% | Adapters, extensions, balancing systems | |
| Future (3-5 yrs) | High-speed precision systems | 45-50% | Industry 4.0 integration, smart tooling |
| Smart tool holders & sensors | 15 to 20% | Real-time monitoring, predictive maintenance | |
| Replacement & retrofit | 18-22% | Aging machine tools, precision upgrades | |
| Specialized aerospace solutions | 10-15% | Titanium machining, composite materials | |
| Modular & quick-change systems | 8-12% | Flexibility requirements, setup reduction | |
| Data & analytics services | 3-5% | Tool life optimization, performance monitoring |
At-a-Glance Metrics
| Metric | Value |
|---|---|
| Market Value (2025) | USD 1,366.2 million |
| Market Forecast (2035) | USD 2,268.1 million |
| Growth Rate | 5.2% CAGR |
| Leading Technology | BT Flange Taper |
| Primary Application | Automotive Segment |
The market demonstrates strong fundamentals with BT Flange Taper systems capturing a dominant share through advanced precision holding capabilities and manufacturing efficiency optimization. Automotive applications drive primary demand, supported by increasing production volumes and machining accuracy requirements. Geographic expansion remains concentrated in developed markets with established manufacturing infrastructure, while emerging economies show accelerating adoption rates driven by industrialization initiatives and rising precision machining standards.
Primary Classification: The market segments by taper type into R8, Morse Taper, V-Flange Taper, and BT Flange Taper, representing the evolution from basic tool holding equipment to sophisticated precision solutions for comprehensive machining optimization.
Secondary Classification: End-use segmentation divides the market into automotive, aerospace & defense, electronics, and general machining & fabrication sectors, reflecting distinct requirements for precision levels, production volumes, and quality standards.
Tertiary Classification: Regional distribution covers North America, Latin America, Western Europe, Eastern Europe, East Asia, South Asia Pacific, and Middle East & Africa, with developed markets leading adoption while emerging economies show accelerating growth patterns driven by manufacturing expansion programs.
The segmentation structure reveals technology progression from standard tool holding equipment toward sophisticated precision systems with enhanced accuracy and automation capabilities, while application diversity spans from high-volume automotive production to precision aerospace machining operations requiring specialized holding solutions.
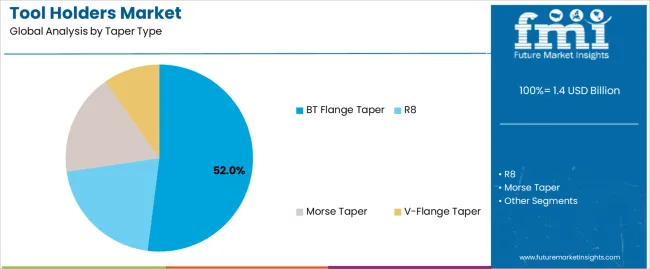
Market Position: BT Flange Taper systems command the leading position in the tool holders market with 52% market share through advanced precision features, including superior gripping force, pull stud reliability, and CNC machine compatibility that enable manufacturing facilities to achieve optimal machining accuracy across diverse automotive and general machining environments.
Value Drivers: The segment benefits from manufacturing facility preference for proven tool holding systems that provide consistent machining performance, reduced setup time, and operational efficiency optimization without requiring significant infrastructure modifications. Advanced design features enable automated tool change compatibility, vibration dampening, and integration with existing CNC equipment, where machining precision and reliability represent critical facility requirements.
Competitive Advantages: BT Flange Taper systems differentiate through proven operational reliability, consistent gripping characteristics, and integration with automated manufacturing systems that enhance facility effectiveness while maintaining optimal quality standards suitable for diverse automotive and general machining applications.
Key market characteristics:
Morse Taper systems maintain a 22% market position in the tool holders market due to their self-locking properties and broad compatibility advantages. These systems appeal to facilities requiring versatile tool holding with proven reliability for drilling and traditional machining applications. Market presence is sustained by general machining demand, emphasizing cost-effective holding solutions and operational simplicity through established taper designs.
V-Flange Taper systems capture 14% market share through specialized machining requirements in aerospace facilities, precision manufacturing, and high-performance applications. These facilities demand dual-contact tool holding systems capable of handling high-speed operations while providing enhanced rigidity capabilities and precision characteristics.
R8 Taper systems account for 12% market share through small machine applications, tool room operations, and manual machining centers requiring compact tool holding solutions with manual tool change compatibility.
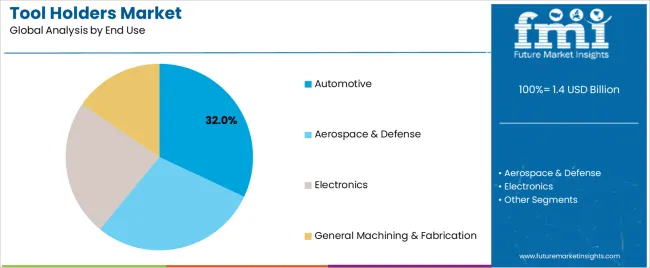
Market Context: Automotive manufacturing demonstrates the highest growth rate in the tool holders market, capturing a 32% share, driven by the widespread adoption of advanced machining systems. This growth is fueled by a growing focus on production efficiency optimization, component precision enhancement, and manufacturing cost reduction applications, all of which maximize output quality while maintaining throughput standards.
Appeal Factors: Automotive manufacturers prioritize system reliability, rapid tool change capability, and integration with existing production infrastructure that enables coordinated machining operations across multiple production cells. The segment benefits from substantial manufacturing investment and automation programs that emphasize the acquisition of precision tool holders for production optimization and quality assurance applications.
Growth Drivers: Electric vehicle production programs incorporate advanced machining systems as standard equipment for powertrain operations, while lightweighting trends increase demand for precision machining capabilities that comply with tolerance standards and minimize production complexity.
Market Challenges: Varying machining requirements and material diversity may limit tool holder standardization across different production scenarios or component types.
Application dynamics include:
Aerospace & Defense applications capture 28% market share through specialized machining requirements in aircraft component production, turbine manufacturing, and defense equipment fabrication. These facilities demand highest-precision tool holding systems capable of operating with exotic materials while providing maximum rigidity and vibration dampening capabilities.
Electronics manufacturing accounts for 18% market share, including PCB drilling operations, semiconductor equipment production, and miniature component machining requiring ultra-precision tool holding capabilities for micro-machining optimization and dimensional accuracy.
General Machining & Fabrication applications maintain 26% market share through job shop operations, contract manufacturing facilities, and general industrial production requiring versatile tool holding solutions with broad material compatibility and cost-effectiveness.
| Category | Factor | Impact | Why It Matters |
|---|---|---|---|
| Driver | Manufacturing automation & CNC machine growth (Industry 4.0, smart factories) | ★★★★★ | Automated production requires reliable tool holding with consistent performance; high-speed machining increases precision demands and tool holder sophistication. |
| Driver | Automotive production & electric vehicle manufacturing (lightweighting, new materials) | ★★★★★ | High-volume automotive production drives tool holder demand; EV component machining requires precision holding for aluminum, composites, and battery housings. |
| Driver | Aerospace precision requirements & exotic material machining (titanium, composites) | ★★★★☆ | Aerospace tolerances demand highest-precision holders; difficult-to-machine materials require maximum rigidity and vibration control for surface finish and accuracy. |
| Restraint | High initial investment for precision systems (especially HSK and shrink-fit holders) | ★★★★☆ | Small manufacturers defer premium holder purchases; price sensitivity limits adoption of advanced systems in price-competitive general machining segments. |
| Restraint | Machine tool compatibility & standardization issues | ★★★☆☆ | Different CNC machines require specific taper standards; lack of universal compatibility creates inventory complexity and limits holder flexibility across machines. |
| Trend | Smart tool holders & sensor integration (RFID, vibration monitoring, tool wear detection) | ★★★★★ | Real-time tool condition monitoring enables predictive maintenance; data-driven machining optimization transforms production efficiency and reduces unplanned downtime. |
| Trend | High-speed machining & HSK adoption (balanced systems, thermal stability) | ★★★★☆ | Spindle speeds above 10,000 RPM require advanced holders; aerospace and medical device manufacturing driving HSK adoption for superior high-speed performance. |
The tool holders market demonstrates varied regional dynamics with Growth Leaders including China (7.0% growth rate) and India (6.5% growth rate) driving expansion through manufacturing capacity initiatives and industrial development programs. Steady Performers encompass Germany (6.0% growth rate), United States (4.9% growth rate), and developed regions, benefiting from established manufacturing industries and precision machining advancement. Emerging Markets feature developing regions where industrialization initiatives and manufacturing modernization support consistent growth patterns.
Regional synthesis reveals East Asian markets leading adoption through manufacturing expansion and automotive production development, while European countries maintain strong expansion supported by precision engineering excellence and aerospace manufacturing requirements. North American markets show moderate growth driven by reshoring initiatives and advanced manufacturing adoption trends.
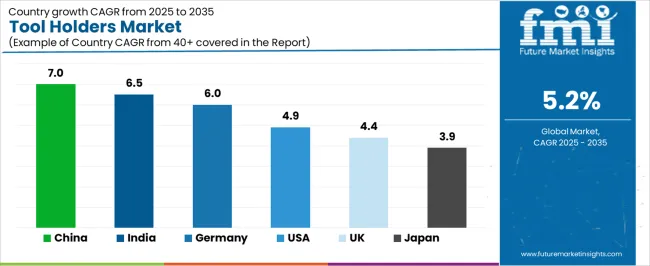
| Region/Country | 2025 to 2035 Growth | How to win | What to watch out |
|---|---|---|---|
| China | 7.0% | Focus on cost-effective BT holders; volume pricing | Intense local competition; rapid commoditization |
| India | 6.5% | Lead with automotive-focused solutions | Infrastructure gaps; skilled labor shortage |
| Germany | 6.0% | Emphasize precision HSK systems; aerospace quality | Over-engineering; lengthy qualification cycles |
| United States | 4.9% | Push smart tooling; Industry 4.0 integration | Reshoring uncertainty; labor cost pressures |
| UK | 4.4% | Offer retrofit solutions; technical support | Brexit impacts; manufacturing decline |
| Japan | 3.9% | Premium quality; thermal stability features | Conservative adoption; aging workforce |
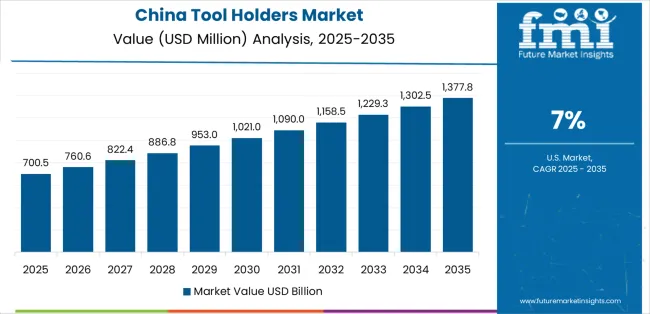
China establishes fastest market growth through aggressive manufacturing expansion programs and comprehensive industrial development, integrating advanced tool holders as standard components in CNC machining centers and automated production installations. The country's 7.0% growth rate reflects government initiatives promoting advanced manufacturing and Made in China 2025 programs that mandate the use of precision tool holding systems in automotive and electronics facilities. Growth concentrates in major industrial clusters, including Guangdong, Jiangsu, and Zhejiang provinces, where manufacturing technology development showcases integrated tool holder systems that appeal to manufacturers seeking advanced production optimization capabilities and quality enhancement applications.
Chinese manufacturers are developing cost-competitive tool holder solutions that combine domestic production advantages with improving precision features, including balanced designs and automated tool change compatibility. Distribution channels through machinery dealers and industrial distributors expand market access, while government manufacturing upgrade programs support adoption across diverse automotive and general machining segments.
Strategic Market Indicators:
In Pune, Chennai, and Bangalore, automotive facilities and precision machining operations are implementing advanced tool holders as standard equipment for production optimization and quality compliance applications, driven by increasing manufacturing investment and production capacity programs that emphasize the importance of machining precision capabilities. The market holds a 6.5% growth rate, supported by government Make in India initiatives and automotive sector expansion programs that promote precision tool holding systems for automotive and general machining facilities. Indian manufacturers are adopting tool holder systems that provide reliable performance and cost-effectiveness, particularly appealing in automotive clusters where production efficiency and quality standards represent critical operational requirements.
Market expansion benefits from growing automotive component manufacturing and machine tool installation growth that enable domestic production of tool holders for machining and production applications. Technology adoption follows patterns established in manufacturing equipment, where value-for-money and reliability drive procurement decisions and operational deployment.
Market Intelligence Brief:
Germany establishes market leadership through comprehensive precision engineering programs and advanced manufacturing infrastructure development, integrating tool holders across automotive and aerospace machining applications. The country's 6.0% growth rate reflects established machine tool industry relationships and mature precision machining adoption that supports widespread use of advanced tool holding systems in automotive and aerospace manufacturing facilities. Growth concentrates in major industrial regions, including Baden-Württemberg, Bavaria, and North Rhine-Westphalia, where manufacturing excellence showcases mature tool holder deployment that appeals to manufacturers seeking proven precision capabilities and machining efficiency applications.
German equipment providers leverage established distribution networks and comprehensive technical support capabilities, including application engineering programs and training services that create customer relationships and operational advantages. The market benefits from mature quality standards and aerospace requirements that mandate precision tool holder use while supporting technology advancement and machining optimization.
Market Intelligence Brief:
United States demonstrates growing tool holder adoption with 4.9% growth rate, driven by manufacturing reshoring initiatives and smart factory implementation. Major manufacturing centers including Michigan, Ohio, and California showcase advanced CNC installations where smart tool holders integrate with tool management software and predictive maintenance systems to optimize machining operations. The market benefits from aerospace manufacturing concentration, automotive production modernization, and growing emphasis on domestic manufacturing capability building. American manufacturers prioritize reliability, technical support availability, and integration with existing production systems.
Distribution patterns favor industrial distributors with technical expertise, while direct OEM relationships serve large automotive and aerospace manufacturers through application engineering support. Market growth concentrates in sectors with high-value component production where precision and consistency justify premium tool holder investments.
Market Intelligence Brief:
United Kingdom's manufacturing market demonstrates moderate tool holder adoption with 4.4% growth rate, supported by aerospace manufacturing excellence and precision engineering concentration. Major industrial areas including Midlands, Northwest England, and Scotland showcase specialized machining operations where precision tool holders provide critical performance for aerospace component production and high-value manufacturing. The market benefits from established aerospace supply chains, Formula 1 racing technology clusters, and medical device manufacturing requiring exceptional precision and quality.
British manufacturers prioritize technical support, training availability, and proven performance in demanding applications. Distribution channels through specialized industrial suppliers and machine tool dealers expand market access for both aerospace suppliers and general engineering facilities.
Strategic Market Considerations:

Tool holders market expansion in Japan benefits from diverse precision manufacturing demand, including automotive production in Toyota City and Yokohama, precision machinery manufacturing, and technology equipment programs that increasingly incorporate tool holder solutions for machining optimization applications. The country maintains a 3.9% growth rate, driven by quality consciousness and recognition of precision machining benefits, including thermal stability and vibration control.
Market dynamics focus on premium tool holder designs that balance advanced precision performance with thermal management considerations important to Japanese manufacturing standards. Growing automation adoption creates continued demand for reliable tool holders in production infrastructure and manufacturing modernization projects.
Strategic Market Considerations:

The tool holders market in Europe is projected to grow from USD 488.8 million in 2025 to USD 817.6 million by 2035, registering a CAGR of 5.3% over the forecast period. Germany is expected to maintain its leadership position with a 42.1% market share in 2025, supported by its advanced precision manufacturing infrastructure and major automotive and aerospace production centers in Bavaria, Baden-Württemberg, and North Rhine-Westphalia.
United Kingdom follows with a 18.3% share in 2025, driven by comprehensive aerospace manufacturing programs and precision engineering excellence. France holds a 16.2% share through specialized automotive applications and aerospace component production requirements. Italy commands a 12.8% share, while Spain accounts for 10.6% in 2025. The rest of Europe region is anticipated to gain momentum, expanding its collective share from 7.1% to 8.4% by 2035, attributed to increasing precision machining adoption in Nordic countries and emerging Eastern European manufacturing facilities implementing production modernization programs.
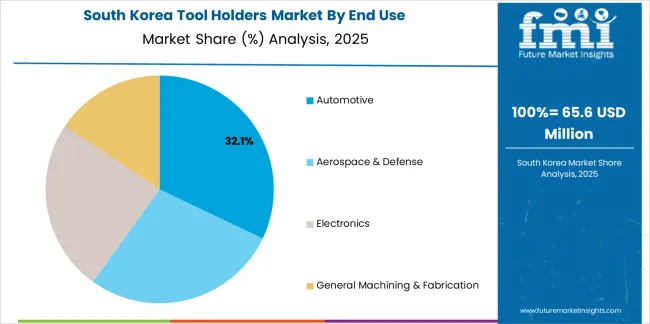
South Korea demonstrates sophisticated tool holder adoption with 5.8% growth rate, driven by advanced automotive manufacturing and electronics production infrastructure. Major industrial centers including Ulsan, Pohang, and Changwon showcase automated manufacturing facilities where precision tool holders integrate with high-speed CNC systems and smart factory platforms to optimize production operations. The market benefits from automotive manufacturing concentration, shipbuilding precision requirements, and semiconductor equipment production demanding exceptional accuracy.
Korean manufacturers prioritize automation compatibility, precision consistency, and integration with domestic CNC machine tool brands prevalent in local factories. Market growth reflects both automotive sector investments and expanding electronics manufacturing requiring micro-precision machining capabilities. Distribution channels through machinery importers and industrial trading companies serve manufacturing sectors, while growing domestic tool holder production addresses cost-sensitive segments. Technology partnerships between Korean machine tool builders and international tool holder manufacturers drive product development tailored to local manufacturing requirements and automation standards.

The tool holders market demonstrates consolidated competitive dynamics with approximately 15-20 credible manufacturers globally, where top 5 players control 65-70% revenue share through technology leadership, precision engineering capabilities, and comprehensive product portfolios. Market leadership requires balancing multiple capabilities including taper precision manufacturing, material science expertise, application engineering support, and global distribution network management.
Structure: Competitive landscape divides between established cutting tool manufacturers with comprehensive tooling solutions, specialized tool holder technology companies focused on precision systems, and machine tool builders offering proprietary holders for their equipment. Traditional tooling brands maintain advantage through distributor relationships and technical support infrastructure, while technology-focused companies differentiate through smart holder integration, vibration dampening innovations, and high-speed machining optimization.
Leadership is maintained through: extensive distribution networks, application engineering support, precision manufacturing capabilities, and machine tool builder partnerships (OEM supply agreements, co-development programs, technical certification).
What's commoditizing: standard BT taper holders, basic Morse taper systems, and conventional pull stud designs without advanced features.
Margin Opportunities: smart tool holders with sensor integration, high-speed HSK systems, shrink-fit technology, specialized aerospace holders, predictive maintenance services, and tool management software platforms.
| Stakeholder | What they actually control | Typical strengths | Typical blind spots |
|---|---|---|---|
| Global tooling leaders | Distribution reach, product breadth, technical support infrastructure | Comprehensive portfolios, brand trust, application engineering | Innovation speed; niche precision segments; smart technology integration |
| Precision specialists | Advanced taper technology, high-speed systems, aerospace certifications | Latest precision features, material innovations, application expertise | Distribution scale; mass market pricing; emerging market access |
| Machine tool builders | Proprietary spindle interfaces, OEM supply channels, installed base | System integration, machine compatibility, bundled offerings | Third-party machine support; aftermarket flexibility; standardization |
| Regional manufacturers | Local production, distributor relationships, cost competitiveness | "Close to customer" service, competitive pricing, quick delivery | Technology gaps; global certifications; aerospace qualifications |
| Smart tooling innovators | RFID technology, sensor integration, software platforms | Industry 4.0 capabilities, data analytics, predictive features | Manufacturing scale; traditional channel access; price competitiveness |
Market competition intensifies around smart manufacturing integration, high-speed machining capabilities, and precision consistency. Companies investing in sensor-enabled holders, thermal stability enhancements, and comprehensive tool management software position themselves advantageously for sustained market share gains. Success increasingly depends on balancing precision manufacturing excellence with digital technology integration and application engineering capabilities that drive specification preferences across diverse manufacturing segments.
| Item | Value |
|---|---|
| Quantitative Units | USD 1,366.2 million |
| Taper Type | R8, Morse Taper, V-Flange Taper, BT Flange Taper |
| End Use | Automotive, Aerospace & Defense, Electronics, General Machining & Fabrication |
| Regions Covered | North America, Latin America, Western Europe, Eastern Europe, East Asia, South Asia Pacific, Middle East & Africa |
| Countries Covered | China, India, Germany, United States, United Kingdom, Japan, South Korea, France, Italy, Spain, and 25+ additional countries |
| Key Companies Profiled | Guhring KG, Seco Tools AB, Emuge-Franken, NT Tool Corporation, Mapal Group, Sandvik Coromant, Kennametal Inc., BIG Kaiser Precision Tooling Inc., Schunk GmbH & Co. KG |
| Additional Attributes | Dollar sales by taper type and end-use categories, regional adoption trends across East Asia, Europe, and North America, competitive landscape with cutting tool manufacturers and precision tooling suppliers, manufacturing operator preferences for precision holding control and system reliability, integration with CNC platforms and smart manufacturing systems, innovations in tool holding technology and precision enhancement, and development of automated tooling solutions with enhanced performance and machining optimization capabilities. |
The global tool holders market is estimated to be valued at USD 1,366.2 million in 2025.
The market size for the tool holders market is projected to reach USD 2,268.1 million by 2035.
The tool holders market is expected to grow at a 5.2% CAGR between 2025 and 2035.
The key product types in tool holders market are bt flange taper , r8, morse taper and v-flange taper.
In terms of end use, automotive segment to command 32.0% share in the tool holders market in 2025.


Our Research Products

The "Full Research Suite" delivers actionable market intel, deep dives on markets or technologies, so clients act faster, cut risk, and unlock growth.

The Leaderboard benchmarks and ranks top vendors, classifying them as Established Leaders, Leading Challengers, or Disruptors & Challengers.

Locates where complements amplify value and substitutes erode it, forecasting net impact by horizon

We deliver granular, decision-grade intel: market sizing, 5-year forecasts, pricing, adoption, usage, revenue, and operational KPIs—plus competitor tracking, regulation, and value chains—across 60 countries broadly.

Spot the shifts before they hit your P&L. We track inflection points, adoption curves, pricing moves, and ecosystem plays to show where demand is heading, why it is changing, and what to do next across high-growth markets and disruptive tech

Real-time reads of user behavior. We track shifting priorities, perceptions of today’s and next-gen services, and provider experience, then pace how fast tech moves from trial to adoption, blending buyer, consumer, and channel inputs with social signals (#WhySwitch, #UX).

Partner with our analyst team to build a custom report designed around your business priorities. From analysing market trends to assessing competitors or crafting bespoke datasets, we tailor insights to your needs.
Supplier Intelligence
Discovery & Profiling
Capacity & Footprint
Performance & Risk
Compliance & Governance
Commercial Readiness
Who Supplies Whom
Scorecards & Shortlists
Playbooks & Docs
Category Intelligence
Definition & Scope
Demand & Use Cases
Cost Drivers
Market Structure
Supply Chain Map
Trade & Policy
Operating Norms
Deliverables
Buyer Intelligence
Account Basics
Spend & Scope
Procurement Model
Vendor Requirements
Terms & Policies
Entry Strategy
Pain Points & Triggers
Outputs
Pricing Analysis
Benchmarks
Trends
Should-Cost
Indexation
Landed Cost
Commercial Terms
Deliverables
Brand Analysis
Positioning & Value Prop
Share & Presence
Customer Evidence
Go-to-Market
Digital & Reputation
Compliance & Trust
KPIs & Gaps
Outputs
Full Research Suite comprises of:
Market outlook & trends analysis
Interviews & case studies
Strategic recommendations
Vendor profiles & capabilities analysis
5-year forecasts
8 regions and 60+ country-level data splits
Market segment data splits
12 months of continuous data updates
DELIVERED AS:
PDF EXCEL ONLINE
Demand for Tool Holders in Japan Size and Share Forecast Outlook 2025 to 2035
Demand for Tool Holders in USA Size and Share Forecast Outlook 2025 to 2035
Tool Box Market Size and Share Forecast Outlook 2025 to 2035
Tool Tethering Market Size and Share Forecast Outlook 2025 to 2035
Tool Steel Market Size and Share Forecast Outlook 2025 to 2035
Tool Presetter Market Trend Analysis Based on Product, Category, End-Use, and Region 2025 to 2035
Understanding Market Share Trends in the Tool Box Industry
Tool Holder Collets Market
Tool Chest Market
Stool Management System Market Analysis - Size, Share, and Forecast Outlook 2025 to 2035
Gas Holders Market Growth - Trends & Forecast 2025 to 2035
Can Holders Market Analysis – Size, Share & Forecast 2024 to 2034
CNC Tool Storage System Market
Brow Tools Market Size and Share Forecast Outlook 2025 to 2035
Hand Tools Market Size and Share Forecast Outlook 2025 to 2035
Key Players in the Hand Tools Market Share Analysis
Power Tools Market Size and Share Forecast Outlook 2025 to 2035
Smart Tools Market Size and Share Forecast Outlook 2025 to 2035
Power Tools Industry Analysis in India - Size, Share, and Forecast Outlook 2025 to 2035
Power Tool Gears Market - Growth & Demand 2025 to 2035

Thank you!
You will receive an email from our Business Development Manager. Please be sure to check your SPAM/JUNK folder too.
Chat With
MaRIA