Protective Packaging Market Size and Share Forecast Outlook 2025 to 2035

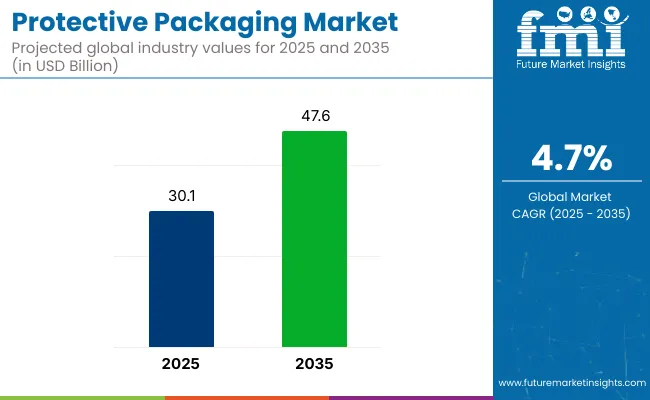
The global protective packaging market is projected to reach USD 30.1 billion in 2025 and grow to USD 47.6 billion by 2035, registering a CAGR of 4.7%. Sales in 2024 were recorded at USD 28.5 billion.
Quick Stats of Protective Packaging Market

  • Market Value (2025): USD 30.1 billion
  • Forecast Value (2035): USD 47.6 billion
  • Forecast CAGR: 4.7%
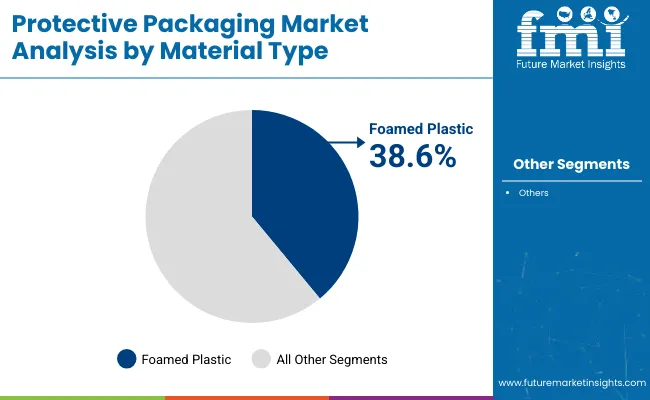
  • Material Type Leader in 2025: Foamed plastic (38.6% market share)
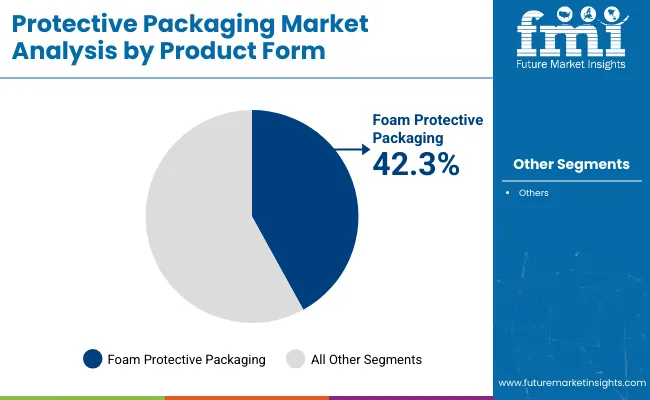
  • Top Product Form: Foam Protective Packaging (42.3% share)
  • Key Growth Country: East Asia (Vietnam is the fastest-growing market with 7.2% CAGR)

Protective Packaging Market

Metric Value
Industry Size (2025E) USD 30.1 Billion
Industry Value (2035F) USD 47.6 Billion
CAGR (2025 to 2035) 4.7%

Growth has been driven by the expanding e-commerce sector, the proliferation of cold chain logistics, and stringent product safety standards across multiple industries. Protective packaging has been increasingly adopted to reduce product damage during transit and storage, with demand surging across electronics, pharmaceuticals, and food & beverage applications.

Corrugated boxes are projected to maintain dominance, commanding over 33.9% market share by 2035, supported by their strength, stackability, and cost-effectiveness. On the materials front, plastics are anticipated to lead, capturing 42.6% of the total market, due to their lightweight properties and protective performance. In 2024, Asia Pacific emerged as the leading region, contributing 34.8% of global revenues. The regional lead is reinforced by robust e-commerce growth and infrastructure investments in logistics and cold chain systems.

Industry players are channeling investments into sustainable innovation and quality-driven solutions. For example, Amcor plc has focused on developing recyclable flexible packaging to support clients’ ESG targets. As stated by Peter Konieczny, CEO of Amcor plc, “Our focus remains on delivering packaging solutions that not only protect products but also contribute to a more sustainable future,” reflecting the sector’s pivot toward circular economy principles.

With increased regulatory scrutiny and evolving consumer expectations, the protective packaging market is being reshaped by technological advancements, eco-friendly material adoption, and strategic partnerships, ensuring both product safety and environmental responsibility.

Semi Annual Market Update

The below table presents the expected CAGR for the global protective packaging market over several semi-annual periods spanning from 2024 to 2034.

Particular Value CAGR
H1(2024 to 2034) 4.4%
H2(2024 to 2034) 4.6%
H1(2025 to 2035) 4.6%
H2(2025 to 2035) 4.8%

In the first half (H1) of the decade from 2024 to 2034, the business is predicted to surge at a CAGR of 4.4%, followed by a slightly higher growth rate of 4.6% in the second half (H2) of the same decade. Moving into the subsequent period, from H1 2025 to H2 2035, the CAGR is projected to decrease slightly to 4.6% in the first half and remain relatively moderate at 4.8% in the second half. In the first half (H1) the market witnessed a decrease of 110 BPS while in the second half (H2), the market witnessed an increase of 120 BPS.
Analyzing Protective Packaging Market by Top Investment Segments

Foamed Plastic Material Adopted for Its Cushioning and Structural Support

Protective Packaging Market Analysis By Material Type

Foamed plastic material is expected to hold the largest share of 38.6% in the protective packaging market in 2025, as its usage has been driven by high impact absorption, shock resistance, and lightweight construction.

Expanded polyethylene, polystyrene, and polyurethane foams have been utilized across appliance, electronics, and industrial component packaging. Compression resilience and dimensional stability have been optimized for repeated handling and stacking. Complex part geometries and void fills have been accommodated through custom-molded foam inserts.

Compatibility with die-cutting, lamination, and automated assembly systems has improved operational efficiency. Static dissipation and thermal insulation properties have enhanced the material’s utility in sensitive equipment logistics. Multi-density configurations have supported performance across light-duty and heavy-duty applications. Continued adoption has been sustained by broad material availability and consistent protective results across supply chains.
Foam Protective Packaging Leads with Usage Across High-Value and Fragile Product Categories

Protective Packaging Market Analysis By Product Form

The foam protective packaging segment is projected to account for 42.3% of the protective packaging market in 2025, as its leadership has been maintained through widespread use in shipping electronics, medical devices, and instruments.

Cushion blocks, corner pads, and inner trays have been employed to prevent surface abrasion and internal movement during transit. High energy absorption, shape retention, and structural integrity have been prioritized in foam formats. Custom solutions have been deployed for product-specific requirements in both B2B and retail channels.

Close-fitting foam designs have been tailored to reduce vibration, impact, and scuffing during handling and delivery. Multi-layered configurations have been implemented for modular and stacked shipments. Foam inserts have been incorporated into returnable and disposable packaging systems depending on product lifecycle needs. Segment dominance has been reinforced by the need for precision fit and comprehensive surface protection.

Key Industry Highlights

Surging Demand for Secure and Shock-Resistant Packaging in Electronics Industry

Rising production of consumer electronics, semiconductors, and batteries fuels demand for shock-resistant, anti-static, and tamper-proof protective packaging. Manufacturers pay extra attention to packaging that resists ESD, damage, and moisture entry so that products remain unaltered during storage and transportation. As the global export of high-value tech products rises, companies need safe, impact-resistant materials that minimize possible losses from shipment-related damage.

As businesses optimize supply chains, there is an increasing demand for custom-molded foams, anti-static bags, and rigid enclosures. Packaging solutions must offer precision cushioning along with barrier protection as fragile components continue to get smaller and more delicate. Companies also integrate smart packaging with impact indicators and tamper evidence for better security and quality control in the electronics supply chain.

Global Trade Expansion and Supply Chain Complexity Drive Protective Packaging Demand

The growth in global trade and increased complexity in a supply chain are major drivers of demand for protective packaging. As international trade continues to increase, companies struggle with complying with regional shipping regulations. Therefore, companies increasingly require versatile, compliant protective packaging that protects the products while adapting to different standards.

Besides, companies seek lighter, leaner packaging materials that help reduce transportation costs and optimize logistics. These materials must weigh the strength versus the durability factor for the assurance of safety at transit. Today, with complicated supply chains throughout the world, cost-effective solutions, efficient methods of packaging for protective purposes while enduring long distance travel and regionally compliant conditions remain in an increasingly high demand.

Environmental Concerns over Packaging Waste May Hinder Protective Packaging Growth

Growing environmental concerns regarding waste generated by protective packaging are a significant challenge. Single-use plastics, foams, and non-biodegradable materials widely used in packaging are some of the contributors to the growing volume of waste. Poor disposal habits increase the volumes of landfill overflows and increase pollution levels in marine ecosystems.

Consumers and business are now awakened to the environmental implications of waste from packaging. However, the use of eco-friendly materials is costly in terms of production and logistics. Those companies that refuse to switch to greener options may experience regulatory forces against them, damage to their reputation, and a change in consumer preferences. All these may hinder the expansion of the protective packaging market.

Market Concentration

Tier 1 companies comprise market leaders capturing significant market share in global market. These industry leaders stand out for having a large product variety and a high production capacity. These industry giants stand out for having a wide geographic reach, a wealth of production experience in a variety of package styles, and a strong customer base.

They offer a variety of services, such as recycling and manufacturing, using state-of-the-art equipment, according to legal requirements, and offering the best possible quality. Among the well-known businesses in tier 1 are Sealed Air Corporation, Sonoco Products Company, Smurfit Westrock and DS Smith plc.

Tier 2 companies include mid-size players having presence in specific regions and highly influencing the local market. They are distinguished by having a significant international presence and in-depth industry expertise. These market participants may not have cutting-edge technology or a broad worldwide reach, but they do guarantee regulatory compliance and have good technology.

Among the well-known businesses in tier 2 are Schur Flexibles Holding GesmbH,3M Company, Intertape Polymer Group Inc, Storopack Hans Reichenecker GmbH, International Paper Company, Elsons International, Protective Packaging Inc., Ibex Packaging, Bradford Company, Orcon Industries and Supreme Protective Packaging.

Tier 3 includes the majority of small-scale companies operating at the local presence and serving niche markets Due to their specialization in serving the demands of the local market, these companies are classified as belonging to the tier 3 sharing sector. They only operate on a small scale and within a limited geographic area. Within this specific context, Tier 3 is categorized as an unstructured market, denoting an industry that is significantly less formalized and structured than its organized rivals.

Country Wise Insights

The section below covers the future forecast for the protective packaging market in terms of countries. Information on key countries in several parts of the globe, including North America, Latin America, East Asia, South Asia and Pacific, Western Europe, Eastern Europe and MEA is provided. USA is anticipated to grow with a CAGR of 3.2% through 2035. In Western Europe, Germany is projected to witness a CAGR of 2.7% by 2035.

Countries Value CAGR (2025 to 2035)
USA 3.2%
Germany 2.7%
China 5.2%
UK 1.1%
Spain 2.9%
India 6.0%
Canada 2.4%

Rising Medical Device and Biologic Shipments Fuel Demand for Protective Packaging

A growing pharmaceutical and medical device industry is major driver in USA for higher demand for protective packaging solutions. Since medical devices and biologics are sensitive to environmental factors, including temperature, light, and physical damage, they need packaging that ensures product sterility alongside ruggedness for protection during shipment and through the entire supply chain.

Protective packaging such as sterile bags, sealed pouches, and custom foams ensure protection throughout the supply chain. In addition, with rising biologics, which are highly temperature sensitive, and require specialized storage, insulated packaging such as gel packs and thermal containers are also much on demand. This growing need reflects the broader shift toward specialized, high-performance packaging in the healthcare sector.

Spain's Logistics Growth Drives Demand for Advanced Protective Packaging Solutions

Spain's manufacturing and logistics sectors are growing progressively because of various investments in key logistics hubs, like Madrid and Barcelona. The cities are becoming center points for international shipping, thereby enhancing Spain as the major distribution hub in Europe. As cross-border trade increases especially within the EU, so is the demand for protective packaging solutions to ensure undamaged goods delivery.

Advanced solutions such as cushioning materials, insulated packaging, and secure sealing are required for protective packaging in various industries, including automotive, consumer electronics, and food exports. The growth in logistics and manufacturing results in more robust demand for protective packaging to support Spain's expanding global supply chain.

Competitive Landscape

Leading companies in the protective market are expanding their geographic reach and merging with other companies. Few of them are also working together to develop new products in partnerships with start-up businesses and regional brands.

Key Development

In 2025, UFP Technologies continued its strategic expansion in the medical protective packaging sector by acquiring Welch Fluorocarbon. This acquisition enhances UFP's capabilities in producing thermoformed components and packaging solutions for medical devices, aligning with the growing demand for specialized protective packaging in the healthcare industry.

Key Players

  • Sealed Air Corporation
  • Sonoco Products Company
  • Smurfit Westrock
  • DS Smith plc
  • Schur Flexibles Holding GesmbH
  • 3M Company
  • Intertape Polymer Group Inc
  • Storopack Hans Reichenecker GmbH
  • International Paper Company
  • Elsons International
  • Protective Packaging Inc.
  • Ibex Packaging
  • Bradford Company
  • Orcon Industries
  • Supreme Protective Packaging

Key Segmentation

By Material:

In terms of material, the industry is segmented into paper & paperboard, plastic, foam and others (wood, metal and fabric).

By Packaging Format:

In terms of packaging format, the industry is segmented into boxes, bags & pouches, labels & tags, tapes, wraps & rolls, envelopes & mailers and other formats (packaging peanuts, end caps and edge protectors).

By End Use:

End uses for protective packaging are manufacturing & warehousing and logistics & transportation. Manufacturing & warehousing includes food, beverages, pharmaceuticals, personal care & cosmetics, homecare & toiletries, electrical & electronics, chemical & fertilizers and other industrial.

By Region:

Key countries of North America, Latin America, East Asia, South Asia and Pacific, Western Europe, Eastern Europe, Middle East and Africa are covered.

Table of Content

  1. Executive Summary
  2. Industry Introduction, including Taxonomy and Market Definition
  3. Market Trends and Success Factors, including Macro-economic Factors, Market Dynamics, and Recent Industry Developments
  4. Global Market Demand Analysis 2020 to 2024 and Forecast 2025 to 2035, including Historical Analysis and Future Projections
  5. Global Market Analysis 2020 to 2024 and Forecast 2025 to 2035
    • Material
    • Packaging Format
    • End Use
  6. Global Market Analysis 2020 to 2024 and Forecast 2025 to 2035, By Material
    • Paper & Paperboard
    • Plastic
    • Foam
    • Others (Wood, Metal, and Fabric)
  7. Global Market Analysis 2020 to 2024 and Forecast 2025 to 2035, By Packaging Format
    • Boxes
    • Bags & Pouches
    • Labels & Tags
    • Tapes
    • Wraps & Rolls
    • Envelopes & Mailers
    • Inserts & Dividers
    • Other Formats (Packaging Peanuts, End Caps, and Edge Protectors)
  8. Global Market Analysis 2020 to 2024 and Forecast 2025 to 2035, By End Use
    • Manufacturing & Warehousing
    • Logistics & Transportation
    • Cartons
    • Others
  9. Global Market Analysis 2020 to 2024 and Forecast 2025 to 2035, By Region
    • North America
    • Latin America
    • East Asia
    • South Asia & Pacific
    • Western Europe
    • Eastern Europe
    • Middle East & Africa
  10. North America Sales Analysis 2020 to 2024 and Forecast 2025 to 2035, by Key Segments and Countries
  11. Latin America Sales Analysis 2020 to 2024 and Forecast 2025 to 2035, by Key Segments and Countries
  12. East Asia Sales Analysis 2020 to 2024 and Forecast 2025 to 2035, by Key Segments and Countries
  13. South Asia & Pacific Sales Analysis 2020 to 2024 and Forecast 2025 to 2035, by Key Segments and Countries
  14. Western Europe Sales Analysis 2020 to 2024 and Forecast 2025 to 2035, by Key Segments and Countries
  15. Eastern Europe Sales Analysis 2020 to 2024 and Forecast 2025 to 2035, by Key Segments and Countries
  16. Middle East & Africa Sales Analysis 2020 to 2024 and Forecast 2025 to 2035, by Key Segments and Countries
  17. Sales Forecast 2025 to 2035 by Material, Packaging Format, and End Use for 30 Countries
  18. Competition Outlook, including Market Structure Analysis, Company Share Analysis by Key Players, and Competition Dashboard
  19. Company Profile
    • Sealed Air Corporation
    • Sonoco Products Company
    • Smurfit Westrock
    • DS Smith plc
    • Schur Flexibles Holding GesmbH
    • 3M Company
    • Intertape Polymer Group Inc
    • Storopack Hans Reichenecker GmbH
    • International Paper Company
    • Elsons International

List of Tables

  • Table 1: Global Market Value (USD Million) Forecast by Region, 2020 to 2035
  • Table 2: Global Market Volume (Tons) Forecast by Region, 2020 to 2035
  • Table 3: Global Market Value (USD Million) Forecast by Material Type, 2020 to 2035
  • Table 4: Global Market Volume (Tons) Forecast by Material Type, 2020 to 2035
  • Table 5: Global Market Value (USD Million) Forecast by Product Type, 2020 to 2035
  • Table 6: Global Market Volume (Tons) Forecast by Product Type, 2020 to 2035
  • Table 7: Global Market Value (USD Million) Forecast by Function Type, 2020 to 2035
  • Table 8: Global Market Volume (Tons) Forecast by Function Type, 2020 to 2035
  • Table 9: North America Market Value (USD Million) Forecast by Country, 2020 to 2035
  • Table 10: North America Market Volume (Tons) Forecast by Country, 2020 to 2035
  • Table 11: North America Market Value (USD Million) Forecast by Material Type, 2020 to 2035
  • Table 12: North America Market Volume (Tons) Forecast by Material Type, 2020 to 2035
  • Table 13: North America Market Value (USD Million) Forecast by Product Type, 2020 to 2035
  • Table 14: North America Market Volume (Tons) Forecast by Product Type, 2020 to 2035
  • Table 15: North America Market Value (USD Million) Forecast by Function Type, 2020 to 2035
  • Table 16: North America Market Volume (Tons) Forecast by Function Type, 2020 to 2035
  • Table 17: Latin America Market Value (USD Million) Forecast by Country, 2020 to 2035
  • Table 18: Latin America Market Volume (Tons) Forecast by Country, 2020 to 2035
  • Table 19: Latin America Market Value (USD Million) Forecast by Material Type, 2020 to 2035
  • Table 20: Latin America Market Volume (Tons) Forecast by Material Type, 2020 to 2035
  • Table 21: Latin America Market Value (USD Million) Forecast by Product Type, 2020 to 2035
  • Table 22: Latin America Market Volume (Tons) Forecast by Product Type, 2020 to 2035
  • Table 23: Latin America Market Value (USD Million) Forecast by Function Type, 2020 to 2035
  • Table 24: Latin America Market Volume (Tons) Forecast by Function Type, 2020 to 2035
  • Table 25: Europe Market Value (USD Million) Forecast by Country, 2020 to 2035
  • Table 26: Europe Market Volume (Tons) Forecast by Country, 2020 to 2035
  • Table 27: Europe Market Value (USD Million) Forecast by Material Type, 2020 to 2035
  • Table 28: Europe Market Volume (Tons) Forecast by Material Type, 2020 to 2035
  • Table 29: Europe Market Value (USD Million) Forecast by Product Type, 2020 to 2035
  • Table 30: Europe Market Volume (Tons) Forecast by Product Type, 2020 to 2035
  • Table 31: Europe Market Value (USD Million) Forecast by Function Type, 2020 to 2035
  • Table 32: Europe Market Volume (Tons) Forecast by Function Type, 2020 to 2035
  • Table 33: East Asia Market Value (USD Million) Forecast by Country, 2020 to 2035
  • Table 34: East Asia Market Volume (Tons) Forecast by Country, 2020 to 2035
  • Table 35: East Asia Market Value (USD Million) Forecast by Material Type, 2020 to 2035
  • Table 36: East Asia Market Volume (Tons) Forecast by Material Type, 2020 to 2035
  • Table 37: East Asia Market Value (USD Million) Forecast by Product Type, 2020 to 2035
  • Table 38: East Asia Market Volume (Tons) Forecast by Product Type, 2020 to 2035
  • Table 39: East Asia Market Value (USD Million) Forecast by Function Type, 2020 to 2035
  • Table 40: East Asia Market Volume (Tons) Forecast by Function Type, 2020 to 2035
  • Table 41: South Asia Market Value (USD Million) Forecast by Country, 2020 to 2035
  • Table 42: South Asia Market Volume (Tons) Forecast by Country, 2020 to 2035
  • Table 43: South Asia Market Value (USD Million) Forecast by Material Type, 2020 to 2035
  • Table 44: South Asia Market Volume (Tons) Forecast by Material Type, 2020 to 2035
  • Table 45: South Asia Market Value (USD Million) Forecast by Product Type, 2020 to 2035
  • Table 46: South Asia Market Volume (Tons) Forecast by Product Type, 2020 to 2035
  • Table 47: South Asia Market Value (USD Million) Forecast by Function Type, 2020 to 2035
  • Table 48: South Asia Market Volume (Tons) Forecast by Function Type, 2020 to 2035
  • Table 49: Oceania Market Value (USD Million) Forecast by Country, 2020 to 2035
  • Table 50: Oceania Market Volume (Tons) Forecast by Country, 2020 to 2035
  • Table 51: Oceania Market Value (USD Million) Forecast by Material Type, 2020 to 2035
  • Table 52: Oceania Market Volume (Tons) Forecast by Material Type, 2020 to 2035
  • Table 53: Oceania Market Value (USD Million) Forecast by Product Type, 2020 to 2035
  • Table 54: Oceania Market Volume (Tons) Forecast by Product Type, 2020 to 2035
  • Table 55: Oceania Market Value (USD Million) Forecast by Function Type, 2020 to 2035
  • Table 56: Oceania Market Volume (Tons) Forecast by Function Type, 2020 to 2035
  • Table 57: MEA Market Value (USD Million) Forecast by Country, 2020 to 2035
  • Table 58: MEA Market Volume (Tons) Forecast by Country, 2020 to 2035
  • Table 59: MEA Market Value (USD Million) Forecast by Material Type, 2020 to 2035
  • Table 60: MEA Market Volume (Tons) Forecast by Material Type, 2020 to 2035
  • Table 61: MEA Market Value (USD Million) Forecast by Product Type, 2020 to 2035
  • Table 62: MEA Market Volume (Tons) Forecast by Product Type, 2020 to 2035
  • Table 63: MEA Market Value (USD Million) Forecast by Function Type, 2020 to 2035
  • Table 64: MEA Market Volume (Tons) Forecast by Function Type, 2020 to 2035

List of Figures

  • Figure 1: Global Market Value (USD Million) by Material Type, 2025 to 2035
  • Figure 2: Global Market Value (USD Million) by Product Type, 2025 to 2035
  • Figure 3: Global Market Value (USD Million) by Function Type, 2025 to 2035
  • Figure 4: Global Market Value (USD Million) by Region, 2025 to 2035
  • Figure 5: Global Market Value (USD Million) Analysis by Region, 2020 to 2035
  • Figure 6: Global Market Volume (Tons) Analysis by Region, 2020 to 2035
  • Figure 7: Global Market Value Share (%) and BPS Analysis by Region, 2025 to 2035
  • Figure 8: Global Market Y-o-Y Growth (%) Projections by Region, 2025 to 2035
  • Figure 9: Global Market Value (USD Million) Analysis by Material Type, 2020 to 2035
  • Figure 10: Global Market Volume (Tons) Analysis by Material Type, 2020 to 2035
  • Figure 11: Global Market Value Share (%) and BPS Analysis by Material Type, 2025 to 2035
  • Figure 12: Global Market Y-o-Y Growth (%) Projections by Material Type, 2025 to 2035
  • Figure 13: Global Market Value (USD Million) Analysis by Product Type, 2020 to 2035
  • Figure 14: Global Market Volume (Tons) Analysis by Product Type, 2020 to 2035
  • Figure 15: Global Market Value Share (%) and BPS Analysis by Product Type, 2025 to 2035
  • Figure 16: Global Market Y-o-Y Growth (%) Projections by Product Type, 2025 to 2035
  • Figure 17: Global Market Value (USD Million) Analysis by Function Type, 2020 to 2035
  • Figure 18: Global Market Volume (Tons) Analysis by Function Type, 2020 to 2035
  • Figure 19: Global Market Value Share (%) and BPS Analysis by Function Type, 2025 to 2035
  • Figure 20: Global Market Y-o-Y Growth (%) Projections by Function Type, 2025 to 2035
  • Figure 21: Global Market Attractiveness by Material Type, 2025 to 2035
  • Figure 22: Global Market Attractiveness by Product Type, 2025 to 2035
  • Figure 23: Global Market Attractiveness by Function Type, 2025 to 2035
  • Figure 24: Global Market Attractiveness by Region, 2025 to 2035
  • Figure 25: North America Market Value (USD Million) by Material Type, 2025 to 2035
  • Figure 26: North America Market Value (USD Million) by Product Type, 2025 to 2035
  • Figure 27: North America Market Value (USD Million) by Function Type, 2025 to 2035
  • Figure 28: North America Market Value (USD Million) by Country, 2025 to 2035
  • Figure 29: North America Market Value (USD Million) Analysis by Country, 2020 to 2035
  • Figure 30: North America Market Volume (Tons) Analysis by Country, 2020 to 2035
  • Figure 31: North America Market Value Share (%) and BPS Analysis by Country, 2025 to 2035
  • Figure 32: North America Market Y-o-Y Growth (%) Projections by Country, 2025 to 2035
  • Figure 33: North America Market Value (USD Million) Analysis by Material Type, 2020 to 2035
  • Figure 34: North America Market Volume (Tons) Analysis by Material Type, 2020 to 2035
  • Figure 35: North America Market Value Share (%) and BPS Analysis by Material Type, 2025 to 2035
  • Figure 36: North America Market Y-o-Y Growth (%) Projections by Material Type, 2025 to 2035
  • Figure 37: North America Market Value (USD Million) Analysis by Product Type, 2020 to 2035
  • Figure 38: North America Market Volume (Tons) Analysis by Product Type, 2020 to 2035
  • Figure 39: North America Market Value Share (%) and BPS Analysis by Product Type, 2025 to 2035
  • Figure 40: North America Market Y-o-Y Growth (%) Projections by Product Type, 2025 to 2035
  • Figure 41: North America Market Value (USD Million) Analysis by Function Type, 2020 to 2035
  • Figure 42: North America Market Volume (Tons) Analysis by Function Type, 2020 to 2035
  • Figure 43: North America Market Value Share (%) and BPS Analysis by Function Type, 2025 to 2035
  • Figure 44: North America Market Y-o-Y Growth (%) Projections by Function Type, 2025 to 2035
  • Figure 45: North America Market Attractiveness by Material Type, 2025 to 2035
  • Figure 46: North America Market Attractiveness by Product Type, 2025 to 2035
  • Figure 47: North America Market Attractiveness by Function Type, 2025 to 2035
  • Figure 48: North America Market Attractiveness by Country, 2025 to 2035
  • Figure 49: Latin America Market Value (USD Million) by Material Type, 2025 to 2035
  • Figure 50: Latin America Market Value (USD Million) by Product Type, 2025 to 2035
  • Figure 51: Latin America Market Value (USD Million) by Function Type, 2025 to 2035
  • Figure 52: Latin America Market Value (USD Million) by Country, 2025 to 2035
  • Figure 53: Latin America Market Value (USD Million) Analysis by Country, 2020 to 2035
  • Figure 54: Latin America Market Volume (Tons) Analysis by Country, 2020 to 2035
  • Figure 55: Latin America Market Value Share (%) and BPS Analysis by Country, 2025 to 2035
  • Figure 56: Latin America Market Y-o-Y Growth (%) Projections by Country, 2025 to 2035
  • Figure 57: Latin America Market Value (USD Million) Analysis by Material Type, 2020 to 2035
  • Figure 58: Latin America Market Volume (Tons) Analysis by Material Type, 2020 to 2035
  • Figure 59: Latin America Market Value Share (%) and BPS Analysis by Material Type, 2025 to 2035
  • Figure 60: Latin America Market Y-o-Y Growth (%) Projections by Material Type, 2025 to 2035
  • Figure 61: Latin America Market Value (USD Million) Analysis by Product Type, 2020 to 2035
  • Figure 62: Latin America Market Volume (Tons) Analysis by Product Type, 2020 to 2035
  • Figure 63: Latin America Market Value Share (%) and BPS Analysis by Product Type, 2025 to 2035
  • Figure 64: Latin America Market Y-o-Y Growth (%) Projections by Product Type, 2025 to 2035
  • Figure 65: Latin America Market Value (USD Million) Analysis by Function Type, 2020 to 2035
  • Figure 66: Latin America Market Volume (Tons) Analysis by Function Type, 2020 to 2035
  • Figure 67: Latin America Market Value Share (%) and BPS Analysis by Function Type, 2025 to 2035
  • Figure 68: Latin America Market Y-o-Y Growth (%) Projections by Function Type, 2025 to 2035
  • Figure 69: Latin America Market Attractiveness by Material Type, 2025 to 2035
  • Figure 70: Latin America Market Attractiveness by Product Type, 2025 to 2035
  • Figure 71: Latin America Market Attractiveness by Function Type, 2025 to 2035
  • Figure 72: Latin America Market Attractiveness by Country, 2025 to 2035
  • Figure 73: Europe Market Value (USD Million) by Material Type, 2025 to 2035
  • Figure 74: Europe Market Value (USD Million) by Product Type, 2025 to 2035
  • Figure 75: Europe Market Value (USD Million) by Function Type, 2025 to 2035
  • Figure 76: Europe Market Value (USD Million) by Country, 2025 to 2035
  • Figure 77: Europe Market Value (USD Million) Analysis by Country, 2020 to 2035
  • Figure 78: Europe Market Volume (Tons) Analysis by Country, 2020 to 2035
  • Figure 79: Europe Market Value Share (%) and BPS Analysis by Country, 2025 to 2035
  • Figure 80: Europe Market Y-o-Y Growth (%) Projections by Country, 2025 to 2035
  • Figure 81: Europe Market Value (USD Million) Analysis by Material Type, 2020 to 2035
  • Figure 82: Europe Market Volume (Tons) Analysis by Material Type, 2020 to 2035
  • Figure 83: Europe Market Value Share (%) and BPS Analysis by Material Type, 2025 to 2035
  • Figure 84: Europe Market Y-o-Y Growth (%) Projections by Material Type, 2025 to 2035
  • Figure 85: Europe Market Value (USD Million) Analysis by Product Type, 2020 to 2035
  • Figure 86: Europe Market Volume (Tons) Analysis by Product Type, 2020 to 2035
  • Figure 87: Europe Market Value Share (%) and BPS Analysis by Product Type, 2025 to 2035
  • Figure 88: Europe Market Y-o-Y Growth (%) Projections by Product Type, 2025 to 2035
  • Figure 89: Europe Market Value (USD Million) Analysis by Function Type, 2020 to 2035
  • Figure 90: Europe Market Volume (Tons) Analysis by Function Type, 2020 to 2035
  • Figure 91: Europe Market Value Share (%) and BPS Analysis by Function Type, 2025 to 2035
  • Figure 92: Europe Market Y-o-Y Growth (%) Projections by Function Type, 2025 to 2035
  • Figure 93: Europe Market Attractiveness by Material Type, 2025 to 2035
  • Figure 94: Europe Market Attractiveness by Product Type, 2025 to 2035
  • Figure 95: Europe Market Attractiveness by Function Type, 2025 to 2035
  • Figure 96: Europe Market Attractiveness by Country, 2025 to 2035
  • Figure 97: East Asia Market Value (USD Million) by Material Type, 2025 to 2035
  • Figure 98: East Asia Market Value (USD Million) by Product Type, 2025 to 2035
  • Figure 99: East Asia Market Value (USD Million) by Function Type, 2025 to 2035
  • Figure 100: East Asia Market Value (USD Million) by Country, 2025 to 2035
  • Figure 101: East Asia Market Value (USD Million) Analysis by Country, 2020 to 2035
  • Figure 102: East Asia Market Volume (Tons) Analysis by Country, 2020 to 2035
  • Figure 103: East Asia Market Value Share (%) and BPS Analysis by Country, 2025 to 2035
  • Figure 104: East Asia Market Y-o-Y Growth (%) Projections by Country, 2025 to 2035
  • Figure 105: East Asia Market Value (USD Million) Analysis by Material Type, 2020 to 2035
  • Figure 106: East Asia Market Volume (Tons) Analysis by Material Type, 2020 to 2035
  • Figure 107: East Asia Market Value Share (%) and BPS Analysis by Material Type, 2025 to 2035
  • Figure 108: East Asia Market Y-o-Y Growth (%) Projections by Material Type, 2025 to 2035
  • Figure 109: East Asia Market Value (USD Million) Analysis by Product Type, 2020 to 2035
  • Figure 110: East Asia Market Volume (Tons) Analysis by Product Type, 2020 to 2035
  • Figure 111: East Asia Market Value Share (%) and BPS Analysis by Product Type, 2025 to 2035
  • Figure 112: East Asia Market Y-o-Y Growth (%) Projections by Product Type, 2025 to 2035
  • Figure 113: East Asia Market Value (USD Million) Analysis by Function Type, 2020 to 2035
  • Figure 114: East Asia Market Volume (Tons) Analysis by Function Type, 2020 to 2035
  • Figure 115: East Asia Market Value Share (%) and BPS Analysis by Function Type, 2025 to 2035
  • Figure 116: East Asia Market Y-o-Y Growth (%) Projections by Function Type, 2025 to 2035
  • Figure 117: East Asia Market Attractiveness by Material Type, 2025 to 2035
  • Figure 118: East Asia Market Attractiveness by Product Type, 2025 to 2035
  • Figure 119: East Asia Market Attractiveness by Function Type, 2025 to 2035
  • Figure 120: East Asia Market Attractiveness by Country, 2025 to 2035
  • Figure 121: South Asia Market Value (USD Million) by Material Type, 2025 to 2035
  • Figure 122: South Asia Market Value (USD Million) by Product Type, 2025 to 2035
  • Figure 123: South Asia Market Value (USD Million) by Function Type, 2025 to 2035
  • Figure 124: South Asia Market Value (USD Million) by Country, 2025 to 2035
  • Figure 125: South Asia Market Value (USD Million) Analysis by Country, 2020 to 2035
  • Figure 126: South Asia Market Volume (Tons) Analysis by Country, 2020 to 2035
  • Figure 127: South Asia Market Value Share (%) and BPS Analysis by Country, 2025 to 2035
  • Figure 128: South Asia Market Y-o-Y Growth (%) Projections by Country, 2025 to 2035
  • Figure 129: South Asia Market Value (USD Million) Analysis by Material Type, 2020 to 2035
  • Figure 130: South Asia Market Volume (Tons) Analysis by Material Type, 2020 to 2035
  • Figure 131: South Asia Market Value Share (%) and BPS Analysis by Material Type, 2025 to 2035
  • Figure 132: South Asia Market Y-o-Y Growth (%) Projections by Material Type, 2025 to 2035
  • Figure 133: South Asia Market Value (USD Million) Analysis by Product Type, 2020 to 2035
  • Figure 134: South Asia Market Volume (Tons) Analysis by Product Type, 2020 to 2035
  • Figure 135: South Asia Market Value Share (%) and BPS Analysis by Product Type, 2025 to 2035
  • Figure 136: South Asia Market Y-o-Y Growth (%) Projections by Product Type, 2025 to 2035
  • Figure 137: South Asia Market Value (USD Million) Analysis by Function Type, 2020 to 2035
  • Figure 138: South Asia Market Volume (Tons) Analysis by Function Type, 2020 to 2035
  • Figure 139: South Asia Market Value Share (%) and BPS Analysis by Function Type, 2025 to 2035
  • Figure 140: South Asia Market Y-o-Y Growth (%) Projections by Function Type, 2025 to 2035
  • Figure 141: South Asia Market Attractiveness by Material Type, 2025 to 2035
  • Figure 142: South Asia Market Attractiveness by Product Type, 2025 to 2035
  • Figure 143: South Asia Market Attractiveness by Function Type, 2025 to 2035
  • Figure 144: South Asia Market Attractiveness by Country, 2025 to 2035
  • Figure 145: Oceania Market Value (USD Million) by Material Type, 2025 to 2035
  • Figure 146: Oceania Market Value (USD Million) by Product Type, 2025 to 2035
  • Figure 147: Oceania Market Value (USD Million) by Function Type, 2025 to 2035
  • Figure 148: Oceania Market Value (USD Million) by Country, 2025 to 2035
  • Figure 149: Oceania Market Value (USD Million) Analysis by Country, 2020 to 2035
  • Figure 150: Oceania Market Volume (Tons) Analysis by Country, 2020 to 2035
  • Figure 151: Oceania Market Value Share (%) and BPS Analysis by Country, 2025 to 2035
  • Figure 152: Oceania Market Y-o-Y Growth (%) Projections by Country, 2025 to 2035
  • Figure 153: Oceania Market Value (USD Million) Analysis by Material Type, 2020 to 2035
  • Figure 154: Oceania Market Volume (Tons) Analysis by Material Type, 2020 to 2035
  • Figure 155: Oceania Market Value Share (%) and BPS Analysis by Material Type, 2025 to 2035
  • Figure 156: Oceania Market Y-o-Y Growth (%) Projections by Material Type, 2025 to 2035
  • Figure 157: Oceania Market Value (USD Million) Analysis by Product Type, 2020 to 2035
  • Figure 158: Oceania Market Volume (Tons) Analysis by Product Type, 2020 to 2035
  • Figure 159: Oceania Market Value Share (%) and BPS Analysis by Product Type, 2025 to 2035
  • Figure 160: Oceania Market Y-o-Y Growth (%) Projections by Product Type, 2025 to 2035
  • Figure 161: Oceania Market Value (USD Million) Analysis by Function Type, 2020 to 2035
  • Figure 162: Oceania Market Volume (Tons) Analysis by Function Type, 2020 to 2035
  • Figure 163: Oceania Market Value Share (%) and BPS Analysis by Function Type, 2025 to 2035
  • Figure 164: Oceania Market Y-o-Y Growth (%) Projections by Function Type, 2025 to 2035
  • Figure 165: Oceania Market Attractiveness by Material Type, 2025 to 2035
  • Figure 166: Oceania Market Attractiveness by Product Type, 2025 to 2035
  • Figure 167: Oceania Market Attractiveness by Function Type, 2025 to 2035
  • Figure 168: Oceania Market Attractiveness by Country, 2025 to 2035
  • Figure 169: MEA Market Value (USD Million) by Material Type, 2025 to 2035
  • Figure 170: MEA Market Value (USD Million) by Product Type, 2025 to 2035
  • Figure 171: MEA Market Value (USD Million) by Function Type, 2025 to 2035
  • Figure 172: MEA Market Value (USD Million) by Country, 2025 to 2035
  • Figure 173: MEA Market Value (USD Million) Analysis by Country, 2020 to 2035
  • Figure 174: MEA Market Volume (Tons) Analysis by Country, 2020 to 2035
  • Figure 175: MEA Market Value Share (%) and BPS Analysis by Country, 2025 to 2035
  • Figure 176: MEA Market Y-o-Y Growth (%) Projections by Country, 2025 to 2035
  • Figure 177: MEA Market Value (USD Million) Analysis by Material Type, 2020 to 2035
  • Figure 178: MEA Market Volume (Tons) Analysis by Material Type, 2020 to 2035
  • Figure 179: MEA Market Value Share (%) and BPS Analysis by Material Type, 2025 to 2035
  • Figure 180: MEA Market Y-o-Y Growth (%) Projections by Material Type, 2025 to 2035
  • Figure 181: MEA Market Value (USD Million) Analysis by Product Type, 2020 to 2035
  • Figure 182: MEA Market Volume (Tons) Analysis by Product Type, 2020 to 2035
  • Figure 183: MEA Market Value Share (%) and BPS Analysis by Product Type, 2025 to 2035
  • Figure 184: MEA Market Y-o-Y Growth (%) Projections by Product Type, 2025 to 2035
  • Figure 185: MEA Market Value (USD Million) Analysis by Function Type, 2020 to 2035
  • Figure 186: MEA Market Volume (Tons) Analysis by Function Type, 2020 to 2035
  • Figure 187: MEA Market Value Share (%) and BPS Analysis by Function Type, 2025 to 2035
  • Figure 188: MEA Market Y-o-Y Growth (%) Projections by Function Type, 2025 to 2035
  • Figure 189: MEA Market Attractiveness by Material Type, 2025 to 2035
  • Figure 190: MEA Market Attractiveness by Product Type, 2025 to 2035
  • Figure 191: MEA Market Attractiveness by Function Type, 2025 to 2035
  • Figure 192: MEA Market Attractiveness by Country, 2025 to 2035

Frequently Asked Questions

What is the future of protective packaging industry?

The protective packaging industry is projected to witness CAGR of 4.7% between 2025 and 2035.

What was the worth of the protective packaging industry in 2024?

The global protective packaging industry stood at USD 29.1 billion in 2024.

What will the worth of global protective packaging industry by 2035 end?

Global protective packaging industry is anticipated to reach USD 47.6 billion by 2035 end.

Which region to showcase the highest CAGR during forecast period?

South Asia & Pacific is set to record a CAGR of 6.1% in assessment period.

Who are the key players of global protective packaging industry?

The key players operating in the protective packaging industry are Sealed Air Corporation, Sonoco Products Company, Smurfit Westrock and DS Smith plc.

Explore Similar Insights

Future Market Insights

Protective Packaging Market