

- Market Size (2026)
- USD 520.6 Mn
- Forecast (2036)
- USD 1451.8 Mn
- CAGR (2026 to 2036)
- 10.8%
How big is the PVC Dechlorination Additives Market in 2026?
USD 520.6 million in 2026 and USD 1,451.8 million by 2036 at a 10.8% CAGR.
Demand for PVC dechlorination additives is projected to expand at 10.8% CAGR between 2026 and 2036, increasing valuation from USD 520.6 million in 2026 to USD 1,451.8 million by 2036. Chemical recycling plants need tighter chloride control before mixed-plastic pyrolysis oil enters hydrotreating or cracker-feed preparation. VinylPlus reported in May 2026 that 765,972 tonnes of PVC waste were recycled within its framework during 2025. The recovery volume keeps pretreatment chemistry visible because mixed feedstock often carries PVC into thermal systems. Demand for chemical recycling services is expected to reinforce trials for additives that capture acid gases before equipment damage or oil rejection occurs. Chloride control before thermal recycling is expected to shape additive demand across mixed-plastic and PVC-rich feedstock processing.
China and India are projected to favor additive systems that tolerate variable chlorine loads because collection networks feed plants with mixed post-consumer material. Accounts in the United States and Germany are expected to stress chemical records and residue handling before approval. Plant engineers are estimated to compare chloride reduction against ash generation and oil specifications during qualification trials. In October 2025, Eurostat reported 35.3 kg of plastic packaging waste per person across the EU during 2023. The waste load keeps difficult streams in treatment discussions after mechanical sorting removes easier material fractions. Interest in waste-derived pyrolysis oil is forecast to increase attention on feed preparation before upgrading. Procurement teams are anticipated to compare dosage windows and corrosion evidence before adding chemistry to plant recipes. Repeat orders are estimated after operators trace chlorine reduction across lots and confirm residue handling.
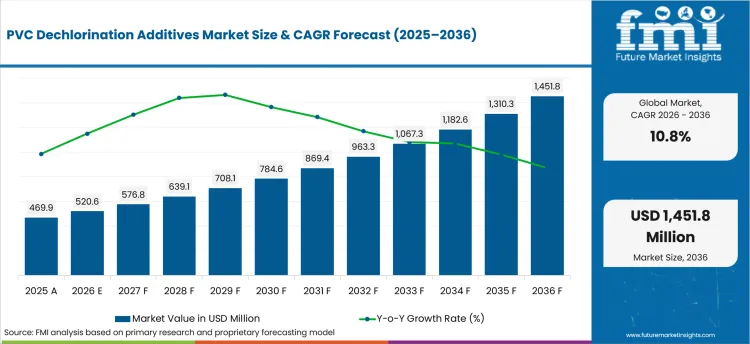
| Metric | Value |
|---|---|
| 2025 Market Size | USD 469.9 million |
| 2026 Market Size | USD 520.6 million |
| 2036 Market Size | USD 1,451.8 million |
| Forecast CAGR (2026-2036) | 10.8% |
| Additive Type Focus | Alkaline Dechlorination Agents |
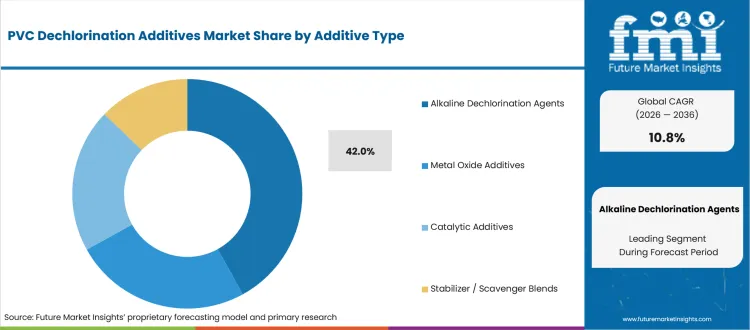
| Alkaline Dechlorination Agents Share (2026) | 42.0% |
| Process Focus | Thermochemical Dechlorination |
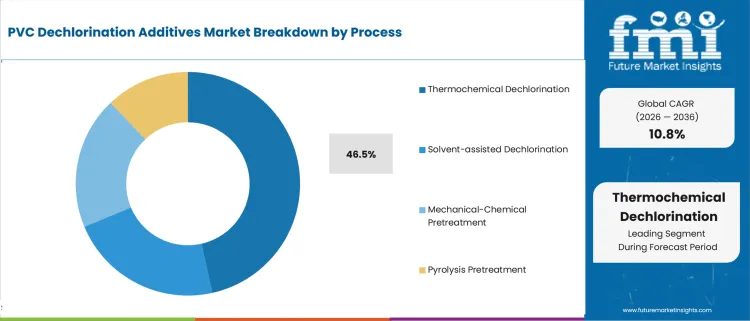
| Thermochemical Dechlorination Share (2026) | 46.5% |
| End Use Focus | Chemical Recycling Plants |
| Chemical Recycling Plants Share (2026) | 45.0% |
| Fastest-growing Country | China |
| China CAGR by 2036 | 12.4% |
Summary of the PVC Dechlorination Additives Market
| Market Signal | Commercial Impact |
|---|---|
| Demand and Growth Drivers | Mixed-plastic thermal conversion creates a direct need for chloride capture before oil upgrading and corrosion-sensitive treatment stages. Plant operators compare treatment performance with the cost of handling spent residue.
|
| Product and Segment View | Alkaline agents and thermochemical pretreatment define the product and process view for early chlorine-control trials. Chemical recycling plants are anticipated to keep qualification work centered on chloride reduction and residue control.
|
| Geography and Growth Outlook | Country growth is forecast to separate markets by collection scale and approval discipline. Asian recycling systems create more mixed-feedstock trials while Western accounts place greater weight on documentation and residue acceptance.
|
| Competitive Landscape | Competition centers on PVC chemistry depth and evidence from plant trials. Companies separate through acid-scavenging fit and formulation support during qualification. Residue knowledge and service reach shape account reviews.
|
| Analyst Perspective | Residue economics separates successful chlorine capture from chemistry that survives a commercial plant trial. An additive that lowers chloride but creates excessive spent solids fails before price negotiation begins.
- Nikhil Kaitwade, Principal Consultant at Future Market Insights |
Source: FMI's proprietary forecasting model and primary research
How is the PVC dechlorination additives market segmented?
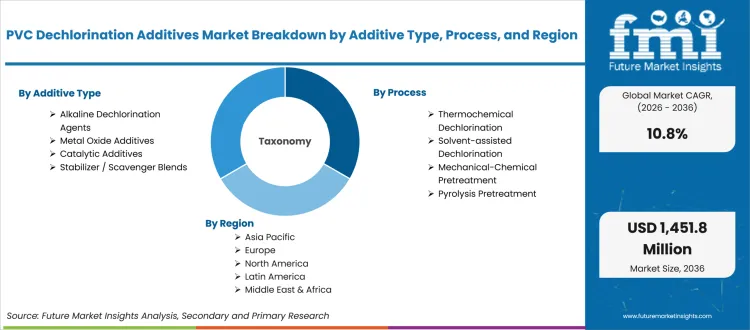
The PVC dechlorination additives industry is segmented by additive type, process, feedstock, end use, sales channel, and region.
The PVC dechlorination additives market is segmented by additive type, process, feedstock, end use, sales channel, and region. Additive type covers alkaline dechlorination agents, metal oxide additives, catalytic additives, and stabilizer or scavenger blends. Process includes thermochemical dechlorination, solvent-assisted dechlorination, mechanical-chemical pretreatment, and pyrolysis pretreatment for chlorine control before thermal conversion. Feedstock includes rigid PVC, flexible PVC, mixed PVC-containing waste, and cable scrap from recovery operations. End use covers chemical recycling plants, waste processors, cable recyclers, and polymer compounders that need controlled chlorine loads. Sales channels include direct supply, distributors, and process-bundled supply for different levels of technical support. EPA’s January 2025 vinyl chloride scope included recycling among processing conditions considered during risk evaluation work. Regional coverage connects the structure with packaging waste recovery and difficult-plastic treatment routes across regions.
How does alkaline dechlorination chemistry shape demand within the additive type category?
PVC releases hydrogen chloride during thermal breakdown, so plant teams need chemistry that captures acid before vulnerable equipment is exposed. Operators still need trial evidence because neutralization efficiency and residue volume move together during dosage changes.
- Based on additive type, alkaline dechlorination agents are projected to account for 42.0% in 2026 due to familiar neutralization pathways and simple dosage adjustment during early plant trials.
- Alkaline agents are drawing demand from chemical recycling plant engineers owing to visible chloride reduction before testing more complex catalytic options.
What drives thermochemical dechlorination within the process category?
Pyrolysis plants follow a clear sequence because feed preparation comes before thermal conversion and oil upgrading. VinylPlus reported in June 2026 that bench-scale trials during 2025 found Arcus pyrolysis technology viable for flexible PVC waste containing lead. The result puts chlorine management inside feed preparation because flexible PVC enters the reactor with chlorine and legacy additives. Thermochemical pretreatment is anticipated to fit projects that already control heat and residence time before material reaches the main reactor.
- By process, thermochemical dechlorination is estimated to hold 46.5% in 2026 owing to its fit with heated pretreatment before pyrolysis oil recovery. In May 2026, VinylPlus reported that post-consumer waste accounted for 41.2% of PVC recycled within its 2025 framework. The mixed input gives pretreatment a clear role because operators need contamination control before final conversion.
- Demand for thermochemical dechlorination is projected to grow among pyrolysis operators because oil upgrading units require lower chloride at the inlet.
How is mixed PVC-containing waste positioned within the feedstock category?
Mixed waste reaches treatment plants after collection and sorting systems have removed obvious materials, yet small PVC fragments often remain inside broader plastic streams. In July 2025, the OECD reported that Southeast and East Asia generated 113 Mt of plastic waste during 2022. The regional waste scale creates many treatment routes where feedstock identity remains incomplete before processing begins. Additive trials therefore start with chlorine-load mapping before operators establish a stable dosage window for each recurring feedstock type.
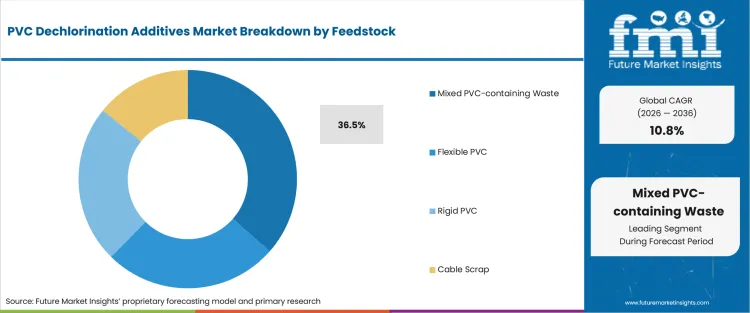
- In 2026, mixed PVC-containing waste is expected to lead the feedstock category with 36.5% share because mechanical sorting does not remove every chlorinated fragment. In October 2025, Eurostat reported that 14.8 kg of plastic packaging waste per person was recycled across the EU during 2023. The recovery gap keeps mixed-stream treatment relevant when recyclers pursue material beyond clean mono-material inputs.
- Waste processors test treatment blends when chlorine load changes between batches and polymer origin is uncertain. In January 2025, Shanghai set a target of 160 recyclables transfer stations and collecting yards under its municipal recycling scheme. Broader collection is forecast to increase the need for circular feedstock traceability because treatment chemistry depends on knowing where PVC contamination enters each lot.
What supports chemical recycling plants within the end use category?
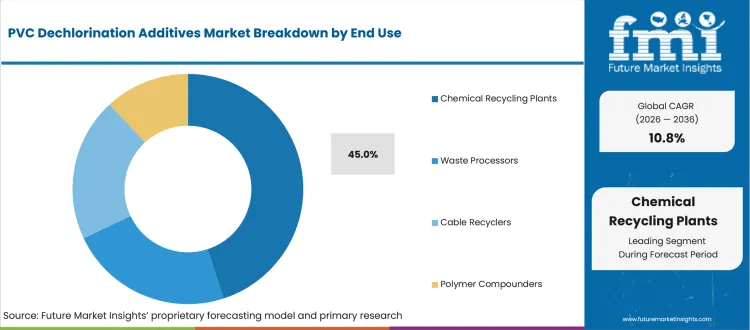
A chemical recycling plant carries chlorine risk from receiving inspection through oil upgrading, so additive choices affect maintenance and product acceptance. Additive suppliers are expected to be judged across the full route from chloride capture to oil specification.
- By end use, chemical recycling plants are estimated to represent 45.0% in 2026 driven by oil-quality limits and corrosion control. VinylPlus’s May 2026 report recorded 508,109 tonnes of recycled PVC uptake in RecoTrace during 2025. The reported uptake shows established mechanical outlets for recycled PVC across converter applications and product categories. Chemical treatment remains relevant for streams that cannot enter those routes without further processing or cleanup.
- Formulation teams serving chemical recycling plants link additive dosage with oil quality and spent residue.
How does direct supply influence purchasing within the sales channel category?
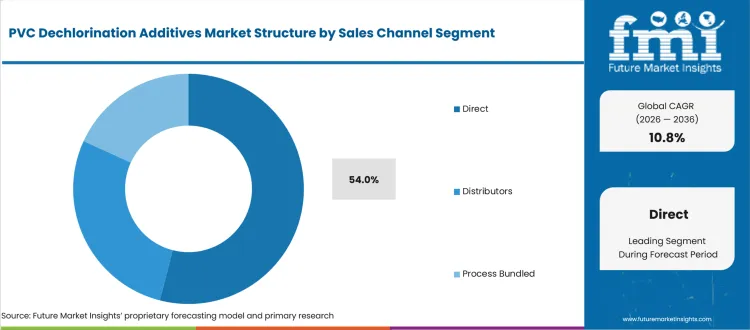
Dechlorination additives are not purchased like standard warehouse chemicals because plant recipes change with feedstock chlorine load and residue limits. Direct contact remains central when suppliers adjust dosage during qualification and explain the effect on plant waste handling.
- Direct supply is forecast to represent 54.0% of the sales channel category in 2026 because plant trials need repeated dosage review. Regional distribution remains useful for routine supply while complex recycling qualifications still need clear technical ownership.
- Purchase activity for direct supply is anticipated to rise because plant engineers need support during corrosion checks and residue review. Direct discussions complement distributors when recyclers compare odor-scavenging masterbatches and other treatment additives within recycled-plastic quality programs.
What are the drivers, restraints, and opportunities in the PVC dechlorination additives market?
Near-term purchases are projected to reflect chloride-sensitive pyrolysis feed and residue handling costs. Flexible PVC recovery routes are anticipated to create the opportunity outlined below.
- Driver: Chemical recycling operators are expected to test dechlorination additives before mixed-plastic oil enters corrosion-sensitive upgrading equipment.
- Restraint: Residue disposal costs are projected to slow adoption when higher neutralizer dosage creates more spent solids than a plant handles economically.
- Opportunity: Cable scrap recyclers are anticipated to open new trials for blends that manage plasticizer-rich flexible PVC after metal recovery.
Chemical recycling operators are expected to add pretreatment steps because chloride damages reactors and weakens oil acceptance during upgrading. In May 2026, VinylPlus reported that converter uptake of recycled PVC increased by 3.6% during 2025 compared with 2024. The increase is estimated to bring more difficult PVC streams into formal recovery systems and converter quality checks. Additive formulators are forecast to gain trial access when they measure chloride reduction alongside residue volume and explain both results to plant engineers.
Residue handling creates a commercial restraint because an additive solves one plant problem but increases another disposal burden. In May 2026, EPA described a March proposal addressing how pyrolysis and combustion units fit Clean Air Act rules. The regulatory work keeps documentation pressure visible for USA operators currently handling PVC-containing material. Plant managers are estimated to delay approval when suppliers cannot explain spent solids or show stable dosage windows across feedstock changes.
Cable scrap creates an opportunity because recovered copper leaves a flexible PVC fraction with clearer origin than many mixed household streams. VinylPlus reported in July 2025 that cables represented 92,478 tonnes of PVC recycled during 2024. The recorded stream gives formulators a defined commercial feedstock route for trials after metal recovery. Dechlorination suppliers are forecast to gain trial access when dosage evidence fits plasticizer-rich insulation and recycling feedstock hubs that sort and pool material before treatment.
Which country growth outlooks are profiled in the PVC dechlorination additives market?
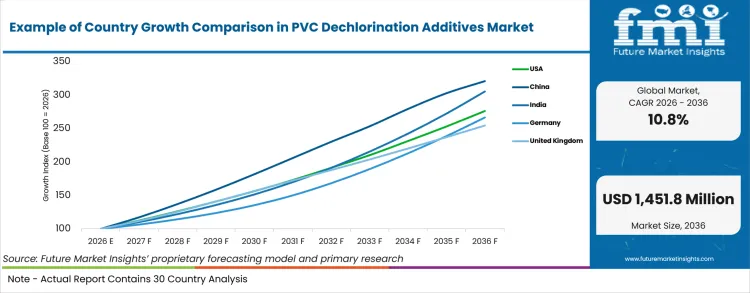
| Country | Growth outlook |
|---|---|
| United States | Steady expansion |
| China | Higher-growth outlook |
| India | High-growth outlook |
| Germany | Steady expansion |
| United Kingdom | Measured expansion |
| Japan | Steady expansion |
| South Korea | Above-average expansion |
Source: FMI's proprietary forecasting model and primary research
How do country-level CAGRs compare in the PVC dechlorination additives market?
Country growth is expected to reflect collection depth and the quality controls applied before thermal conversion. India and China are projected to create more mixed-feedstock trials as formal recovery networks expand. Operators in the United States and Europe place heavier weight on chemical records and residue handling. In June 2025, the United Nations Environment Programme placed global plastics consumption at 516 million tonnes for 2025. The consumption scale is estimated to keep difficult streams moving through waste recycling services before higher-value thermal recovery.
- EPA’s January 2025 vinyl chloride review gives USA projects a clear regulatory frame for processing and disposal decisions. United States demand is forecast to rise at 10.7% CAGR over the forecast period due to trial-heavy approvals and corrosion-control requirements. EPA placed national vinyl chloride production at 10 billion to less than 20 billion lb per year in its January 2025 use report. The production base keeps vinyl chloride exposure and disposal pathways under review when recycling projects handle PVC-containing feedstock. Plant engineers compare chloride reduction against residue cost before an operator approves repeat additive supply.
- Shanghai has tied recycling infrastructure to traceable material flows and dedicated processing bases under its municipal waste-recycling scheme. Plant operators face broader feedstock variation as collection reaches more neighborhoods and industrial sources within Shanghai’s formal system. China is expected to post 12.4% CAGR over the forecast period because municipal collection scale and local PVC additive production create repeated treatment trials. Shanghai set a 2025 waste-plastics recovery target of 700,000 tonnes per year in January 2025. Suppliers gain trial access by showing dosage control across changing chlorine loads instead of relying on one laboratory recipe.
- India’s EPR portal has created a visible pool of registered processors and clearer accountability for plastic waste handling. The country’s PVC dechlorination additives outlook is anticipated to advance at 11.8% CAGR over the assessment period due to formal recycling activity. The Press Information Bureau reported 3,012 registered plastic waste processors on the centralized EPR portal in March 2026. Processors favor additives that arrive with simple dosage plans because mixed waste varies across collection routes. Formal registration favors suppliers that provide repeatable chlorine-control trial methods for uneven feedstock at registered plants.
- Germany combines established recycling systems with detailed documentation expectations for additives and waste outputs entering formal treatment routes. Plant teams compare chloride capture against solids handling before approving commercial quantities across repeated feedstock lots. Adoption of PVC dechlorination additives in Germany is projected to expand at 10.3% CAGR through 2036 because plant approvals depend on detailed chemical records. In October 2025, Eurostat recorded a 52.2% plastic packaging recycling rate for Germany during 2023. The established recovery base directs more attention toward difficult fractions that still need chemical pretreatment. Companies with local application teams compete on trial design and evidence that fits German waste-management routes.
- The United Kingdom entered packaging EPR implementation during 2025 and now has more direct reporting pressure around supplied packaging material. The United Kingdom PVC dechlorination additives sector is anticipated to record 9.8% CAGR during the assessment period because established recyclers require residue evidence before plant approval. In July 2025, Defra placed the provisional plastic packaging recycling rate at 53.7% for 2024 under its methodology 2. The recycling channel values treatment chemistry that documents residue behavior before wider commercial plant use. Direct technical support carries an advantage where plants run smaller batches and need rapid formulation adjustment.
- Plant engineers examine chemical purity and residue handling before expanding additive use across repeated production lots. The USA International Trade Administration reported Japan’s 25,000-ton recycled-plastics target for automotive applications by 2031 in August 2025. PVC dechlorination additive demand in Japan is forecast to rise at 10.5% CAGR over the forecast period due to quality-sensitive recovery routes. Japanese accounts favor suppliers that provide precise formulation evidence and stable local service across qualification cycles and repeat orders.
- South Korea’s recycled-material policy is moving obligations from raw-material producers toward more final-product users and additional plastic applications. South Korea is estimated to post 11.1% CAGR over the forecast period due to recycling targets and local chemical capability. In February 2025, the Ministry of Environment raised the recycled raw-material target obligation for designated producers to 10%. Recycling operators value technical response that links feedstock analysis with dosage changes during qualification work. Policy expansion gives local formulation knowledge greater weight across additional plastic applications at local plants.
PVC Dechlorination Additives Market - Report Scope
| Coverage field | Report scope |
|---|---|
| Market breakdown | PVC Dechlorination Additives Market Breakdown By Additive Type, Process, Feedstock, End Use, Sales Channel, and Region |
| Quantitative Units | USD Million |
| Market Definition | PVC dechlorination additives are chemical agents or formulated blends used to capture and neutralize chlorine from PVC-containing feedstock before or during recycling pretreatment and thermal conversion. |
| Regions Covered | North America, Latin America, Western Europe, Eastern Europe, East Asia, South Asia and Pacific, and Middle East and Africa |
| Countries Covered | United States, China, India, Germany, United Kingdom, Japan, South Korea, and additional covered countries |
| Forecast Period | 2026 to 2036 |
| Approach | Hybrid bottom-up and macro-to-micro methodology linking PVC waste availability with thermal recycling activity across feedstocks. Plant qualification routes and country-level recycling indicators complete the approach for national forecast adjustment. |
Source: Future Market Insights - analysis driven by proprietary forecasting models and primary research
PVC Dechlorination Additives Market - Research Methodology
| Method | Approach |
|---|---|
| Primary Research | FMI analysts interviewed chemical recycling operators and waste processors that handle mixed plastics or PVC-containing feedstock. Cable recyclers and polymer compounders were included alongside plant engineers and technical sales teams. Discussion guides covered chlorine-load variation and dosage control before residue handling or corrosion review. Responses were compared across plant scale and feedstock type. Interview findings were then reconciled before forecast assumptions were set. |
| Desk Research | Desk research covered official waste datasets and regulator documents that define collection conditions or chemical review requirements. Trade-body publications were reviewed alongside company newsrooms and financial presentations for current operating context. Company sources were checked for direct PVC stabilizer or acid-scavenger relevance before entering the evidence base. |
| Market Sizing and Forecasting | Market sizing used a hybrid bottom-up and macro-to-micro model that linked PVC-containing waste streams with treatment intensity and additive dosage. Inputs covered chemical-recycling project activity and mixed-plastic feed availability across the profiled processing routes. Cable scrap handling was assessed beside process choice and direct-sales support requirements during plant qualification. |
| Data Validation | Forecasts were checked against official recycling records and regulator evidence describing collection or processing conditions. Trade-body data and company capability records provided validation points for feedstock and additive relevance. Analysts compared disclosed segment shares with processing logic and tested company relevance against current official sources. |
Source: Future Market Insights (FMI) analysis, based on proprietary forecasting model and primary research
PVC Dechlorination Additives Market by Segments
PVC Dechlorination Additives Market segmented by Additive Type:
- Alkaline Dechlorination Agents
- Metal Oxide Additives
- Catalytic Additives
- Stabilizer / Scavenger Blends
PVC Dechlorination Additives Market segmented by Process:
- Thermochemical Dechlorination
- Solvent-assisted Dechlorination
- Mechanical-Chemical Pretreatment
- Pyrolysis Pretreatment
PVC Dechlorination Additives Market segmented by Feedstock:
- Rigid PVC
- Flexible PVC
- Mixed PVC-containing Waste
- Cable Scrap
PVC Dechlorination Additives Market segmented by End Use:
- Chemical Recycling Plants
- Waste Processors
- Cable Recyclers
- Polymer Compounders
PVC Dechlorination Additives Market segmented by Sales Channel:
- Direct
- Distributors
- Process Bundled
PVC Dechlorination Additives Market by Region:
- North America
- United States
- Canada
- Latin America
- Brazil
- Mexico
- Chile
- Rest of Latin America
- Western Europe
- Germany
- United Kingdom
- Italy
- Spain
- France
- Nordic
- BENELUX
- Rest of Western Europe
- Eastern Europe
- Russia
- Poland
- Hungary
- Balkan & Baltic
- Rest of Eastern Europe
- East Asia
- China
- Japan
- South Korea
- South Asia and Pacific
- India
- ASEAN
- Australia & New Zealand
- Rest of South Asia and Pacific
- Middle East & Africa
- Kingdom of Saudi Arabia
- Other GCC Countries
- Türkiye
- South Africa
- Other African Union
- Rest of Middle East & Africa
Research Sources and Bibliography
- Department for Environment, Food and Rural Affairs. (2025, July). UK statistics on waste. UK Government.
- Eurostat. (2025, October). Packaging waste statistics. European Commission.
- Eurostat. (2025, October). Plastic packaging waste in the EU: 35.3 kg per person. European Commission.
- Eurostat. (2026, January). Municipal waste statistics. European Commission.
- Ministry of Environment of the Republic of Korea. (2025, February). Full-scale Use of Recycled Materials in Bottled Water and Beverage PET Bottles. Ministry of Environment.
- Organisation for Economic Co-operation and Development. (2025, July). Regional Plastics Outlook for Southeast and East Asia. OECD.
- Press Information Bureau. (2026, March). PARLIAMENT QUESTION: Plastic Waste Management. Government of India.
- Shanghai Municipal People’s Government. (2025, January). Implementation Scheme of Shanghai Municipality for Building a Demonstration City with a Waste Recycling System. Shanghai Municipal People’s Government.
- United Nations Environment Programme. (2025, June). UNEP helps tackle waste in Kazakh mountains as plastic pollution hits new highs. United Nations Environment Programme.
- USA Environmental Protection Agency. (2025, January). Draft Scope of the Risk Evaluation for Vinyl Chloride. USA Environmental Protection Agency.
- USA Environmental Protection Agency. (2025, January). Use Report for Vinyl Chloride (CAS RN 75-01-4). USA Environmental Protection Agency.
- USA Environmental Protection Agency. (2026, May). Advanced Recycling of Plastics. USA Environmental Protection Agency.
- USA International Trade Administration. (2025, August). Japan Recycled Plastic Materials. USA Department of Commerce.
- VinylPlus. (2025, May). Progress Report 2025. VinylPlus.
- VinylPlus. (2025, July). The European PVC industry’s commitment to sustainable development: Our roadmap towards 2030. VinylPlus.
- VinylPlus. (2026, May). Progress Report 2026. VinylPlus.
- VinylPlus. (2026, June). VinylPlus at a Glance 2026. VinylPlus.
This bibliography is provided for reader reference and uses primary government, standards-body, official trade body, and company sources.
This Report Answers
- What is the projected value of the PVC dechlorination additives market in 2026 and 2036?
- What CAGR is the PVC dechlorination additives market expected to record from 2026 to 2036?
- Which subsegments are projected to shape demand across each parent category?
- Which chloride-control pressures are expected to support additive trials and repeat purchases at recycling plants?
- How are country CAGRs projected to differ across the profiled countries?
- Which companies compete on PVC chemistry relevance and acid-scavenger fit across recycling workflows?
- What evidence should buyers request when qualifying PVC dechlorination additives?
- What should plant engineers and procurement teams address before broader sourcing commitments or multi-feedstock expansion?
- How are chemical records and residue documentation expected to affect supplier selection under regulatory review?
Frequently Asked Questions
What is driving growth in the PVC Dechlorination Additives Market?
Growth is expected to be driven by chloride control before thermal recycling. Mixed-plastic feedstocks and cable scrap are projected to expand additive trials.
Who are the key players in the PVC Dechlorination Additives Market?
Notable companies include Baerlocher, Valtris Specialty Chemicals, Reagens, Akdeniz Chemson, and SONGWON. Competition is projected to center on PVC chemistry and plant-trial support.
What is a significant restraint in the PVC Dechlorination Additives Market?
A significant restraint is spent residue created during neutralization. Adoption is anticipated to slow when disposal costs offset gains from lower chloride exposure.
Which additive types are expected to receive the most attention?
Alkaline dechlorination agents are expected to receive early attention because operators understand their neutralization behavior. Metal oxide and scavenger blends remain relevant for specialized treatment needs.
Why are chemical recycling plants important end users?
Chemical recycling plants need controlled chlorine levels before pyrolysis oil enters upgrading steps. Additive demand is projected to depend on corrosion control and output acceptance.
How does feedstock variability affect additive selection?
Mixed waste can carry uneven PVC contamination across different batches. Plant teams are expected to adjust dosage after checking chlorine load and residue behavior.
Why is direct supplier support relevant during procurement?
Direct support helps plant engineers adjust dosage during qualification trials and feedstock changes. Procurement teams are projected to value suppliers that explain chloride reduction and residue handling together.
What opportunity is emerging from cable scrap recycling?
Cable scrap creates a focused route for treating flexible PVC insulation after metal recovery. Demand is anticipated to favor additives that manage plasticizer-rich feedstock and variable chlorine release.
Preview the report firsthand - request a free sample
Get SampleGet the brochure for pricing and purchase details.
Get PDFTable of Content
- Key Takeaways
- Market Size and CAGR
- Top Growth Driver
- Fastest Growing Segment
- Leading Region
- Key Companies
- Emerging Opportunities
- Executive Summary
- Global Market Outlook
- Demand-side Trends
- Supply-side Trends
- Technology Roadmap Analysis
- Analysis and Recommendations
- Analyst Perspective (What is happening? Why now? What should investors know?)
- Key Questions Answered
- How large is the market?
- What is the CAGR?
- What are key trends?
- Which region dominates?
- Who are the leaders?
- Market Overview
- Market Coverage / Taxonomy
- Market Definition / Scope / Limitations
- Research Methodology
- Chapter Orientation
- Analytical Lens and Working Hypotheses
- Market Structure, Signals, and Trend Drivers
- Benchmarking and Cross-market Comparability
- Market Sizing, Forecasting, and Opportunity Mapping
- Research Design and Evidence Framework
- Desk Research Programme (Secondary Evidence)
- Expert Input and Fieldwork (Primary Evidence)
- Tooling, Models, and Reference Databases
- Data Engineering and Model Build
- Quality Assurance and Audit Trail
- Market Background
- Market Dynamics (Drivers, Restraints, Opportunity, Trends)
- Scenario Forecast (Optimistic, Likely, Conservative)
- Impact Analysis
- AI Impact
- Sustainability Impact
- Regulatory Impact
- Technology Impact
- Consumer / Buyer Analysis
- Purchase Drivers
- Adoption Barriers
- Buyer Journey
- Opportunity Map Analysis
- Product Life Cycle Analysis
- Supply Chain Analysis
- Investment Feasibility Matrix
- Value Chain Analysis
- PESTLE and Porter's Analysis
- Regulatory Landscape
- Regional Parent Market Outlook
- Production and Consumption Statistics
- Import and Export Statistics
- Global Market Analysis and Forecast, 2021 to 2036
- Historical Market Size Value (USD Million) Analysis, 2021 to 2025
- Current and Future Market Size Value (USD Million) Projections, 2026 to 2036
- Y-o-Y Growth Trend Analysis
- Absolute $ Opportunity Analysis
- Global Market Pricing Analysis, 2021 to 2036
- Global Market Analysis and Forecast, By Additive Type, 2021 to 2036
- Introduction / Key Findings
- Historical Market Size Value (USD Million) Analysis By Additive Type, 2021 to 2025
- Current and Future Market Size Value (USD Million) Analysis and Forecast By Additive Type, 2026 to 2036
- Alkaline Dechlorination Agents
- Metal Oxide Additives
- Catalytic Additives
- Stabilizer / Scavenger Blends
- Alkaline Dechlorination Agents
- Y-o-Y Growth Trend Analysis By Additive Type, 2021 to 2025
- Absolute $ Opportunity Analysis By Additive Type, 2026 to 2036
- Global Market Analysis and Forecast, By Process, 2021 to 2036
- Introduction / Key Findings
- Historical Market Size Value (USD Million) Analysis By Process, 2021 to 2025
- Current and Future Market Size Value (USD Million) Analysis and Forecast By Process, 2026 to 2036
- Thermochemical Dechlorination
- Solvent-assisted Dechlorination
- Mechanical-Chemical Pretreatment
- Pyrolysis Pretreatment
- Thermochemical Dechlorination
- Y-o-Y Growth Trend Analysis By Process, 2021 to 2025
- Absolute $ Opportunity Analysis By Process, 2026 to 2036
- Global Market Analysis and Forecast, By Feedstock, 2021 to 2036
- Introduction / Key Findings
- Historical Market Size Value (USD Million) Analysis By Feedstock, 2021 to 2025
- Current and Future Market Size Value (USD Million) Analysis and Forecast By Feedstock, 2026 to 2036
- Mixed PVC-containing Waste
- Flexible PVC
- Rigid PVC
- Cable Scrap
- Mixed PVC-containing Waste
- Y-o-Y Growth Trend Analysis By Feedstock, 2021 to 2025
- Absolute $ Opportunity Analysis By Feedstock, 2026 to 2036
- Global Market Analysis and Forecast, By End Use, 2021 to 2036
- Introduction / Key Findings
- Historical Market Size Value (USD Million) Analysis By End Use, 2021 to 2025
- Current and Future Market Size Value (USD Million) Analysis and Forecast By End Use, 2026 to 2036
- Chemical Recycling Plants
- Waste Processors
- Cable Recyclers
- Polymer Compounders
- Chemical Recycling Plants
- Y-o-Y Growth Trend Analysis By End Use, 2021 to 2025
- Absolute $ Opportunity Analysis By End Use, 2026 to 2036
- Global Market Analysis and Forecast, By Sales Channel, 2021 to 2036
- Introduction / Key Findings
- Historical Market Size Value (USD Million) Analysis By Sales Channel, 2021 to 2025
- Current and Future Market Size Value (USD Million) Analysis and Forecast By Sales Channel, 2026 to 2036
- Direct
- Distributors
- Process Bundled
- Direct
- Y-o-Y Growth Trend Analysis By Sales Channel, 2021 to 2025
- Absolute $ Opportunity Analysis By Sales Channel, 2026 to 2036
- Global Market Analysis and Forecast, By Region, 2021 to 2036
- Introduction
- Historical Market Size Value (USD Million) Analysis By Region, 2021 to 2025
- Current Market Size Value (USD Million) Analysis and Forecast By Region, 2026 to 2036
- North America
- Latin America
- Western Europe
- Eastern Europe
- East Asia
- South Asia and Pacific
- Middle East & Africa
- Market Attractiveness Analysis By Region
- North America Market Analysis and Forecast, By Country, 2021 to 2036
- Historical Market Size Value (USD Million) Trend Analysis By Market Taxonomy, 2021 to 2025
- Market Size Value (USD Million) Forecast By Market Taxonomy, 2026 to 2036
- By Country
- USA
- Canada
- By Additive Type
- By Process
- By Feedstock
- By End Use
- By Sales Channel
- By Country
- Market Attractiveness Analysis
- By Country
- By Additive Type
- By Process
- By Feedstock
- By End Use
- By Sales Channel
- Key Takeaways
- Latin America Market Analysis and Forecast, By Country
- Historical Market Size Value (USD Million) Trend Analysis By Market Taxonomy, 2021 to 2025
- Market Size Value (USD Million) Forecast By Market Taxonomy, 2026 to 2036
- By Country
- Brazil
- Mexico
- Chile
- Rest of Latin America
- By Additive Type
- By Process
- By Feedstock
- By End Use
- By Sales Channel
- By Country
- Market Attractiveness Analysis
- By Country
- By Additive Type
- By Process
- By Feedstock
- By End Use
- By Sales Channel
- Key Takeaways
- Western Europe Market Analysis and Forecast, By Country
- Historical Market Size Value (USD Million) Trend Analysis By Market Taxonomy, 2021 to 2025
- Market Size Value (USD Million) Forecast By Market Taxonomy, 2026 to 2036
- By Country
- Germany
- UK
- Italy
- Spain
- France
- Nordic
- BENELUX
- Rest of Western Europe
- By Additive Type
- By Process
- By Feedstock
- By End Use
- By Sales Channel
- By Country
- Market Attractiveness Analysis
- By Country
- By Additive Type
- By Process
- By Feedstock
- By End Use
- By Sales Channel
- Key Takeaways
- Eastern Europe Market Analysis and Forecast, By Country
- Historical Market Size Value (USD Million) Trend Analysis By Market Taxonomy, 2021 to 2025
- Market Size Value (USD Million) Forecast By Market Taxonomy, 2026 to 2036
- By Country
- Russia
- Poland
- Hungary
- Balkan & Baltic
- Rest of Eastern Europe
- By Additive Type
- By Process
- By Feedstock
- By End Use
- By Sales Channel
- By Country
- Market Attractiveness Analysis
- By Country
- By Additive Type
- By Process
- By Feedstock
- By End Use
- By Sales Channel
- Key Takeaways
- East Asia Market Analysis and Forecast, By Country
- Historical Market Size Value (USD Million) Trend Analysis By Market Taxonomy, 2021 to 2025
- Market Size Value (USD Million) Forecast By Market Taxonomy, 2026 to 2036
- By Country
- China
- Japan
- South Korea
- By Additive Type
- By Process
- By Feedstock
- By End Use
- By Sales Channel
- By Country
- Market Attractiveness Analysis
- By Country
- By Additive Type
- By Process
- By Feedstock
- By End Use
- By Sales Channel
- Key Takeaways
- South Asia and Pacific Market Analysis and Forecast, By Country
- Historical Market Size Value (USD Million) Trend Analysis By Market Taxonomy, 2021 to 2025
- Market Size Value (USD Million) Forecast By Market Taxonomy, 2026 to 2036
- By Country
- India
- ASEAN
- Australia & New Zealand
- Rest of South Asia and Pacific
- By Additive Type
- By Process
- By Feedstock
- By End Use
- By Sales Channel
- By Country
- Market Attractiveness Analysis
- By Country
- By Additive Type
- By Process
- By Feedstock
- By End Use
- By Sales Channel
- Key Takeaways
- Middle East & Africa Market Analysis and Forecast, By Country
- Historical Market Size Value (USD Million) Trend Analysis By Market Taxonomy, 2021 to 2025
- Market Size Value (USD Million) Forecast By Market Taxonomy, 2026 to 2036
- By Country
- Kingdom of Saudi Arabia
- Other GCC Countries
- Türkiye
- South Africa
- Other African Union
- Rest of Middle East & Africa
- By Additive Type
- By Process
- By Feedstock
- By End Use
- By Sales Channel
- By Country
- Market Attractiveness Analysis
- By Country
- By Additive Type
- By Process
- By Feedstock
- By End Use
- By Sales Channel
- Key Takeaways
- Key Countries Market Analysis
- USA
- Pricing Analysis
- Market Share Analysis, 2025
- By Additive Type
- By Process
- By Feedstock
- By End Use
- By Sales Channel
- Canada
- Pricing Analysis
- Market Share Analysis, 2025
- By Additive Type
- By Process
- By Feedstock
- By End Use
- By Sales Channel
- Mexico
- Pricing Analysis
- Market Share Analysis, 2025
- By Additive Type
- By Process
- By Feedstock
- By End Use
- By Sales Channel
- Brazil
- Pricing Analysis
- Market Share Analysis, 2025
- By Additive Type
- By Process
- By Feedstock
- By End Use
- By Sales Channel
- Chile
- Pricing Analysis
- Market Share Analysis, 2025
- By Additive Type
- By Process
- By Feedstock
- By End Use
- By Sales Channel
- Germany
- Pricing Analysis
- Market Share Analysis, 2025
- By Additive Type
- By Process
- By Feedstock
- By End Use
- By Sales Channel
- UK
- Pricing Analysis
- Market Share Analysis, 2025
- By Additive Type
- By Process
- By Feedstock
- By End Use
- By Sales Channel
- Italy
- Pricing Analysis
- Market Share Analysis, 2025
- By Additive Type
- By Process
- By Feedstock
- By End Use
- By Sales Channel
- Spain
- Pricing Analysis
- Market Share Analysis, 2025
- By Additive Type
- By Process
- By Feedstock
- By End Use
- By Sales Channel
- France
- Pricing Analysis
- Market Share Analysis, 2025
- By Additive Type
- By Process
- By Feedstock
- By End Use
- By Sales Channel
- India
- Pricing Analysis
- Market Share Analysis, 2025
- By Additive Type
- By Process
- By Feedstock
- By End Use
- By Sales Channel
- ASEAN
- Pricing Analysis
- Market Share Analysis, 2025
- By Additive Type
- By Process
- By Feedstock
- By End Use
- By Sales Channel
- Australia & New Zealand
- Pricing Analysis
- Market Share Analysis, 2025
- By Additive Type
- By Process
- By Feedstock
- By End Use
- By Sales Channel
- China
- Pricing Analysis
- Market Share Analysis, 2025
- By Additive Type
- By Process
- By Feedstock
- By End Use
- By Sales Channel
- Japan
- Pricing Analysis
- Market Share Analysis, 2025
- By Additive Type
- By Process
- By Feedstock
- By End Use
- By Sales Channel
- South Korea
- Pricing Analysis
- Market Share Analysis, 2025
- By Additive Type
- By Process
- By Feedstock
- By End Use
- By Sales Channel
- Russia
- Pricing Analysis
- Market Share Analysis, 2025
- By Additive Type
- By Process
- By Feedstock
- By End Use
- By Sales Channel
- Poland
- Pricing Analysis
- Market Share Analysis, 2025
- By Additive Type
- By Process
- By Feedstock
- By End Use
- By Sales Channel
- Hungary
- Pricing Analysis
- Market Share Analysis, 2025
- By Additive Type
- By Process
- By Feedstock
- By End Use
- By Sales Channel
- Kingdom of Saudi Arabia
- Pricing Analysis
- Market Share Analysis, 2025
- By Additive Type
- By Process
- By Feedstock
- By End Use
- By Sales Channel
- Türkiye
- Pricing Analysis
- Market Share Analysis, 2025
- By Additive Type
- By Process
- By Feedstock
- By End Use
- By Sales Channel
- South Africa
- Pricing Analysis
- Market Share Analysis, 2025
- By Additive Type
- By Process
- By Feedstock
- By End Use
- By Sales Channel
- USA
- Market Structure Analysis
- Competition Dashboard
- Competition Benchmarking
- Market Share Analysis of Top Players
- By Regional
- By Additive Type
- By Process
- By Feedstock
- By End Use
- By Sales Channel
- Emerging Startups
- Innovation Benchmarking
- Competition Analysis
- Case Studies
- Success Stories
- Recent Developments
- Assumptions & Acronyms Used


