Reach Stacker Market Size, Share, and Forecast Outlook 2025 to 2035

In 2025, the reach stacker market is valued at USD 3.4 billion and is projected to reach approximately USD 5.2 billion by 2035, reflecting a compound annual growth rate of 4.3%.

The absolute dollar opportunity over this period amounts to around 1.78 billion USD, representing the additional market value available for participants. The multiplying factor for this growth, calculated as the ratio of the 2035 market size to the 2025 base, is approximately 1.52.

This indicates steady market expansion over the ten-year period, supported by rising demand for efficient container handling equipment, expansion of port infrastructure, and modernization of logistics operations in both developing and developed regions.

From 2025 to 2035, the market is expected to grow consistently due to replacement demand for aging machinery and wider adoption of automated solutions in ports and intermodal transport facilities. Investments in advanced reach stackers with higher load capacity, improved safety features, and energy-efficient operations will drive adoption among end-users.

The absolute dollar opportunity highlights the tangible revenue potential for manufacturers, suppliers, and service providers. With a multiplying factor of 1.52, the market trajectory indicates steady growth, underlining the increasing role of reach stackers in enhancing operational efficiency and productivity in container handling worldwide.
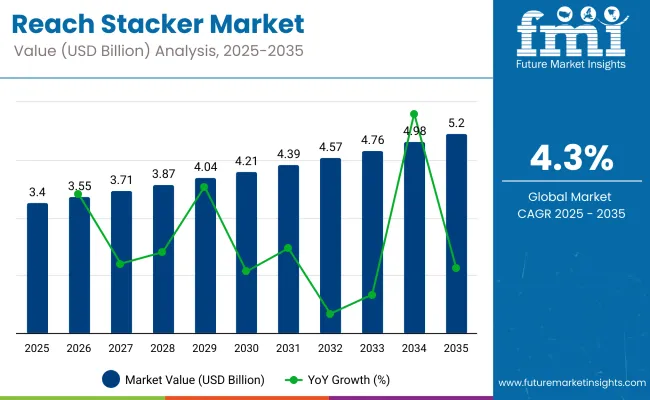
Quick Stats of Reach Stacker Market

  • Reach Stacker Market Size (2025): USD 3.4 billion
  • Projected Reach Stacker Market Size (2035): USD 5.2 billion
  • Forecast CAGR of Reach Stacker Market (2025 to 2035): 4.3%
  • Leading Segment of Reach Stacker Market (2025): Medium tonnage (30-45 tons)
  • Key Growth Regions of Reach Stacker Market: ASEAN, North America, Europe
  • Top Key Players of Reach Stacker Market: Konecranes, Kalmar, Liebherr, Hyster-Yale, Sany

Reach Stacker Market

Metric Value
Industry Size (2025E) USD 3.4 billion
Industry Value (2035F) USD 5.2 billion
CAGR (2025 to 2035) 4.3%

The market is supported by five parent markets with varying contributions. Material handling equipment accounts for approximately 45%, supplying cranes, forklifts, and container handling solutions. Logistics and warehousing contribute around 25%, driven by port terminals, container yards, and storage operations. Ports and shipping represent about 15%, enabling efficient container stacking, loading, and unloading.

Construction and heavy machinery hold roughly 10%, supporting bulk material movement and on-site cargo handling. Industrial automation and robotics account for nearly 5%, integrating automated stacking, remote operation, and fleet management. These markets collectively enable global reach stacker adoption and operational efficiency.

Recent trends in the reach stacker market focus on electrification, automation, and strategic partnerships. Leading players such as Kalmar, Konecranes, Liebherr, and Hyster-Yale are introducing electric and hybrid reach stackers to reduce emissions and operating costs. IoT-enabled fleet management platforms and telematics systems are improving productivity, predictive maintenance, and real-time monitoring.

Remote-controlled and semi-automated reach stackers are being deployed at major ports to enhance safety and operational efficiency. Companies are forming public-private partnerships and investing in smart port infrastructure. Strategic mergers, technology collaborations, and sustainability-focused initiatives continue to shape the market and accelerate adoption of next-generation cargo handling solutions.

Top Reach Stacker Market Dynamics

The market is expanding as ports and container terminals manage rising cargo volumes. Global container traffic exceeded 850 million TEUs in 2024 and is projected to surpass 1 billion TEUs by 2030, driving demand for high-capacity handling equipment. Operators are upgrading fleets to reduce turnaround times, improve stacking efficiency, and handle heavier loads safely. Automation and integration with terminal management systems are accelerating modernization. Modern reach stackers allow vertical stacking of up to 5 containers, optimizing yard space by 20-30% and cutting handling time by 15-25%.

Driving Force Increasing Cargo Traffic and Yard Efficiency

Container throughput is rising steadily, with major ports handling over 10 million TEUs annually. Reach stackers enable vertical stacking up to 5 containers, improving yard space efficiency by 20-30% and allowing terminals to process more cargo without expanding land. Advanced hydraulic systems and electric models cut fuel use while reducing container handling time by 15-25%.

Safety enhancements like load monitoring and anti-collision sensors lower the risk of accidents. Operators in Asia and Europe are replacing older equipment to handle growing cargo volumes efficiently, while developing regions are gradually adopting modern reach stackers to optimize terminal performance.

  • High-capacity reach stackers improve yard space efficiency by 20-30%.
  • Electric and hydraulic models lower fuel use and maintenance needs.
  • Automated load monitoring reduces accidents and operational errors.

Growth Avenue Electrification and Smart Features

Electric reach stackers are reducing fuel consumption by 30-40% and meeting stricter environmental requirements. Integration with terminal management software enables real-time tracking and predictive maintenance, cutting downtime by 10-15%. Smart features such as automated stacking, anti-collision systems, and remote operation enhance safety and operational efficiency.

Countries with large container throughput are adopting hybrid and electric models to improve yard productivity. Expansion of smart stackers in both developed and developing ports is creating opportunities for retrofitting older diesel units and enhancing overall cargo handling capacity, while also lowering operating costs. Terminal operators benefit from better labor efficiency and reduced operational delays.

  • Electric reach stackers reduce fuel consumption by 30-40%.
  • Predictive maintenance decreases downtime by 10-15%.
  • Remote operation and automation improve safety and labor efficiency.

Emerging Trend Expansion in Developing Ports

Container throughput in emerging markets is growing at 6-8% annually, increasing demand for modern reach stackers. Southeast Asian and African ports are investing in high-capacity equipment to handle rising import and export volumes. IoT-enabled monitoring, GPS tracking, and predictive maintenance help reduce operational errors and downtime.

Adoption of electric and hybrid models lowers fuel consumption and meets emission standards. Operator training and integration with terminal systems further improve productivity and safety. These investments allow developing ports to maximize space utilization with vertical stacking and handle growing cargo efficiently while maintaining lower operational costs.

  • Reach stacker adoption supports 6-8% annual cargo growth in emerging ports.
  • IoT monitoring and predictive maintenance reduce errors and delays.
  • Electric and hybrid models improve fuel efficiency and operational safety.

Market Challenge High Cost and Maintenance Requirements

Reach stackers are high-value assets, costing USD 150,000 to USD 500,000 depending on capacity and automation. Annual maintenance, including hydraulic servicing, battery replacement, and sensor calibration, adds 10-15% of the original purchase cost. Skilled operators are required to maximize efficiency, and downtime can reduce terminal throughput by 10-20%.

These high upfront and recurring costs slow adoption in smaller ports and developing countries. Transitioning from diesel to electric or hybrid models requires additional investment in infrastructure. Proper financial planning is crucial to balance operational efficiency with capital expenditure while maintaining safe and reliable terminal operations.

  • Initial cost ranges from USD 150,000 to USD 500,000 per unit.
  • Maintenance adds 10-15% of the purchase price annually.
  • Downtime can reduce terminal throughput by up to 20%.

Analyzing Reach Stacker Market by Top Investment Segments

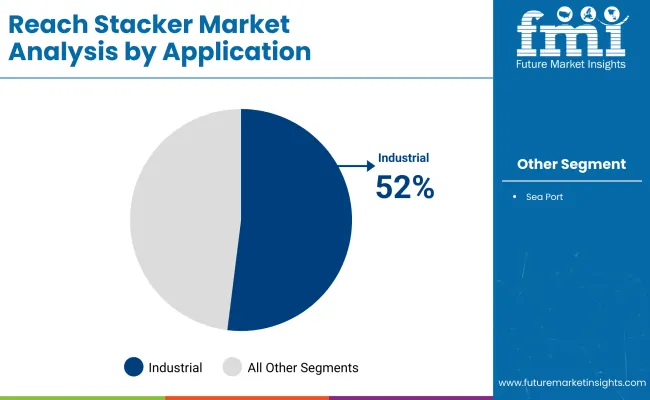
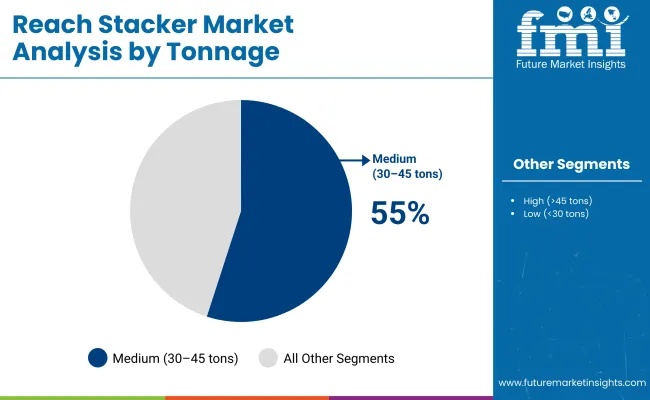
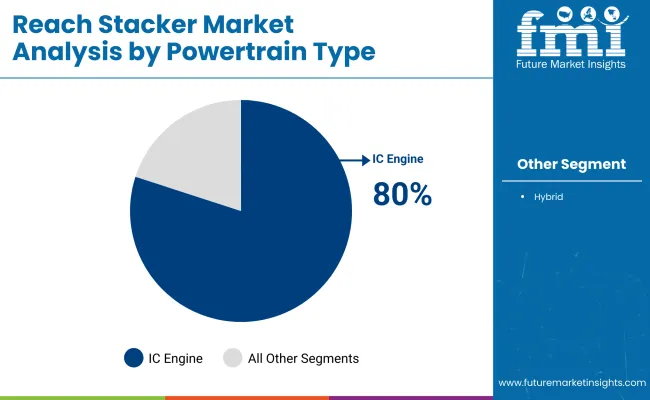
The reach stacker market is led by industrial applications, medium tonnage units, and IC engine powertrains. Industrial operations account for 52% as warehouses, manufacturing plants, and inland depots focus on faster cargo movement and reduced labor dependency. Medium tonnage units of 30-45 tons represent 55% share, preferred for standard container handling and maneuverability in yards. IC engine models dominate at 80% due to high torque, continuous operation, and global fuel availability. These segments present the most strategic opportunities for OEMs, port operators, and logistics providers globally.
Industrial Operations Drive Reach Stacker Demand in 2025

Reach Stacker Market By Application

Industrial applications are the top segment with 52% share, supporting factories, warehouses, and logistics depots. Reach stackers improve efficiency by reducing manual handling, increasing throughput, and optimizing storage space. Leading suppliers such as Kalmar, Konecranes, Hyster, and Liebherr provide units equipped with ergonomic cabins, high precision controls, and safety monitoring systems. Industrial hubs in Asia Pacific, North America, and Europe are actively upgrading fleets to meet higher production and cargo handling demands. Predictive maintenance and telematics integration are widely applied to monitor usage and reduce downtime, ensuring smoother operations.
  • 52% of reach stackers are deployed in industrial facilities globally
  • Lifting cycle optimization increases throughput by up to 20%
  • Ergonomic cabins and automation features enhance operator efficiency and safety

Medium Tonnage Range Dominates Market with 55% Share

Reach Stacker Market By Tonnage

Medium tonnage reach stackers from 30-45 tons’ account for 55% of the market, balancing lifting capacity with maneuverability. These units are suitable for standard container sizes and versatile yard operations, offering better fuel efficiency compared to high tonnage models. Kalmar, Konecranes, Hyster, and Liebherr supply medium tonnage units with adjustable boom systems, stability controls, and onboard monitoring for optimized operations. Ports and industrial facilities prefer these machines to reduce capital expenditure while maintaining productivity. Growth in logistics and regional container terminals supports steady demand.
  • Medium tonnage units handle 30-45 ton containers efficiently
  • Adjustable booms improve stacking speed and accuracy by 15%
  • Energy consumption is 10-12% lower than heavier tonnage models

IC Engine Powertrains Lead with 80% Market Share

Reach Stacker Market By Powertrain

IC engine powered reach stackers dominate at 80%, selected for high performance, continuous operation, and global fuel availability. Diesel engines deliver high torque for lifting heavy loads efficiently, making them suitable for ports, industrial depots, and container yards. Kalmar, Liebherr, Hyster, and Konecranes provide IC engine units with low emission technologies, advanced diagnostics, and rugged designs for long term durability. Hybrid powertrains account for 20% but remain niche in environmentally sensitive regions. IC engine units are preferred for multi shift operations and areas lacking electric charging infrastructure, ensuring reliable material handling worldwide.

  • 80% of reach stackers use IC engines for heavy duty operations
  • Diesel engines provide high torque for stacked containers
  • Units support multi shift operations with minimal downtime

Sea Port Applications Hold 48% Presence

Sea ports represent 48% of reach stacker deployment, handling container throughput, yard management, and cargo stacking. Reach stackers improve operational efficiency by reducing turnaround times for vessels and optimizing container retrieval. Kalmar, Liebherr, Konecranes, and Hyster supply specialized port models with telematics, automated monitoring, and high lift cycles. Expansion of container terminals in Asia, Europe, and North America drives demand for reliable, durable units. Advanced monitoring systems help schedule maintenance, track utilization, and prevent unplanned downtime, ensuring smooth port operations.
  • 48% of reach stackers operate in port terminals globally
  • Telematics improve utilization monitoring and maintenance planning
  • High stacking efficiency reduces ship turnaround and yard congestion

Top Countries Driving Reach Stacker Market Growth

Reach Stacker Market By Country

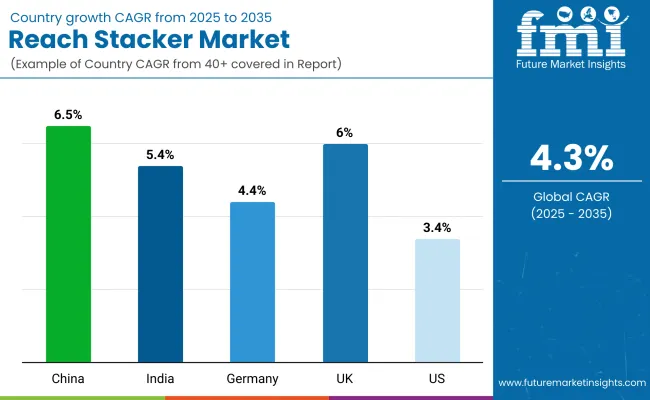
The global reach stacker market is projected to expand at a CAGR of 4.3% from 2025 to 2035. China leads with 6.5%, outperforming the global average by +51%, fueled by port expansion and industrial logistics growth across BRICS. The United Kingdom follows at 6.0%, marking a +40% premium, supported by modernization of container handling and transport infrastructure within OECD frameworks. India records 5.4%, or +26% above the global rate, reflecting ASEAN-linked industrial collaborations and rising cargo handling needs.

Germany grows at 4.4%, slightly above the global average by +2%, driven by structured port upgrades and logistics efficiency programs. The United States shows the slowest pace at 3.4%, −21% below the global benchmark, due to established infrastructure and incremental equipment replacement cycles. The BRICS economies demonstrate faster adoption, while OECD markets advance steadily at measured rates.

Market Growth Analysis of Reach Stackers in China

The demand of reach stacker in China is expanding at a CAGR of 6.5%, supported by the rapid development of ports, logistics hubs, and intermodal terminals. Increasing trade volumes and the need for efficient container handling are driving adoption. Chinese manufacturers are producing high-capacity reach stackers with advanced automation and telematics features, enhancing operational efficiency. Government initiatives to modernize port infrastructure further stimulate demand. Adoption is concentrated in major ports such as Shanghai, Shenzhen, and Ningbo, where container traffic continues to grow. Integration with digital fleet management and remote monitoring systems is becoming a standard feature, providing both operational safety and productivity improvements.

  • Over 80% of major Chinese ports using automated reach stacker fleets by 2025
  • Telemetry-enabled reach stackers reducing maintenance downtime by 15%
  • Investment in new high-capacity stackers projected to grow 20% annually

Reach Stacker Market Expansion Outlook in the United Kingdom

The reach stacker market in the United Kingdom is growing at a CAGR of 6%, driven by increased port activity, intermodal terminal upgrades, and investment in logistics automation. Ports like Felixstowe and Southampton are modernizing container handling operations, prompting adoption of reach stackers with enhanced load capacity and precision handling. Leasing models are becoming popular among smaller operators to optimize costs. The market also benefits from integration of energy-efficient engines and hybrid technologies to reduce fuel consumption. Operators are prioritizing fleet management solutions to track maintenance, optimize scheduling, and enhance safety during container stacking operations.

  • Over 60% of UK container terminals using hybrid reach stackers
  • Reach stacker fleet modernization reducing average turnaround time by 12%
  • Leasing demand projected to increase by 18% by 2026

Reach Stacker Market Growth Projection in India

The reach stacker market in India is growing at a CAGR of 5.4%, fueled by expanding port throughput and growing industrial logistics needs. Key ports including Jawaharlal Nehru Port, Mundra, and Chennai are investing in high-capacity container handling equipment to improve operational efficiency. Domestic and international manufacturers are introducing diesel-electric and fully electric models to meet efficiency and cost requirements. Adoption is increasing in intermodal terminals and private container yards, driven by rising trade activity and government-backed infrastructure projects. Fleet management systems and remote diagnostics are increasingly being implemented to minimize downtime and maximize performance.

  • Over 25% of Indian ports implementing digital fleet tracking for reach stackers
  • Diesel-electric reach stacker adoption expected to reach 40% by 2026
  • Average container handling time reduced by 10% with modern reach stackers

Intelligent Reach Stacker Market Outlook in Germany

The reach stacker market in Germany is expanding at a CAGR of 4.4%, largely driven by modernization of logistics and intermodal terminals. Operators are focusing on high-precision handling, automation, and integration with digital management systems to improve throughput. The market benefits from Germany’s strong industrial base and advanced engineering capabilities, which enable efficient, high-capacity equipment. Adoption is concentrated in large ports like Hamburg and Bremerhaven. Energy-efficient diesel and hybrid models are increasingly replacing older units, supporting cost reduction and environmental efficiency in operations. Germany also sees steady demand from rail-linked container depots for reach stackers capable of handling high-volume traffic.

  • Hybrid reach stackers accounted for 35% of new sales in 2024
  • Automated stacking systems reducing human labor involvement by 20%
  • Average operational efficiency increased by 15% at major German ports

Reach Stacker Market Forecast in the United States

The reach stacker industry in the United States is growing at a CAGR of 3.4%, driven by port modernization and logistics optimization. Key ports such as Los Angeles, Long Beach, and New York are investing in high-capacity equipment to handle increasing container volumes. Operators are gradually adopting hybrid and electric models to improve fuel efficiency and reduce maintenance costs. The market also benefits from leasing solutions that allow smaller operators to access modern reach stackers without heavy capital expenditure. Fleet management systems are increasingly being implemented to monitor productivity, reduce downtime, and improve safety.
  • Fleet upgrades expected to increase US reach stacker efficiency by 12% by 2027
  • Hybrid reach stacker adoption projected to reach 30% by 2026
  • Leasing models contributing to 25% of new acquisitions in the US

Leading Reach Stacker Manufacturers, Suppliers, Distributors

Reach Stacker Market By Company

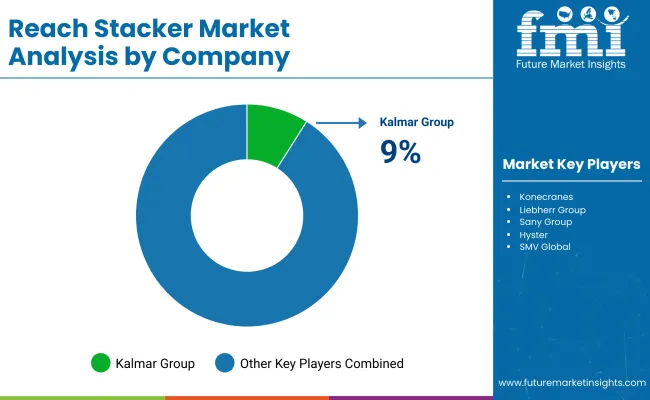
The global market is shaped by several established players and emerging participants, each employing distinct strategies to strengthen their position. CVS Ferrari S.P.A. continues to expand its product portfolio through regular launches of high-capacity reach stackers designed for efficiency in port and terminal operations. Kalmar Group emphasizes research and development to improve machine performance and operator comfort, while Konecranes leverages its global distribution network to penetrate new markets and offer after-sales support.

Liebherr Group focuses on customized solutions for varying cargo handling needs, combining durability with advanced control systems. Sany Group has recently expanded its presence with competitively priced models targeting mid-sized terminals, highlighting its strategy of blending affordability with operational capability.

Other players, including Hyster, SMV Global, and Toyota, are actively enhancing their offerings through product upgrades and partnerships. Hyster has introduced electric-powered reach stackers to meet diverse operational requirements, while SMV Global invests in optimizing machine design and maintenance services. Toyota focuses on integrating ergonomic features to improve productivity and safety. These companies are strengthening their market presence through focused product development, regional expansion, and strategic collaborations, ensuring they remain competitive in a dynamic global market for reach stackers.

Leading Players

  • CVS Ferrari S.P.A.
  • Kalmar Group
  • Konecranes
  • Liebherr Group
  • Sany Group
  • Hyster
  • SMV Global
  • Toyota

Report Scope

Report Attributes Details
Market Size (2025) USD 3.4 billion
Projected Market Size (2035) USD 5.2 billion
CAGR (2025 to 2035) 4.3%
Base Year for Estimation 2024
Historical Period 2020 to 2024
Projections Period 2025 to 2035
Quantitative Units USD billion for value
Applications Analyzed (Segment 1) Sea Ports, Industrial
Tonnage Categories Analyzed (Segment 2) Low, Medium, High
Power Train Types Analyzed (Segment 3) IC Engine, Hybrid
Regions Covered North America; Latin America; Western Europe; Eastern Europe; Asia Pacific; Middle East & Africa
Countries Covered United States, Canada, Brazil, Mexico, Germany, United Kingdom, France, Italy, China, Japan, India, UAE, South Africa
Key Players Influencing the Market CVS Ferrari S.P.A., Kalmar Group, Konecranes , Liebherr Group, Sany Group, Hyster , SMV Global, Toyota
Additional Attributes Dollar sales by model type and lifting capacity , demand dynamics across ports, container yards, and industrial logistics, regional trends in adoption across Asia-Pacific, Europe, and North America, innovation in electric and hybrid models, telematics integration, environmental impact of fuel use and emissions, and emerging use cases in automated container handling and smart port operations.

Reach Stacker Market Analyzed by Key Investment Segments 

By Application:

  • Sea Ports
  • Industrial

By Tonnage:

  • Low
  • Medium
  • High

By Power Train Type:

  • IC Engine 
  • Hybrid

By Region:

  • North America
  • Latin America
  • Western Europe
  • Eastern Europe
  • Asia Pacific
  • The Middle East and Africa

Table of Content

  1. Executive Summary
    • Global Market Outlook
    • Demand-side Trends
    • Supply-side Trends
    • Technology Roadmap Analysis
    • Analysis and Recommendations
  2. Market Overview
    • Market Coverage / Taxonomy
    • Market Definition / Scope / Limitations
  3. Market Background
    • Market Dynamics
      • Drivers
      • Restraints
      • Opportunity
      • Trends
    • Scenario Forecast
      • Demand in Optimistic Scenario
      • Demand in Likely Scenario
      • Demand in Conservative Scenario
    • Opportunity Map Analysis
    • Product Life Cycle Analysis
    • Supply Chain Analysis
      • Supply Side Participants and their Roles
        • Producers
        • Mid-Level Participants (Traders/ Agents/ Brokers)
        • Wholesalers and Distributors
      • Value Added and Value Created at Node in the Supply Chain
      • List of Raw Material Suppliers
      • List of Existing and Potential Buyer’s
    • Investment Feasibility Matrix
    • Value Chain Analysis
      • Profit Margin Analysis
      • Wholesalers and Distributors
      • Retailers
    • PESTLE and Porter’s Analysis
    • Regulatory Landscape
      • By Key Regions
      • By Key Countries
    • Regional Parent Market Outlook
    • Production and Consumption Statistics
    • Import and Export Statistics
  4. Global Market Analysis 2020 to 2024 and Forecast, 2025 to 2035
    • Historical Market Size Value (USD Billion) & Volume (Units) Analysis, 2020 to 2024
    • Current and Future Market Size Value (USD Billion) & Volume (Units) Projections, 2025 to 2035
      • Y-o-Y Growth Trend Analysis
      • Absolute $ Opportunity Analysis
  5. Global Market Pricing Analysis 2020 to 2024 and Forecast 2025 to 2035
  6. Global Market Analysis 2020 to 2024 and Forecast 2025 to 2035, By Application
    • Introduction / Key Findings
    • Historical Market Size Value (USD Billion) & Volume (Units) Analysis By Application, 2020 to 2024
    • Current and Future Market Size Value (USD Billion) & Volume (Units) Analysis and Forecast By Application, 2025 to 2035
      • Industrial
      • Sea Ports
    • Y-o-Y Growth Trend Analysis By Application, 2020 to 2024
    • Absolute $ Opportunity Analysis By Application, 2025 to 2035
  7. Global Market Analysis 2020 to 2024 and Forecast 2025 to 2035, By Tonnage
    • Introduction / Key Findings
    • Historical Market Size Value (USD Billion) & Volume (Units) Analysis By Tonnage, 2020 to 2024
    • Current and Future Market Size Value (USD Billion) & Volume (Units) Analysis and Forecast By Tonnage, 2025 to 2035
      • Medium (30-45 tons)
      • High (>45 tons)
      • Low (<30 tons)
    • Y-o-Y Growth Trend Analysis By Tonnage, 2020 to 2024
    • Absolute $ Opportunity Analysis By Tonnage, 2025 to 2035
  8. Global Market Analysis 2020 to 2024 and Forecast 2025 to 2035, By Powertrain Type
    • Introduction / Key Findings
    • Historical Market Size Value (USD Billion) & Volume (Units) Analysis By Powertrain Type, 2020 to 2024
    • Current and Future Market Size Value (USD Billion) & Volume (Units) Analysis and Forecast By Powertrain Type, 2025 to 2035
      • IC Engine
      • Hybrid
    • Y-o-Y Growth Trend Analysis By Powertrain Type, 2020 to 2024
    • Absolute $ Opportunity Analysis By Powertrain Type, 2025 to 2035
  9. Global Market Analysis 2020 to 2024 and Forecast 2025 to 2035, By Region
    • Introduction
    • Historical Market Size Value (USD Billion) & Volume (Units) Analysis By Region, 2020 to 2024
    • Current Market Size Value (USD Billion) & Volume (Units) Analysis and Forecast By Region, 2025 to 2035
      • North America
      • Latin America
      • Western Europe
      • Eastern Europe
      • East Asia
      • South Asia & Pacific
      • Middle East and Africa
    • Market Attractiveness Analysis By Region
  10. North America Market Analysis 2020 to 2024 and Forecast 2025 to 2035, By Country
    • Historical Market Size Value (USD Billion) & Volume (Units) Trend Analysis By Market Taxonomy, 2020 to 2024
    • Market Size Value (USD Billion) & Volume (Units) Forecast By Market Taxonomy, 2025 to 2035
      • By Country
        • USA
        • Canada
        • Mexico
      • By Application
      • By Tonnage
      • By Powertrain Type
    • Market Attractiveness Analysis
      • By Country
      • By Application
      • By Tonnage
      • By Powertrain Type
    • Key Takeaways
  11. Latin America Market Analysis 2020 to 2024 and Forecast 2025 to 2035, By Country
    • Historical Market Size Value (USD Billion) & Volume (Units) Trend Analysis By Market Taxonomy, 2020 to 2024
    • Market Size Value (USD Billion) & Volume (Units) Forecast By Market Taxonomy, 2025 to 2035
      • By Country
        • Brazil
        • Argentina
        • Rest of LATAM
      • By Application
      • By Tonnage
      • By Powertrain Type
    • Market Attractiveness Analysis
      • By Country
      • By Application
      • By Tonnage
      • By Powertrain Type
    • Key Takeaways
  12. Western Europe Market Analysis 2020 to 2024 and Forecast 2025 to 2035, By Country
    • Historical Market Size Value (USD Billion) & Volume (Units) Trend Analysis By Market Taxonomy, 2020 to 2024
    • Market Size Value (USD Billion) & Volume (Units) Forecast By Market Taxonomy, 2025 to 2035
      • By Country
        • Germany
        • Italy
        • France
        • UK
        • Spain
        • BENELUX
        • Nordic
        • Rest of W.Europe
      • By Application
      • By Tonnage
      • By Powertrain Type
    • Market Attractiveness Analysis
      • By Country
      • By Application
      • By Tonnage
      • By Powertrain Type
    • Key Takeaways
  13. Eastern Europe Market Analysis 2020 to 2024 and Forecast 2025 to 2035, By Country
    • Historical Market Size Value (USD Billion) & Volume (Units) Trend Analysis By Market Taxonomy, 2020 to 2024
    • Market Size Value (USD Billion) & Volume (Units) Forecast By Market Taxonomy, 2025 to 2035
      • By Country
        • Russia
        • Hungary
        • Poland
        • Balkan & Baltics
        • Rest of E. Europe
      • By Application
      • By Tonnage
      • By Powertrain Type
    • Market Attractiveness Analysis
      • By Country
      • By Application
      • By Tonnage
      • By Powertrain Type
    • Key Takeaways
  14. East Asia Market Analysis 2020 to 2024 and Forecast 2025 to 2035, By Country
    • Historical Market Size Value (USD Billion) & Volume (Units) Trend Analysis By Market Taxonomy, 2020 to 2024
    • Market Size Value (USD Billion) & Volume (Units) Forecast By Market Taxonomy, 2025 to 2035
      • By Country
        • China
        • Japan
        • South Korea
      • By Application
      • By Tonnage
      • By Powertrain Type
    • Market Attractiveness Analysis
      • By Country
      • By Application
      • By Tonnage
      • By Powertrain Type
    • Key Takeaways
  15. South Asia & Pacific Market Analysis 2020 to 2024 and Forecast 2025 to 2035, By Country
    • Historical Market Size Value (USD Billion) & Volume (Units) Trend Analysis By Market Taxonomy, 2020 to 2024
    • Market Size Value (USD Billion) & Volume (Units) Forecast By Market Taxonomy, 2025 to 2035
      • By Country
        • India
        • Australia & New Zealand
        • ASEAN
        • Rest of SAP
      • By Application
      • By Tonnage
      • By Powertrain Type
    • Market Attractiveness Analysis
      • By Country
      • By Application
      • By Tonnage
      • By Powertrain Type
    • Key Takeaways
  16. Middle East and Africa Market Analysis 2020 to 2024 and Forecast 2025 to 2035, By Country
    • Historical Market Size Value (USD Billion) & Volume (Units) Trend Analysis By Market Taxonomy, 2020 to 2024
    • Market Size Value (USD Billion) & Volume (Units) Forecast By Market Taxonomy, 2025 to 2035
      • By Country
        • GCC Countries
        • Northern Africa
        • South Africa
        • Turkiye
        • Rest of MEA
      • By Application
      • By Tonnage
      • By Powertrain Type
    • Market Attractiveness Analysis
      • By Country
      • By Application
      • By Tonnage
      • By Powertrain Type
    • Key Takeaways
  17. Key Countries Market Analysis
    • USA
      • Pricing Analysis
      • Market Share Analysis, 2024
        • By Application
        • By Tonnage
        • By Powertrain Type
    • Canada
      • Pricing Analysis
      • Market Share Analysis, 2024
        • By Application
        • By Tonnage
        • By Powertrain Type
    • Brazil
      • Pricing Analysis
      • Market Share Analysis, 2024
        • By Application
        • By Tonnage
        • By Powertrain Type
    • Mexico
      • Pricing Analysis
      • Market Share Analysis, 2024
        • By Application
        • By Tonnage
        • By Powertrain Type
    • Argentina
      • Pricing Analysis
      • Market Share Analysis, 2024
        • By Application
        • By Tonnage
        • By Powertrain Type
  18. Market Structure Analysis
    • Competition Dashboard
    • Competition Benchmarking
    • Market Share Analysis of Top Players
      • By Regional
      • By Application
      • By Tonnage
      • By Powertrain Type
  19. Competition Analysis
    • Competition Deep Dive
      • Kalmar Group
        • Overview
        • Product Portfolio
        • Profitability by Market Segments (Product/Age /Sales Channel/Region)
        • Sales Footprint
        • Strategy Overview
          • Marketing Strategy
          • Product Strategy
          • Channel Strategy
      • Konecranes
        • Overview
        • Product Portfolio
        • Profitability by Market Segments (Product/Age /Sales Channel/Region)
        • Sales Footprint
        • Strategy Overview
          • Marketing Strategy
          • Product Strategy
          • Channel Strategy
      • Liebherr Group
        • Overview
        • Product Portfolio
        • Profitability by Market Segments (Product/Age /Sales Channel/Region)
        • Sales Footprint
        • Strategy Overview
          • Marketing Strategy
          • Product Strategy
          • Channel Strategy
      • Sany Group
        • Overview
        • Product Portfolio
        • Profitability by Market Segments (Product/Age /Sales Channel/Region)
        • Sales Footprint
        • Strategy Overview
          • Marketing Strategy
          • Product Strategy
          • Channel Strategy
      • Hyster
        • Overview
        • Product Portfolio
        • Profitability by Market Segments (Product/Age /Sales Channel/Region)
        • Sales Footprint
        • Strategy Overview
          • Marketing Strategy
          • Product Strategy
          • Channel Strategy
      • SMV Global
        • Overview
        • Product Portfolio
        • Profitability by Market Segments (Product/Age /Sales Channel/Region)
        • Sales Footprint
        • Strategy Overview
          • Marketing Strategy
          • Product Strategy
          • Channel Strategy
      • Toyota
        • Overview
        • Product Portfolio
        • Profitability by Market Segments (Product/Age /Sales Channel/Region)
        • Sales Footprint
        • Strategy Overview
          • Marketing Strategy
          • Product Strategy
          • Channel Strategy
      • CVS Ferrari S.P.A.
        • Overview
        • Product Portfolio
        • Profitability by Market Segments (Product/Age /Sales Channel/Region)
        • Sales Footprint
        • Strategy Overview
          • Marketing Strategy
          • Product Strategy
          • Channel Strategy
  20. Assumptions & Acronyms Used
  21. Research Methodology

List of Tables

  • Table 1: Global Market Value (USD Billion) Forecast by Region, 2020-2035
  • Table 2: Global Market Volume (Units) Forecast by Region, 2020-2035
  • Table 3: Global Market Value (USD Billion) Forecast by Application, 2020-2035
  • Table 4: Global Market Volume (Units) Forecast by Application, 2020-2035
  • Table 5: Global Market Value (USD Billion) Forecast by Tonnage, 2020-2035
  • Table 6: Global Market Volume (Units) Forecast by Tonnage, 2020-2035
  • Table 7: Global Market Value (USD Billion) Forecast by Powertrain Type, 2020-2035
  • Table 8: Global Market Volume (Units) Forecast by Powertrain Type, 2020-2035
  • Table 9: North America Market Value (USD Billion) Forecast by Country, 2020-2035
  • Table 10: North America Market Volume (Units) Forecast by Country, 2020-2035
  • Table 11: North America Market Value (USD Billion) Forecast by Application, 2020-2035
  • Table 12: North America Market Volume (Units) Forecast by Application, 2020-2035
  • Table 13: North America Market Value (USD Billion) Forecast by Tonnage, 2020-2035
  • Table 14: North America Market Volume (Units) Forecast by Tonnage, 2020-2035
  • Table 15: North America Market Value (USD Billion) Forecast by Powertrain Type, 2020-2035
  • Table 16: North America Market Volume (Units) Forecast by Powertrain Type, 2020-2035
  • Table 17: Latin America Market Value (USD Billion) Forecast by Country, 2020-2035
  • Table 18: Latin America Market Volume (Units) Forecast by Country, 2020-2035
  • Table 19: Latin America Market Value (USD Billion) Forecast by Application, 2020-2035
  • Table 20: Latin America Market Volume (Units) Forecast by Application, 2020-2035
  • Table 21: Latin America Market Value (USD Billion) Forecast by Tonnage, 2020-2035
  • Table 22: Latin America Market Volume (Units) Forecast by Tonnage, 2020-2035
  • Table 23: Latin America Market Value (USD Billion) Forecast by Powertrain Type, 2020-2035
  • Table 24: Latin America Market Volume (Units) Forecast by Powertrain Type, 2020-2035
  • Table 25: Western Europe Market Value (USD Billion) Forecast by Country, 2020-2035
  • Table 26: Western Europe Market Volume (Units) Forecast by Country, 2020-2035
  • Table 27: Western Europe Market Value (USD Billion) Forecast by Application, 2020-2035
  • Table 28: Western Europe Market Volume (Units) Forecast by Application, 2020-2035
  • Table 29: Western Europe Market Value (USD Billion) Forecast by Tonnage, 2020-2035
  • Table 30: Western Europe Market Volume (Units) Forecast by Tonnage, 2020-2035
  • Table 31: Western Europe Market Value (USD Billion) Forecast by Powertrain Type, 2020-2035
  • Table 32: Western Europe Market Volume (Units) Forecast by Powertrain Type, 2020-2035
  • Table 33: Eastern Europe Market Value (USD Billion) Forecast by Country, 2020-2035
  • Table 34: Eastern Europe Market Volume (Units) Forecast by Country, 2020-2035
  • Table 35: Eastern Europe Market Value (USD Billion) Forecast by Application, 2020-2035
  • Table 36: Eastern Europe Market Volume (Units) Forecast by Application, 2020-2035
  • Table 37: Eastern Europe Market Value (USD Billion) Forecast by Tonnage, 2020-2035
  • Table 38: Eastern Europe Market Volume (Units) Forecast by Tonnage, 2020-2035
  • Table 39: Eastern Europe Market Value (USD Billion) Forecast by Powertrain Type, 2020-2035
  • Table 40: Eastern Europe Market Volume (Units) Forecast by Powertrain Type, 2020-2035
  • Table 41: East Asia Market Value (USD Billion) Forecast by Country, 2020-2035
  • Table 42: East Asia Market Volume (Units) Forecast by Country, 2020-2035
  • Table 43: East Asia Market Value (USD Billion) Forecast by Application, 2020-2035
  • Table 44: East Asia Market Volume (Units) Forecast by Application, 2020-2035
  • Table 45: East Asia Market Value (USD Billion) Forecast by Tonnage, 2020-2035
  • Table 46: East Asia Market Volume (Units) Forecast by Tonnage, 2020-2035
  • Table 47: East Asia Market Value (USD Billion) Forecast by Powertrain Type, 2020-2035
  • Table 48: East Asia Market Volume (Units) Forecast by Powertrain Type, 2020-2035
  • Table 49: South Asia & Pacific Market Value (USD Billion) Forecast by Country, 2020-2035
  • Table 50: South Asia & Pacific Market Volume (Units) Forecast by Country, 2020-2035
  • Table 51: South Asia & Pacific Market Value (USD Billion) Forecast by Application, 2020-2035
  • Table 52: South Asia & Pacific Market Volume (Units) Forecast by Application, 2020-2035
  • Table 53: South Asia & Pacific Market Value (USD Billion) Forecast by Tonnage, 2020-2035
  • Table 54: South Asia & Pacific Market Volume (Units) Forecast by Tonnage, 2020-2035
  • Table 55: South Asia & Pacific Market Value (USD Billion) Forecast by Powertrain Type, 2020-2035
  • Table 56: South Asia & Pacific Market Volume (Units) Forecast by Powertrain Type, 2020-2035
  • Table 57: Middle East and Africa Market Value (USD Billion) Forecast by Country, 2020-2035
  • Table 58: Middle East and Africa Market Volume (Units) Forecast by Country, 2020-2035
  • Table 59: Middle East and Africa Market Value (USD Billion) Forecast by Application, 2020-2035
  • Table 60: Middle East and Africa Market Volume (Units) Forecast by Application, 2020-2035
  • Table 61: Middle East and Africa Market Value (USD Billion) Forecast by Tonnage, 2020-2035
  • Table 62: Middle East and Africa Market Volume (Units) Forecast by Tonnage, 2020-2035
  • Table 63: Middle East and Africa Market Value (USD Billion) Forecast by Powertrain Type, 2020-2035
  • Table 64: Middle East and Africa Market Volume (Units) Forecast by Powertrain Type, 2020-2035

List of Figures

  • Figure 1: Global Market Volume (Units) Forecast 2020-2035
  • Figure 2: Global Market Pricing Analysis
  • Figure 3: Global Market Value (USD Billion) Forecast 2020-2035
  • Figure 4: Global Market Value Share and BPS Analysis by Application, 2025 and 2035
  • Figure 5: Global Market Y-o-Y Growth Comparison by Application, 2025-2035
  • Figure 6: Global Market Attractiveness Analysis by Application
  • Figure 7: Global Market Value Share and BPS Analysis by Tonnage, 2025 and 2035
  • Figure 8: Global Market Y-o-Y Growth Comparison by Tonnage, 2025-2035
  • Figure 9: Global Market Attractiveness Analysis by Tonnage
  • Figure 10: Global Market Value Share and BPS Analysis by Powertrain Type, 2025 and 2035
  • Figure 11: Global Market Y-o-Y Growth Comparison by Powertrain Type, 2025-2035
  • Figure 12: Global Market Attractiveness Analysis by Powertrain Type
  • Figure 13: Global Market Value (USD Billion) Share and BPS Analysis by Region, 2025 and 2035
  • Figure 14: Global Market Y-o-Y Growth Comparison by Region, 2025-2035
  • Figure 15: Global Market Attractiveness Analysis by Region
  • Figure 16: North America Market Incremental $ Opportunity, 2025-2035
  • Figure 17: Latin America Market Incremental $ Opportunity, 2025-2035
  • Figure 18: Western Europe Market Incremental $ Opportunity, 2025-2035
  • Figure 19: Eastern Europe Market Incremental $ Opportunity, 2025-2035
  • Figure 20: East Asia Market Incremental $ Opportunity, 2025-2035
  • Figure 21: South Asia & Pacific Market Incremental $ Opportunity, 2025-2035
  • Figure 22: Middle East and Africa Market Incremental $ Opportunity, 2025-2035
  • Figure 23: North America Market Value Share and BPS Analysis by Country, 2025 and 2035
  • Figure 24: North America Market Value Share and BPS Analysis by Application, 2025 and 2035
  • Figure 25: North America Market Y-o-Y Growth Comparison by Application, 2025-2035
  • Figure 26: North America Market Attractiveness Analysis by Application
  • Figure 27: North America Market Value Share and BPS Analysis by Tonnage, 2025 and 2035
  • Figure 28: North America Market Y-o-Y Growth Comparison by Tonnage, 2025-2035
  • Figure 29: North America Market Attractiveness Analysis by Tonnage
  • Figure 30: North America Market Value Share and BPS Analysis by Powertrain Type, 2025 and 2035
  • Figure 31: North America Market Y-o-Y Growth Comparison by Powertrain Type, 2025-2035
  • Figure 32: North America Market Attractiveness Analysis by Powertrain Type
  • Figure 33: Latin America Market Value Share and BPS Analysis by Country, 2025 and 2035
  • Figure 34: Latin America Market Value Share and BPS Analysis by Application, 2025 and 2035
  • Figure 35: Latin America Market Y-o-Y Growth Comparison by Application, 2025-2035
  • Figure 36: Latin America Market Attractiveness Analysis by Application
  • Figure 37: Latin America Market Value Share and BPS Analysis by Tonnage, 2025 and 2035
  • Figure 38: Latin America Market Y-o-Y Growth Comparison by Tonnage, 2025-2035
  • Figure 39: Latin America Market Attractiveness Analysis by Tonnage
  • Figure 40: Latin America Market Value Share and BPS Analysis by Powertrain Type, 2025 and 2035
  • Figure 41: Latin America Market Y-o-Y Growth Comparison by Powertrain Type, 2025-2035
  • Figure 42: Latin America Market Attractiveness Analysis by Powertrain Type
  • Figure 43: Western Europe Market Value Share and BPS Analysis by Country, 2025 and 2035
  • Figure 44: Western Europe Market Value Share and BPS Analysis by Application, 2025 and 2035
  • Figure 45: Western Europe Market Y-o-Y Growth Comparison by Application, 2025-2035
  • Figure 46: Western Europe Market Attractiveness Analysis by Application
  • Figure 47: Western Europe Market Value Share and BPS Analysis by Tonnage, 2025 and 2035
  • Figure 48: Western Europe Market Y-o-Y Growth Comparison by Tonnage, 2025-2035
  • Figure 49: Western Europe Market Attractiveness Analysis by Tonnage
  • Figure 50: Western Europe Market Value Share and BPS Analysis by Powertrain Type, 2025 and 2035
  • Figure 51: Western Europe Market Y-o-Y Growth Comparison by Powertrain Type, 2025-2035
  • Figure 52: Western Europe Market Attractiveness Analysis by Powertrain Type
  • Figure 53: Eastern Europe Market Value Share and BPS Analysis by Country, 2025 and 2035
  • Figure 54: Eastern Europe Market Value Share and BPS Analysis by Application, 2025 and 2035
  • Figure 55: Eastern Europe Market Y-o-Y Growth Comparison by Application, 2025-2035
  • Figure 56: Eastern Europe Market Attractiveness Analysis by Application
  • Figure 57: Eastern Europe Market Value Share and BPS Analysis by Tonnage, 2025 and 2035
  • Figure 58: Eastern Europe Market Y-o-Y Growth Comparison by Tonnage, 2025-2035
  • Figure 59: Eastern Europe Market Attractiveness Analysis by Tonnage
  • Figure 60: Eastern Europe Market Value Share and BPS Analysis by Powertrain Type, 2025 and 2035
  • Figure 61: Eastern Europe Market Y-o-Y Growth Comparison by Powertrain Type, 2025-2035
  • Figure 62: Eastern Europe Market Attractiveness Analysis by Powertrain Type
  • Figure 63: East Asia Market Value Share and BPS Analysis by Country, 2025 and 2035
  • Figure 64: East Asia Market Value Share and BPS Analysis by Application, 2025 and 2035
  • Figure 65: East Asia Market Y-o-Y Growth Comparison by Application, 2025-2035
  • Figure 66: East Asia Market Attractiveness Analysis by Application
  • Figure 67: East Asia Market Value Share and BPS Analysis by Tonnage, 2025 and 2035
  • Figure 68: East Asia Market Y-o-Y Growth Comparison by Tonnage, 2025-2035
  • Figure 69: East Asia Market Attractiveness Analysis by Tonnage
  • Figure 70: East Asia Market Value Share and BPS Analysis by Powertrain Type, 2025 and 2035
  • Figure 71: East Asia Market Y-o-Y Growth Comparison by Powertrain Type, 2025-2035
  • Figure 72: East Asia Market Attractiveness Analysis by Powertrain Type
  • Figure 73: South Asia & Pacific Market Value Share and BPS Analysis by Country, 2025 and 2035
  • Figure 74: South Asia & Pacific Market Value Share and BPS Analysis by Application, 2025 and 2035
  • Figure 75: South Asia & Pacific Market Y-o-Y Growth Comparison by Application, 2025-2035
  • Figure 76: South Asia & Pacific Market Attractiveness Analysis by Application
  • Figure 77: South Asia & Pacific Market Value Share and BPS Analysis by Tonnage, 2025 and 2035
  • Figure 78: South Asia & Pacific Market Y-o-Y Growth Comparison by Tonnage, 2025-2035
  • Figure 79: South Asia & Pacific Market Attractiveness Analysis by Tonnage
  • Figure 80: South Asia & Pacific Market Value Share and BPS Analysis by Powertrain Type, 2025 and 2035
  • Figure 81: South Asia & Pacific Market Y-o-Y Growth Comparison by Powertrain Type, 2025-2035
  • Figure 82: South Asia & Pacific Market Attractiveness Analysis by Powertrain Type
  • Figure 83: Middle East and Africa Market Value Share and BPS Analysis by Country, 2025 and 2035
  • Figure 84: Middle East and Africa Market Value Share and BPS Analysis by Application, 2025 and 2035
  • Figure 85: Middle East and Africa Market Y-o-Y Growth Comparison by Application, 2025-2035
  • Figure 86: Middle East and Africa Market Attractiveness Analysis by Application
  • Figure 87: Middle East and Africa Market Value Share and BPS Analysis by Tonnage, 2025 and 2035
  • Figure 88: Middle East and Africa Market Y-o-Y Growth Comparison by Tonnage, 2025-2035
  • Figure 89: Middle East and Africa Market Attractiveness Analysis by Tonnage
  • Figure 90: Middle East and Africa Market Value Share and BPS Analysis by Powertrain Type, 2025 and 2035
  • Figure 91: Middle East and Africa Market Y-o-Y Growth Comparison by Powertrain Type, 2025-2035
  • Figure 92: Middle East and Africa Market Attractiveness Analysis by Powertrain Type
  • Figure 93: Global Market - Tier Structure Analysis
  • Figure 94: Global Market - Company Share Analysis

Frequently Asked Questions

What is the projected global reach stacker market size by 2035?

The market is expected to reach USD 5.2 billion by 2035, growing at a 4.3% CAGR from USD 3.4 billion in 2025.

Which reach stacker segment holds the largest market share?

Medium tonnage units of 30–45 tons dominate with 55% of the market due to versatility in ports and warehouses.

How much can electric reach stackers reduce fuel consumption?

Electric models cut fuel use by 30-40%, improving operational efficiency and lowering costs.

What percentage of reach stackers use IC engines?

IC engine powered units account for 80% of the market, preferred for heavy-duty continuous operations.

Who is a leading player in the reach stacker market?

Kalmar holds about 9% of the industry share, providing medium tonnage and IC engine reach stackers with advanced safety features.

Explore Similar Insights

Future Market Insights

Reach Stacker Market

Chat With MaRIA

Chat With

MaRIA

Hi There, I am MaRIA, Your Market Research Intelligence Assistant. How may I help you?