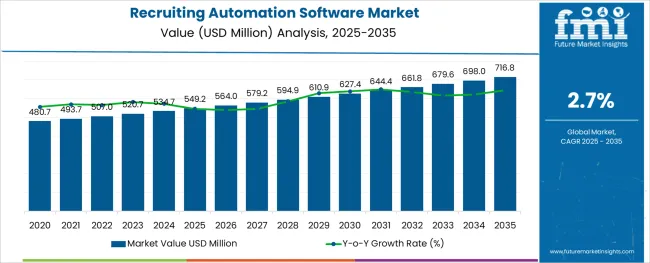
The Recruiting Automation Software Market is estimated to be valued at USD 549.2 million in 2025 and is projected to reach USD 716.8 million by 2035, registering a compound annual growth rate (CAGR) of 2.7% over the forecast period.
The recruiting automation software market is experiencing substantial growth as organizations across industries modernize talent acquisition workflows to enhance efficiency, consistency, and candidate experience. Businesses are increasingly investing in AI-powered platforms capable of automating candidate sourcing, resume screening, communication, and interview scheduling.
Shifts toward hybrid and remote work models have necessitated flexible hiring systems that can scale across geographies while maintaining compliance and visibility. Cloud-native platforms with API integrations into HRMS and ATS ecosystems are enabling real-time collaboration among HR teams, third-party recruiters, and hiring managers.
Moreover, labor market volatility and heightened competition for skilled talent have made speed-to-hire and candidate engagement top priorities, further boosting automation adoption. Future growth is expected to be driven by predictive analytics, AI-based candidate scoring, and conversational recruitment interfaces that reduce hiring friction and elevate talent acquisition performance across enterprise and mid-market levels.
The market is segmented by Type and Application and region. By Type, the market is divided into Cloud-Based and On-Premise. In terms of Application, the market is classified into Large Companies and Small and Medium Companies. Regionally, the market is classified into North America, Latin America, Western Europe, Eastern Europe, Balkan & Baltic Countries, Russia & Belarus, Central Asia, East Asia, South Asia & Pacific, and the Middle East & Africa.
The market is segmented by Type and Application and region. By Type, the market is divided into Cloud-Based and On-Premise. In terms of Application, the market is classified into Large Companies and Small and Medium Companies. Regionally, the market is classified into North America, Latin America, Western Europe, Eastern Europe, Balkan & Baltic Countries, Russia & Belarus, Central Asia, East Asia, South Asia & Pacific, and the Middle East & Africa.
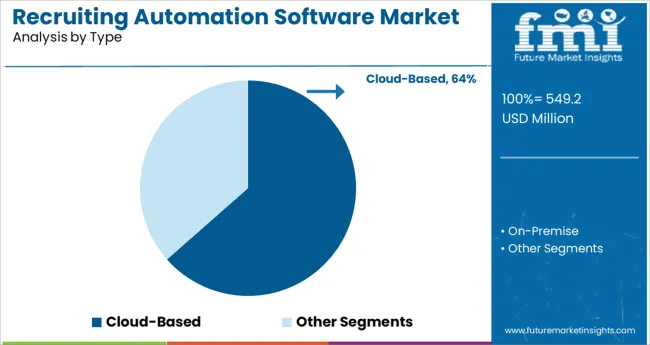
The cloud based segment is projected to hold 63.5% of total revenue in 2025 within the type category, marking it as the leading deployment model. This leadership is attributed to the rapid adoption of SaaS platforms that enable seamless updates, remote accessibility, and scalable architecture.
Enterprises have favored cloud based recruiting automation due to reduced infrastructure costs, faster implementation timelines, and the ability to support distributed hiring teams across locations. The flexibility to integrate with various HR technologies and data lakes has made cloud based systems a strategic asset for companies focusing on agility and data-driven hiring.
Additionally, the ongoing shift toward digital transformation and IT consolidation has reinforced the preference for cloud delivery, particularly among companies scaling hiring in dynamic environments. Enhanced security protocols, customizable workflows, and vendor-provided compliance features have further supported the dominant share of the cloud based segment.
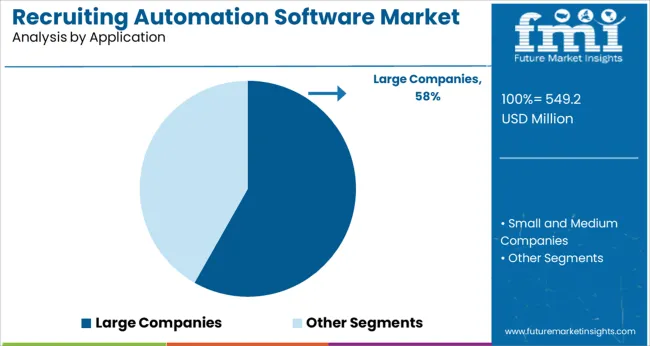
In the application category, large companies are anticipated to account for 58.2% of the market revenue in 2025, maintaining their leading position. This segment’s dominance is being driven by the complex, high-volume recruitment requirements of enterprise organizations that necessitate advanced automation tools.
Large companies often manage multiple job roles across regions, departments, and compliance jurisdictions, creating a strong need for centralized platforms that automate manual tasks and standardize recruitment processes. These organizations are leveraging AI-enabled candidate ranking, multilingual support, automated interview scheduling, and analytics dashboards to improve recruiter productivity and accelerate hiring cycles.
Additionally, the need to ensure consistent employer branding and candidate experience at scale has led to the widespread implementation of end-to-end recruitment automation suites. Investment in such platforms is also being justified through measurable ROI via reduced time-to-fill and improved talent quality, solidifying the leadership of the large companies segment.
The global market for Recruiting Automation software witnessed a CAGR of 1.9% over the last seven years (2020 to 2024). The global market is predicted to surge at a CAGR of 2.7% and record sales worth USD716.8 Million by the end of 2035.
Efficiency and cost benefits, as well as a large pool of applicants, are driving companies to automate their recruitment processes
According to a survey conducted among executives at companies with over 1,000 employees, 62% of employers admitted that they are having trouble dealing with the current labor shortage. Over 78% of the survey participants mentioned that they are both willing and trying to invest in automation to combat this. Inefficient recruitment can greatly hamper a company’s growth, with 40% of CFOs saying that skills shortages are the key deterrent to achieving their goals. Recruiting software is essential to combat these issues since automation of functions like sourcing, screening and the creation of a talent pool can ensure recruiters can find the best possible talent a company needs.
Companies are looking to harness the benefits of automating their recruitment processes through recruitment automation software. Through this software, companies can reduce time spent on mundane tasks like sending mass emails, updating candidates on their progress, and scheduling meetings and interviews. The software also enables and enhances the possibility of recruitment analytics, which can help in making key decisions and improves communication and collaboration both within and across different people that are involved in the recruitment process.
They can also keep track of past applicants and create a rich talent pool. Using this technology, past applicants who showed potential can automatically seek once specific openings suitable to their qualifications will arise. The resultant reduction in costs, improvement in the acquisition of quality talent, and improvement in the time taken for these processes mean that this software is gaining traction.
Emerging talent highly prefers companies that have efficient and up-to-date recruitment processes
According to the USA Census Bureau, Generation Z accounts for 20.3% of the USA population. Studies find that GenZ has a high preference for up-to-date recruitment technology, with 54% saying they would drop out of the application process of companies with outdated methods. They also value relationships with recruiters; with most claiming it has a significant influence on whether they accept job offers.
Out of the respondents to the study, 82% of them believed that a recruitment process should be completed within 2 weeks. Companies who want to hire emerging talent are looking for ways to meet these demands, with the best solution being the adoption of automated recruiting software. This is a significant booster for demand and is expected to continue as GenZ talent enters the workforce.
AI systems that automate mundane processes ensure recruiters can focus on what is important
Using AI, mundane tasks can easily be automated to reduce pressure on recruiting teams. Through this, recruiters can focus more on important tasks, such as skill assessment and personal communication. Using AI, recruiters can reach out to the best possible candidates with factors such as skill level, location, education, and experience.
This process facilitates the mitigation of bias from the initial stages of the recruitment process and provides significant levels of data, which can be used to analyze efficiency and learn from it to make future decisions. Technologies like predictive analytics are also emerging as a solution. Using machine learning technology, companies can factor in data like performance, demography, skillsets, and roles to match a candidate with the best possible role.
Reduction of time spent on mundane tasks and initial processing ensures recruiters are doing their best possible work
A recent survey indicates that 75% of hiring teams predict that hiring in the upcoming years will be challenging, while 84% report burnout due to work. Technology and the automation of recruitment and hiring are essential to enhance the work environment for recruiters. Positive work experience for recruiters is vital to the successful acquisition of talent since they form the core of the functioning of any recruiting process.
According to research, 50% of recruiters would shift companies if the other one had better recruiting software. For this process to function smoothly, employers are looking at harnessing the advantages of software. Recruiters can harness technology to filter through the massive stream of applicants with intelligence platforms and tools like score and rank technologies. When tasks like scheduling, responding to routine or frequently asked questions and basic screening are assigned to automatic software; recruiters can add significant value to their companies. For example, research finds that AI recruiting assistants can reduce nearly 16 hours of work each week for a recruiter.
Large enterprises continue to contribute the most, however small and medium companies can also benefit from adapted versions of Recruiting Automation Software
Large enterprises are the key contributors to demand, with a CAGR of 1.1% from 2020 to 2025 and a forecasted CAGR of 2.3% in the forecast period of 2025 to 2035. This is large because large enterprises have a significantly higher number of candidates and applicants. They also tend to have a larger number of employees and job openings. They benefit greatly from the collaboration possibilities this software provides, with the ability to share data across teams, and with managers. While Small and Medium Businesses also benefit from the automation of recruiting software, they may not require some of the features it provides on a larger scale and can thus avail of cheaper versions with limited features.
Europe is an emerging center for demand or recruiting automation software and remains the leader with a 25.2% market share in 2024 and a predicted market size of USD 716.8 Million by 2035. According to a study conducted in European countries, it takes a candidate an average of 6 minutes and 11 seconds to apply to major jobs, with an average of 27 clicks in 2024 as compared to 41 in 2020. The integrations with social media enabled by the software are showing growth, with 47% of companies in 2024 having an application accessible through social media as compared to 18% in 2020.
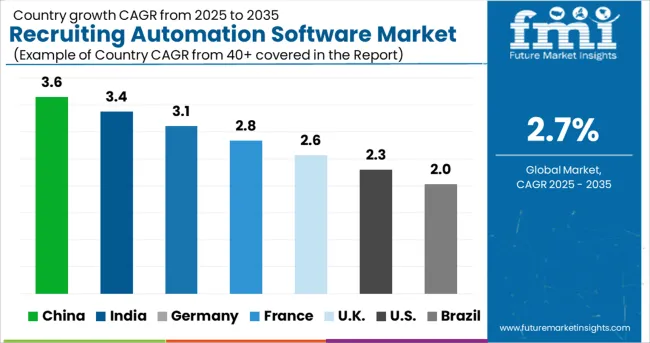
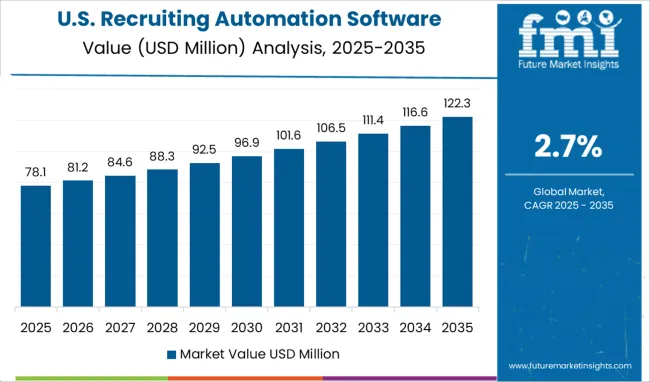
The USA accounted for over 35% of the global Recruiting Automation Software Market in 2024. North America and the US have large amounts of consumer expenditure. The USA is also home to large companies, which have both large volumes of applicants as well as a large number of job openings. The USA is expected to account for a USD 549.2 Million absolute dollar opportunity between 2025 and 2035 and a forecasted market size of USD 716.8 Million by 2035.
On-Premise Automation is currently the leading type of Recruiting automation Software, with a CAGR of 1.4% from 2020 to 2024 and a forecasted CAGR of 2.5% from 2025 to 2035. They are preferred by organizations that require specific, tailored systems and the security benefits of having only the required teams accessing the system as well as the ability to control for any complications since the control remains internal. For these reasons, the companies are willing to pay higher costs associated with On-Premise Software.
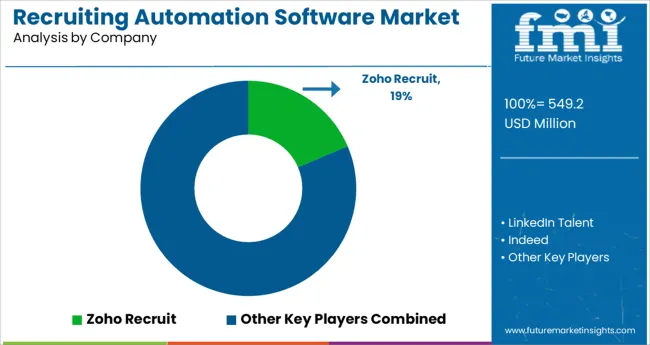
At present, Recruiting Automation Software providers are focused on developments that will ensure further simplification of mundane processes, as well as automation of initial tests and screenings. The key companies operating in the market include Zoho, Recruit, LinkedIn Talent, Indeed, Hiretual, SmartRecruiters, Samanage Ltd., Entelo, Dice, Beamery, CareerBuilder, JobDiva, JazzHR, Greenhouse, Bullhorn, ZipRecruiter.
Some of the recent development in Recruiting Automation Software are as follows:
Similarly, the team at Future Market Insights has tracked recent developments related to Recruiting Automation Software companies, which is available in the full report.
The global recruiting automation software market is estimated to be valued at USD 549.2 million in 2025.
It is projected to reach USD 716.8 million by 2035.
The market is expected to grow at a 2.7% CAGR between 2025 and 2035.
The key product types are cloud-based and on-premise.
large companies segment is expected to dominate with a 58.2% industry share in 2025.


Our Research Products

The "Full Research Suite" delivers actionable market intel, deep dives on markets or technologies, so clients act faster, cut risk, and unlock growth.

The Leaderboard benchmarks and ranks top vendors, classifying them as Established Leaders, Leading Challengers, or Disruptors & Challengers.

Locates where complements amplify value and substitutes erode it, forecasting net impact by horizon

We deliver granular, decision-grade intel: market sizing, 5-year forecasts, pricing, adoption, usage, revenue, and operational KPIs—plus competitor tracking, regulation, and value chains—across 60 countries broadly.

Spot the shifts before they hit your P&L. We track inflection points, adoption curves, pricing moves, and ecosystem plays to show where demand is heading, why it is changing, and what to do next across high-growth markets and disruptive tech

Real-time reads of user behavior. We track shifting priorities, perceptions of today’s and next-gen services, and provider experience, then pace how fast tech moves from trial to adoption, blending buyer, consumer, and channel inputs with social signals (#WhySwitch, #UX).

Partner with our analyst team to build a custom report designed around your business priorities. From analysing market trends to assessing competitors or crafting bespoke datasets, we tailor insights to your needs.
Supplier Intelligence
Discovery & Profiling
Capacity & Footprint
Performance & Risk
Compliance & Governance
Commercial Readiness
Who Supplies Whom
Scorecards & Shortlists
Playbooks & Docs
Category Intelligence
Definition & Scope
Demand & Use Cases
Cost Drivers
Market Structure
Supply Chain Map
Trade & Policy
Operating Norms
Deliverables
Buyer Intelligence
Account Basics
Spend & Scope
Procurement Model
Vendor Requirements
Terms & Policies
Entry Strategy
Pain Points & Triggers
Outputs
Pricing Analysis
Benchmarks
Trends
Should-Cost
Indexation
Landed Cost
Commercial Terms
Deliverables
Brand Analysis
Positioning & Value Prop
Share & Presence
Customer Evidence
Go-to-Market
Digital & Reputation
Compliance & Trust
KPIs & Gaps
Outputs
Full Research Suite comprises of:
Market outlook & trends analysis
Interviews & case studies
Strategic recommendations
Vendor profiles & capabilities analysis
5-year forecasts
8 regions and 60+ country-level data splits
Market segment data splits
12 months of continuous data updates
DELIVERED AS:
PDF EXCEL ONLINE
Automation Testing Market Size and Share Forecast Outlook 2025 to 2035
Automation COE Market Insights by Organization Size, Service Type, End User Verticals, and Region through 2035
Lab Automation Market Growth – Size, Trends & Forecast 2025 to 2035
Home Automation Sensors Market Size and Share Forecast Outlook 2025 to 2035
Home Automation Market Analysis by Product, Application, Networking Technology, and Region Through 2035
Hyperautomation Market
Form Automation Software Market – Digitizing Workflows
Water Automation & Instrumentation Market Trends & Forecast by Process Stage, Automation Technology, Instrumentation, End-User and Region through 2035
Retail Automation Market Size and Share Forecast Outlook 2025 to 2035
Postal Automation Systems Market Size and Share Forecast Outlook 2025 to 2035
Milking Automation Market Size and Share Forecast Outlook 2025 to 2035
Process Automation and Instrumentation Market Size and Share Forecast Outlook 2025 to 2035
Network Automation Market - AI & Cloud Connectivity 2025 to 2035
Factory Automation And Industrial Controls Market Growth - Trends & Forecast 2025 to 2035
Machine Automation Controller Market Growth – Trends & Forecast 2025 to 2035
Medical Automation Market Analysis - Innovations & Forecast 2025 to 2035
Evaluating Process Automation and Instrumentation Market Share & Provider Insights
Content Automation AI Tools Market
Building Automation System Market Size and Share Forecast Outlook 2025 to 2035
Building Automation System Industry Analysis in Korea Analysis - Size, Share, and Forecast Outlook 2025 to 2035

Thank you!
You will receive an email from our Business Development Manager. Please be sure to check your SPAM/JUNK folder too.
Chat With
MaRIA