
- Market Size (2026)
- USD 80.9 Bn
- Forecast (2036)
- USD 160.6 Bn
- CAGR (2026 to 2036)
- 7.1%
How big is Recycled Scrap Metal Market in 2026?
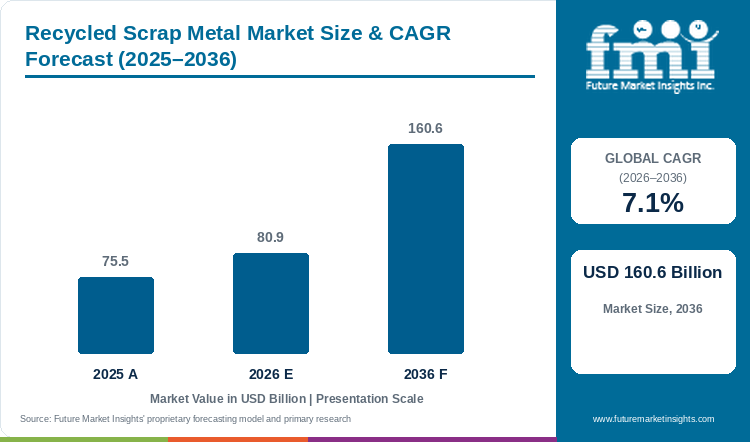
The recycled scrap metal market is estimated at USD 75.5 billion in 2025 and is expected to reach USD 80.9 billion in 2026. Recycled scrap metal sales are projected to grow at a 7.1% CAGR and reach USD 160.6 billion by 2036.
Sales of recycled scrap metal are highest in ferrous grades, as electric arc furnace mills charge shredded and heavy melting steel into every heat. Recycled scrap metal sold through yards and shredders is estimated at USD 75.5 billion in 2025 and is likely to reach USD 80.9 billion in 2026. FMI's model shows the recycled scrap metal market at USD 160.6 billion by 2036 on a 7.1% CAGR. Steelmakers behind tariff walls are running furnaces harder. Nucor ran mills at 91% utilization in the quarter to 4 July 2026, and scrap processing output at the company rose 11% on a year earlier to 1,285 thousand tons.[1] Fuller furnace schedules pull shredded and prime grades into domestic melt shops, so processors near mill clusters sell more tonnes at home.
Two of Porter's five forces, buyer power and the threat of substitutes, press hardest on scrap sellers. A small group of steelmakers buys most ferrous scrap, and Nucor also made 1,098 thousand tons of direct reduced iron in the same quarter, up 12%.[1] Large mills can switch between purchased scrap, own-yard scrap and DRI, so the mill sets the price for independent dealers. With mill-owned yards bidding for the same tonnes as the market leaders, competitive pressure is reshaping the recycled scrap metal market, and independent yards protect margins by locking in flows from demolition and scrapped cars.
Key Market Trends & Insights
- Demand for ferrous grades is expected to account for an estimated 74.4% of metal type sales in 2026, with aluminum near 11.8% and copper about 8.6%. Steel Dynamics recycling operations shipped 1,702,125 gross tons of ferrous scrap in the September 2026 quarter, against 1,590,153 a year earlier.[2]
- Obsolete steel and metal from demolished buildings, scrapped vehicles and old appliances gives post-consumer scrap an estimated 57.5% of source type sales in 2026, and offcuts from stamping and machining plants supply the other 42.5%.
- Car bodies, engine blocks and press shop offcuts make automotive the largest end use, likely to hold 27.8% in 2026, with equipment and tools near 18.9% and building and construction about 16.5%.
Regional Highlights
- Steelmakers in the United Kingdom moving from blast furnaces to electric furnaces give the country a 7.9% CAGR in FMI's projections, the highest rate in the profiled set.
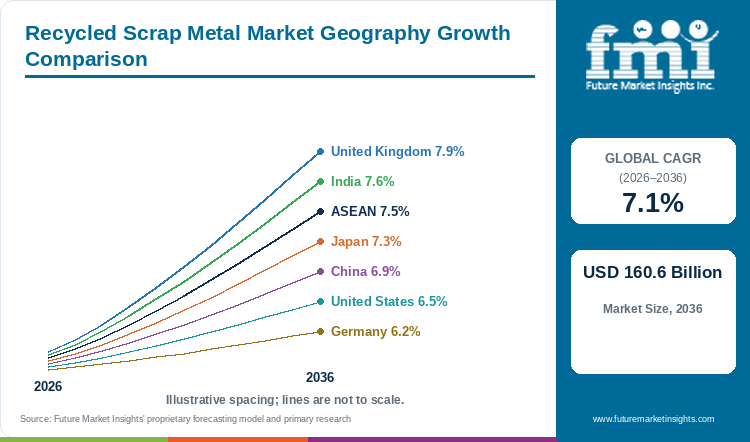
- India and ASEAN follow within half a point of the United Kingdom, and Japan grows near 7.3%. Weak steel demand and a proposed EU export curb leave Germany at 6.2%, the lowest profiled rate and almost a full point behind the 7.1% rate for the recycled scrap metal market.
- Japan exported 4.47 million tonnes of steel scrap from January to August 2026, 9.5% less than a year earlier, customs data compiled by SteelOrbis show.[3]
Market Size & Forecast
Table 1: Market Size and Forecast for the Recycled Scrap Metal Market (USD billion and percentage), 2025 to 2036
| Metric | Value |
|---|---|
| 2025 Market Size | USD 75.5 billion |
| Estimated Market Size in 2026 | USD 80.9 billion |
| Projected Market Size by 2036 | USD 160.6 billion |
| CAGR, 2026 to 2036 | 7.1% |
| Added Revenue, 2026 to 2036 | USD 79.7 billion |
| Market Expansion Multiple | 2.0x |
Scrap orders follow mill melt schedules, and yards see bids change within weeks of a shift in finished steel orders. Steel Dynamics reported that average ferrous scrap cost per ton melted at the company's mills fell USD 8 to USD 404 in July to September 2026, and metals recycling operating income dropped to USD 33 million from USD 47.8 million in the prior quarter.[2] Sims Limited expects US tariffs to keep protecting domestic steelmakers, which supports ferrous scrap demand, and the company also named new EAF capacity and data centre construction as support.[4] Demolition contractors crush concrete and cut out rebar on the same sites, and the recycled concrete aggregates market is likely to expand at an 8% CAGR as old housing and offices come down, pointing to steady flows of obsolete steel reaching yards. The FMI outlook gives the recycled scrap metal market close to USD 79.7 billion of additional sales by 2036, with the 2036 figure about double the 2026 base. Chinese steel exports are the main risk, since Sims Limited expects them to keep pressure on ferrous prices through fiscal 2027.[4]
Non-Ferrous Margins, Export Rules and Shifting Trade Flows
Copper and aluminum recovery is earning far higher margins per tonne than steel. Aurubis grew Multimetal Recycling operating EBT to EUR 87 million in the nine months to June 2026, from EUR 36 million a year before, and commissioned the EUR 190 million Complex Recycling Hamburg plant in July 2026.[5] Nonferrous shipments at Steel Dynamics fell to 201.7 million pounds in Q3 2026 from 242.8 million pounds a year earlier.[2] Smelters with new recycling furnaces will bid harder for cable, electronics and shredder residue, so processors with eddy current and sensor sorting lines will gain the most.
Export rules are redrawing scrap routes. The European Commission published a draft list on 18 September 2026 that proposes only 5 of the 24 countries applying for EU metal waste for authorisation from 21 May 2027.[6] Japanese exporters cut shipments to Vietnam by 15.8% to 1.82 million tonnes over January to August 2026, and sales to Bangladesh grew 28.1% to 1.07 million tonnes.[3] Scrap kept inside Europe and Japan will soften local prices for mills, and importing countries in South Asia will turn to other suppliers.
Table 2: Mill, Recycler and Trade Indicators for the Recycled Scrap Metal Market (volumes, prices and earnings), 2026
| Indicator | Data Point | Relevance | Source |
|---|---|---|---|
| Nucor scrap processing output, Q2 2026 | 1,285 thousand tons; up 11% | Mill-owned yards add volume. | [1] |
| Steel Dynamics ferrous scrap cost melted, Q3 2026 | USD 404 per ton; down USD 8 | Scrap prices eased in the September quarter. | [2] |
| Sims Limited proprietary intake, FY26 | 6.4 million tonnes; up 4.9% | Independent processors are buying more scrap. | [4] |
| Aurubis Multimetal Recycling operating EBT, 9M 2025/26 | EUR 87 million; prior year EUR 36 million | Non-ferrous recovery margins improved. | [5] |
| Japan steel scrap exports, January to August 2026 | 4.47 million tonnes; down 9.5% | More scrap stays in Japan. | [3] |
| EU draft list for metal waste exports, September 2026 | 5 of 24 applicant countries proposed | Fewer outlets for EU scrap from May 2027. | [6] |
Analyst Perspective
“Scrap has become a strategic input for steelmakers, and I expect yards with long-term supply agreements with electric furnace mills to earn the steadiest margins through 2036. The larger opening is non-ferrous recovery from cables, electronics and shredder residue, since each tonne of recovered copper or aluminum carries many times the value of a tonne of steel.”
- Nikhil Kaitwade, Principal Consultant, Future Market Insights.
How is the recycled scrap metal market segmented?
The market is segmented into metal type, source type, end use, and region. Ferrous scrap is expected to lead metal type sales with an estimated 74.4% share in 2026, and post-consumer material leads source type with about 57.5%.
By metal type: ferrous, aluminum, copper, precious metals, and zinc, tin and others.
By source type: post-consumer scrap, and production scrap.
By end use: automotive, building and construction, consumer electronics, packaging, equipment and tools, art, decor and home furnishings, jewellery, and others.
By region: scrap yards, shredders, smelters and melt shops in North America, Latin America, Western Europe, Eastern Europe, East Asia, South Asia and Pacific, and Middle East and Africa.
Why does ferrous scrap lead recycled scrap metal sales by metal type?
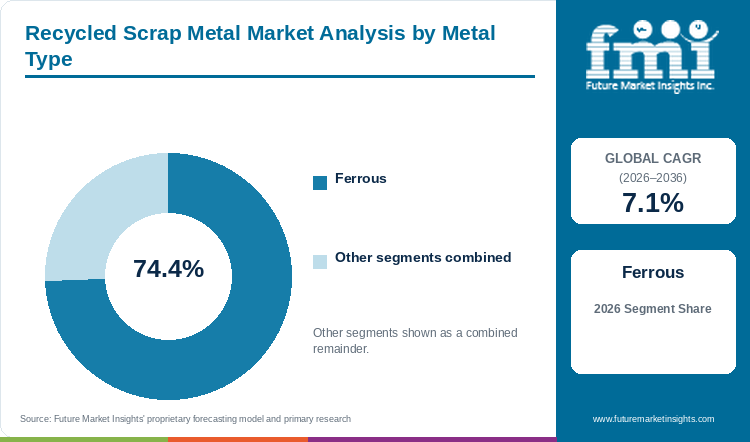
An estimated 74.4% of metal type sales in 2026 is expected to come from ferrous scrap, against about 11.8% for aluminum and roughly 8.6% for copper.
Table 3: Metal Type Share for the Recycled Scrap Metal Market (percentage share), 2026
| Metal Type | Estimated Share (2026) |
|---|---|
| Ferrous | 74.4% |
| Aluminum | 11.8% |
| Copper | 8.6% |
| Zinc, Tin and Others | 3.3% |
| Precious Metals | 1.9% |
| Total | 100.0% |
Table 4: Metal Type Leadership and Market Growth for the Recycled Scrap Metal Market (segment and CAGR percentage), 2026 to 2036
| Metric | Value |
|---|---|
| Global CAGR (2026 to 2036) | 7.1% |
| Leading Segment | Ferrous |
In 2026, ferrous scrap is forecast to lead with 74.4% share, as every electric arc furnace heat starts with a charge of shredded, plate and structural steel. Aluminum, at an estimated 11.8%, fetches a higher price per tonne, though can, extrusion and casting scrap reaches yards in far smaller tonnages. Copper, near 8.6%, carries the highest value per tonne among base metals, and refiners such as Aurubis compete for cable and granulate lots. Zinc, tin and other metals, about 3.3%, come from galvanising dross, solder and alloy turnings in small lots. Precious metals, an estimated 1.9%, are recovered from electronics and catalysts and sell by the gram. A mill buyer comparing grades will keep ferrous scrap at the centre of each melt plan, since no other metal supplies iron units at furnace scale.
- Most ferrous tonnage reaching mills is heavy melting steel, shredded car scrap, plate and structural cuttings, or busheling from stamping plants.
- Nucor ran steel mills at 91% utilization in Q2 2026, 500 basis points above the first quarter.[1]
Why does post-consumer scrap lead recycled scrap metal sales by source type?
About 57.5% of source type sales in 2026 is projected for post-consumer scrap, against 42.5% for production scrap.
Table 5: Source Type Share for the Recycled Scrap Metal Market (percentage share), 2026
| Source Type | Estimated Share (2026) |
|---|---|
| Post-Consumer Scrap | 57.5% |
| Production Scrap | 42.5% |
| Total | 100.0% |
Demolished buildings, scrapped cars, old appliances and retired cables reach yards in every city. For that reason, post-consumer scrap is predicted to lead source type sales with 57.5% share in 2026. Production scrap, an estimated 42.5%, is cleaner and easier to sort, so mills pay a premium for busheling and new clips. Volume of production scrap follows factory output at stamping, machining and can plants, and those plants recycle offcuts on fixed contracts. Sims Limited raised proprietary intake 4.9% to 6.4 million tonnes in fiscal 2026.[4] A mill planning a charge will buy prime production scrap first and fill the rest of each heat with shredded obsolete material, which keeps post-consumer tonnage ahead.
- Demolition steel, end-of-life vehicles, white goods and used beverage cans form the post-consumer stream.
- Sims Limited announced FY26 sales of A$8,007.5 million in August 2026, 6.9% above the prior year.[4]
Why does automotive lead recycled scrap metal sales by end use?
Automotive is estimated to hold 27.8% of end use sales in 2026, ahead of equipment and tools at about 18.9% and building and construction near 16.5%.
Table 6: End Use Share for the Recycled Scrap Metal Market (percentage share), 2026
| End Use | Estimated Share (2026) |
|---|---|
| Automotive | 27.8% |
| Equipment and Tools | 18.9% |
| Building and Construction | 16.5% |
| Packaging | 11.4% |
| Consumer Electronics | 9.7% |
| Others | 7.9% |
| Art, Decor and Home Furnishings | 4.6% |
| Jewellery | 3.2% |
| Total | 100.0% |
Car bodies, engines and wheels return as shredded steel and cast aluminum, and press shops sell clean stamping offcuts every week, so automotive is likely to lead end use in 2026 with 27.8% share. Equipment and tools, about 18.9%, yield heavy cast iron and alloy steel at the end of machine life. Stainless mills charge nickel and chrome scrap from tools and kitchen equipment into each melt, and with the stainless steel market likely to increase at a 5.4% CAGR on kitchen and process equipment orders, those alloy grades stay in demand. Building and construction, near 16.5%, supply rebar, beams and copper pipe from demolition in uneven batches. Packaging, an estimated 11.4%, follows beverage can and steel tin collection. Consumer electronics, about 9.7%, give copper, gold and palladium in small, costly lots, and decor, jewellery and other uses share the remaining 15.7%. A yard planning collection routes will favour dismantlers and press shops first, since car scrap arrives in steady, sortable loads.
- Shredded car bodies, engine blocks, aluminum wheels and press shop offcuts make up most automotive scrap.
- Steel Dynamics shipped 201.7 million pounds of nonferrous scrap in the third quarter of 2026, down from 242.8 million pounds a year earlier.[2]
What are the drivers, restraints, and opportunities in the recycled scrap metal market?
Electric furnace steelmaking and recycled content goals keep mills buying more scrap. Volatile prices and export curbs strain processors, and non-ferrous recovery from electronics and cables opens new margin.
- Driver: Steelmakers replacing blast furnaces with electric furnaces need far more scrap per tonne of steel, so each conversion adds a long-term buyer for processed ferrous grades.
- Restraint: Scrap prices swing with steel orders and cheap steel imports, which leaves yards holding stock bought at higher prices whenever mills cut bids.
- Opportunity: Copper, aluminum and precious metals locked inside cables, electronics and shredder residue reward processors with advanced sorting. Each recovered tonne carries high value.
Electric Furnace Conversions Add Scrap Buyers
Each switch to electric arc furnaces turns scrap from a by-product into the main feed for steel. The UK Steel Strategy of 19 March 2026 moves production toward electric furnaces and commits government to a cross-government Scrap Working Group by May 2026.[7] Scrap provided nearly 21% of crude steel production in India, a Ministry of Steel official told IMRC 2026 in January, and the country targets 300 million tonnes of steel capacity by 2030.[8] Each new furnace adds a buyer that needs scrap every day, so processors near new melt shops will gain the most volume.
Price Swings and Export Curbs Strain Yards
Producers of processed scrap carry inventory risk every time steel orders turn. Realized ferrous scrap prices at Steel Dynamics fell USD 15 per gross ton from the June quarter to the September quarter of 2026.[2] The EU draft list leaves 19 of the 24 countries that applied for metal waste without authorisation, with a consultation running from 18 September to 16 October 2026.[6] Pellet-fed DRI plants offer mills another iron unit. The iron ore pellet market is predicted to rise at a 6.1% CAGR as gas-based DRI capacity grows, so scrap sellers will face a virgin substitute in every price talk. Yards with hedged stock and long-term mill contracts will ride out those swings with the least margin loss.
Non-Ferrous Recovery Opens New Margin
Recovery of copper, aluminum and precious metals from complex scrap pays far more per tonne than shredding steel. Aurubis commissioned Complex Recycling Hamburg in July 2026 to process copper-, lead- and sulfur-bearing recycling materials.[5] Sims Limited expects the factors behind strong non-ferrous demand and prices in fiscal 2026 to remain supportive in fiscal 2027.[4] Alloy producers remelt sorted aluminum and copper, and growth of the metal alloys market at a 4.5% CAGR will keep clean non-ferrous grades in demand. Processors adding sensor sorting will sell more material at alloy-grade prices, giving cable and electronics recovery a second growth engine.
Which country CAGRs are profiled in the recycled scrap metal market?
Table 7: Country CAGR Comparison for the Recycled Scrap Metal Market (CAGR percentage), 2026 to 2036
| Country | CAGR (2026 to 2036) |
|---|---|
| United Kingdom | 7.9% |
| India | 7.6% |
| ASEAN | 7.5% |
| Japan | 7.3% |
| China | 6.9% |
| United States | 6.5% |
| Germany | 6.2% |
How do country-level CAGRs compare in the recycled scrap metal market?
Tariffs of up to 50% on out-of-quota steel imports from July 2026 are planned by the UK government, together with up to GBP 2.5 billion of support for steelmakers.[7] Protected domestic melting favours British scrap merchants, and FMI's model shows the United Kingdom growing at 7.9% against the 7.1% CAGR for the recycled scrap metal market. India is close behind at 7.6%, as new furnaces add steel capacity. ASEAN grows near 7.5% on rebar and billet mills that import scrap. Japan is projected at 7.3% as exporters keep more scrap at home. China is expected to grow at 6.9%, with cheap steel exports holding down scrap prices. The United States, at 6.5%, already melts most domestic scrap in a mature electric furnace fleet. Weak domestic steel output holds Germany at 6.2%, the slowest profiled rate.
- British merchants are gaining domestic buyers as steelmaking shifts to electric furnaces under the 2026 Steel Strategy.
- Steelmakers in India are adding capacity toward a 300 million tonne target for 2030.
- Vietnamese and Thai mills buy imported scrap for billet and rebar.
- Japanese exporters are shipping less scrap abroad.
- Steel exports from China weigh on scrap prices in markets without tariff protection.
- American mills running behind tariffs keep ferrous scrap bids firm.
- German recyclers face weak domestic steel output and a proposed EU export curb.
Full report country CAGRs cover: The United Kingdom, India, ASEAN and Japan grow faster than the recycled scrap metal market at 7.1%, China, the United States and Germany grow slower, and the full study summarises Latin America, Eastern Europe and Middle East and Africa at regional level.
Country-wise Analysis
United Kingdom Recycled Scrap Metal Market Outlook (2026 to 2036)
British steelmakers are moving production toward electric arc furnaces, which melt mostly recycled steel, under the Steel Strategy published on 19 March 2026.[7] The strategy aims to raise domestic steel output from about 30% of national demand to 40% to 50%, and new trade measures start in July 2026.[7] More domestic melting means British merchants will sell a larger share of shredded and heavy melting grades to home mills. FMI projects a 7.9% CAGR for the country.
Key takeaway: Electric furnace conversion turns British scrap toward home mills.
India Recycled Scrap Metal Market Outlook (2026 to 2036)
Scrap provided nearly 21% of crude steel production in India, and scrap availability is estimated to rise to nearly 36 million tonnes, a Ministry of Steel official said at IMRC 2026 in Jaipur on 20 to 22 January 2026.[8] The Material Recycling Association of India asked for GST on scrap to fall to 5% and for the import duty on aluminium scrap to be removed.[8] Induction and electric furnace mills will absorb domestic and imported scrap as capacity grows toward 300 million tonnes, which supports a 7.6% CAGR.
Key takeaway: Capacity expansion makes India a fast-growing scrap buyer.
ASEAN Recycled Scrap Metal Market Outlook (2026 to 2036)
Vietnam imported 1.82 million tonnes of Japanese steel scrap over January to August 2026, 15.8% less than a year before, and Thailand bought 338,652 tonnes, up from 140,341 tonnes.[3] Rebar and billet mills in Vietnam, Thailand and Indonesia melt imported scrap for construction steel. Domestic collection will grow as car and appliance stocks age, and ASEAN is expected to grow at 7.5%.
Key takeaway: Import-fed rebar mills set the pace across ASEAN.
Japan Recycled Scrap Metal Market Outlook (2026 to 2036)
Japanese steel scrap exports fell 17.4% to 422,961 tonnes in August 2026 from 512,031 tonnes a year before.[3] Electric furnace steelmakers in Japan are keeping more domestic scrap, and Japan grows at 7.3% in the FMI outlook, close to the recycled scrap metal market as a whole. Car dismantlers and demolition firms supply most of that scrap, so yard volumes will follow vehicle scrappage and building renewal.
Key takeaway: Lower exports keep Japanese scrap in domestic furnaces.
China Recycled Scrap Metal Market Outlook (2026 to 2036)
Sims Limited said in August 2026 that Chinese steel exports are expected to keep pressure on ferrous markets in fiscal 2027, most of all in regions without steel tariff protection.[4] Chinese mills will buy more domestic obsolete scrap as the stock of buildings, cars and appliances ages, and China is projected to grow at 6.9%.
Key takeaway: Ageing steel stock adds scrap in China, and exports keep prices soft.
United States Recycled Scrap Metal Market Outlook (2026 to 2036)
North America Metal at Sims Limited grew underlying EBIT 69.7% to A$135.9 million in fiscal 2026.[4] Steel Dynamics paid an average of USD 404 per ton for ferrous scrap melted in Q3 2026, USD 8 less than in the June quarter.[2] FMI places the United States at a 6.5% CAGR, as a mature electric furnace fleet already melts most domestic scrap. Tariffs on imported steel will keep domestic mills running near full utilization and keep bids for shredded scrap firm.
Key takeaway: Tariff-protected mills keep demand steady in the United States.
Germany Recycled Scrap Metal Market Outlook (2026 to 2036)
Aurubis grew nine-month operating EBT 31% to EUR 374 million and commissioned the EUR 190 million Complex Recycling Hamburg plant in July 2026.[5] The draft EU list proposes authorisation for Moldova, Montenegro, North Macedonia, Serbia and Ukraine only, among 24 applicants for metal waste.[6] German yards will sell more scrap to European mills and smelters at softer prices, and Germany is expected to grow at 6.2%.
Key takeaway: Export curbs and weak steel output hold Germany at the bottom of the table.
Who are the notable companies in the recycled scrap metal market?
Sims Limited, Nucor, OmniSource (Steel Dynamics), ArcelorMittal, Aurubis, American Iron & Metal, DBW Metals Recycling, Kuusakoski, Metallon Recycling and TKC Metal Recycling are the profiled companies.
Ten companies are profiled by FMI, spanning mill-owned recyclers, a copper smelter with a large recycling segment and independent processors. Sims Limited grew FY26 underlying EBIT 167.6% to A$468.0 million, and SA Recycling, the joint venture of Sims in the United States, contributed A$235.5 million.[4] Raw Materials adjusted EBT at Nucor was USD 146 million in Q2 2026, against USD 57 million a year earlier.[1] Aurubis earned EUR 87 million of operating EBT in Multimetal Recycling over nine months.[5]
- Mill-owned recyclers and steelmakers: Nucor, OmniSource (Steel Dynamics) and ArcelorMittal.
- Metal smelters with recycling segments: Aurubis.
- Independent scrap processors: Sims Limited, American Iron & Metal, DBW Metals Recycling, Kuusakoski, Metallon Recycling and TKC Metal Recycling.
Competitive Benchmarking: Recycled Scrap Metal Market
Table 8: Competitive Benchmarking for the Recycled Scrap Metal Market (qualitative documentation ratings), 2026
| Company | Ferrous Volume | Non-Ferrous Range | Mill Integration | Recency |
|---|---|---|---|---|
| Sims Limited | High | High | Medium | High |
| Nucor | High | Low | High | High |
| OmniSource (Steel Dynamics) | High | Medium | High | High |
| Aurubis | Low | High | Low | High |
| ArcelorMittal | Medium | Low | High | Low |
Scores here follow what each company disclosed about scrap in results and releases dated in 2026, and the scores do not rank market share.
Key Developments in the Recycled Scrap Metal Market
- On 19 October 2026, Steel Dynamics reported third-quarter metals recycling operating income of USD 33 million.[2]
- On 29 September 2026, SteelOrbis reported that Japanese steel scrap exports fell 9.5% over January to August 2026.[3]
- On 24 September 2026, BIR urged members to respond to the European Commission draft list on metal waste exports.[6]
- On 18 August 2026, Sims Limited announced fiscal 2026 underlying EBIT of A$468.0 million.[4]
- On 6 August 2026, Aurubis moved full-year guidance to the upper end of the forecast range.[5]
- On 28 July 2026, Nucor presented second-quarter results with steel mill shipments of 7.1 million tons.[1]
- On 19 March 2026, the UK government published a Steel Strategy with a Scrap Working Group due by May 2026.[7]
- On 22 January 2026, a Ministry of Steel official told IMRC 2026 that demand for steel scrap in India will increase sharply.[8]
Key Players in the Recycled Scrap Metal Market
Mill-Owned Recyclers and Steelmakers
- Nucor
- OmniSource (Steel Dynamics)
- ArcelorMittal
Metal Smelters with Recycling Segments
- Aurubis
Independent Scrap Processors
- Sims Limited
- American Iron & Metal
- DBW Metals Recycling
- Kuusakoski
- Metallon Recycling
- TKC Metal Recycling
Recycled Scrap Metal Market - Report Scope
Table 9: Report Scope for the Recycled Scrap Metal Market (coverage fields and definitions), 2026 to 2036
| Coverage field | Report scope |
|---|---|
| Market breakdown | Metal type; source type; end use; region |
| Quantitative units | USD billion |
| Market definition | Processed ferrous and non-ferrous scrap sold for remelting, including iron and steel, aluminum, copper, precious metals, zinc and tin, from post-consumer and production sources. |
| Regions covered | North America; Latin America; Western Europe; Eastern Europe; East Asia; South Asia and Pacific; Middle East and Africa |
| Countries covered | United States; Canada; Brazil; Mexico; Argentina; Chile; Germany; France; United Kingdom; Italy; Spain; Benelux; Nordics; Poland; Czech Republic; Romania; Hungary; China; Japan; South Korea; India; ASEAN; Australia and New Zealand; GCC Countries; South Africa; Türkiye; Israel |
| Key companies profiled | Sims Limited, Nucor, OmniSource (Steel Dynamics), ArcelorMittal, Aurubis, American Iron & Metal, DBW Metals Recycling, Kuusakoski, Metallon Recycling, TKC Metal Recycling |
| Forecast period | 2026 to 2036 |
Recycled Scrap Metal Market - Research Methodology
Table 10: Research Methodology for the Recycled Scrap Metal Market (research methods and approach), 2026 edition
| Method | Approach |
|---|---|
| Data Sources | Steelmaker and recycler results, smelter releases, government steel strategies, customs-based trade press and recycling association statements from May 2025 onward. |
| Desk Research | Desk research covers mill utilization, scrap prices, export rules, non-ferrous recovery and trade flows. |
| Market Sizing and Forecasting | Sizing starts from the 2026 base of USD 80.9 billion and the 7.1% CAGR for the 2026 to 2036 period. |
| Data Validation | Volumes, prices and earnings were checked against the company, government body or trade publication that reported them. |
Recycled Scrap Metal Market by Segments
Recycled Scrap Metal Market segmented by Metal Type:
- Ferrous
- Aluminum
- Copper
- Precious Metals
- Zinc, Tin and Others
Recycled Scrap Metal Market segmented by Source Type:
- Post-Consumer Scrap
- Production Scrap
Recycled Scrap Metal Market segmented by End Use:
- Automotive
- Building and Construction
- Consumer Electronics
- Packaging
- Equipment and Tools
- Art, Decor and Home Furnishings
- Jewellery
- Others
Recycled Scrap Metal Market by Region
- North America
- United States
- Canada
- Latin America
- Brazil
- Mexico
- Argentina
- Chile
- Western Europe
- Germany
- France
- United Kingdom
- Italy
- Spain
- Benelux
- Nordics
- Eastern Europe
- Poland
- Czech Republic
- Romania
- Hungary
- East Asia
- China
- Japan
- South Korea
- South Asia and Pacific
- India
- ASEAN
- Australia and New Zealand
- Middle East and Africa
- GCC Countries
- South Africa
- Türkiye
- Israel
Research Sources and Bibliography
- [1] Nucor Corporation. (2026, July 28). Second Quarter 2026 Earnings Call presentation (Form 8-K, Exhibit 99.2). https://www.sec.gov/Archives/edgar/data/0000073309/000119312526318190/d468854dex992.htm
- [2] Steel Dynamics, Inc. (2026, October 19). Steel Dynamics Reports Third Quarter 2026 Results (Form 8-K, Exhibit 99.1). https://www.sec.gov/Archives/edgar/data/0001022671/000110465926117217/tm2627861d2_ex99-1.htm
- [3] SteelOrbis. (2026, September 29). Japan's steel scrap exports down 9.5 percent in January-August 2026. https://www.steelorbis.com/steel-news/latest-news/japans-steel-scrap-exports-down-95-percent-in-january-august-2026-1480433.htm
- [4] Sims Limited. (2026, August 18). Sims Limited Announces Fiscal 2026 Full Year Results (ASX and media release). https://announcements.asx.com.au/asxpdf/20260818/pdf/072vvg8t3f5p9w.pdf
- [5] Aurubis AG. (2026, August 6). Aurubis moves full-year guidance to upper end of forecast range after notably improved Q3. https://www.aurubis.com/en/media/press-releases/press-releases-2026/Aurubis-moves-full-year-guidance-to-upper-end-of-forecast-range-after-notably-improved-Q3
- [6] SteelOrbis. (2026, September 24). BIR urges recyclers to respond to EU draft restrictions on metal waste exports. https://www.steelorbis.com/steel-news/latest-news/bir-urges-recyclers-to-respond-to-eu-draft-restrictions-on-metal-waste-exports-1479573.htm
- [7] letsrecycle.com. (2026, March 19). UK Steel Strategy confirms scrap working group and import curbs. https://www.letsrecycle.com/news/uk-steel-strategy-confirms-scrap-working-group-and-import-curbs/
- [8] NBM Media. (2026, January 22). India's demand for steel scrap to increase sharply on capacity expansion: Shri Daya Nidhan Pandey, Ministry of Steel at IMRC 2026. https://www.nbmcw.com/news/indias-demand-for-steel-scrap-to-increase-sharply-on-capacity-expansion-shri-daya-nidhan-pandey-ministry-of-steel-at-imrc-2026.html
This bibliography is provided for reader reference. The full report contains the complete reference list and detailed citations.
This Report Answers
- How big is the recycled scrap metal market during 2026?
- What market size is projected by 2036?
- Which metal type holds notable share?
- Which source type holds notable share?
- Which countries have notable growth?
- Which companies are notable in the market?
Table of Content
Table of Content
- Key Takeaways
- Market Size and CAGR
- Top Growth Driver
- Fastest Growing Segment
- Leading Region
- Key Companies
- Emerging Opportunities
- Executive Summary
- Global Market Outlook
- Demand-side Trends
- Supply-side Trends
- Technology Roadmap Analysis
- Analysis and Recommendations
- Analyst Perspective (What is happening? Why now? What should investors know?)
- Key Questions Answered
- How large is the market?
- What is the CAGR?
- What are key trends?
- Which region dominates?
- Who are the leaders?
Read More...
- Market Overview
- Market Coverage / Taxonomy
- Market Definition / Scope / Limitations
- Research Methodology
- Chapter Orientation
- Analytical Lens and Working Hypotheses
- Market Structure, Signals, and Trend Drivers
- Benchmarking and Cross-market Comparability
- Market Sizing, Forecasting, and Opportunity Mapping
- Research Design and Evidence Framework
- Desk Research Programme (Secondary Evidence)
- Expert Input and Fieldwork (Primary Evidence)
- Tooling, Models, and Reference Databases
- Data Engineering and Model Build
- Quality Assurance and Audit Trail
- Market Background
- Market Dynamics (Drivers, Restraints, Opportunity, Trends)
- Scenario Forecast (Optimistic, Likely, Conservative)
- Impact Analysis
- AI Impact
- Sustainability Impact
- Regulatory Impact
- Technology Impact
- Consumer / Buyer Analysis
- Purchase Drivers
- Adoption Barriers
- Buyer Journey
- Opportunity Map Analysis
- Product Life Cycle Analysis
- Supply Chain Analysis
- Investment Feasibility Matrix
- Value Chain Analysis
- PESTLE and Porter's Analysis
- Regulatory Landscape
- Regional Parent Market Outlook
- Production and Consumption Statistics
- Import and Export Statistics
- Global Market Analysis and Forecast, 2021 to 2036
- Historical Market Size Value (USD Billion) Analysis, 2021 to 2025
- Current and Future Market Size Value (USD Billion) Projections, 2026 to 2036
- Y-o-Y Growth Trend Analysis
- Absolute $ Opportunity Analysis
- Global Market Pricing Analysis, 2021 to 2036
- Global Market Analysis and Forecast, By Metal Type, 2021 to 2036
- Introduction / Key Findings
- Historical Market Size Value (USD Billion) Analysis By Metal Type, 2021 to 2025
- Current and Future Market Size Value (USD Billion) Analysis and Forecast By Metal Type, 2026 to 2036
- Ferrous
- Aluminum
- Copper
- Precious Metals
- Zinc, Tin and Others
- Y-o-Y Growth Trend Analysis By Metal Type, 2021 to 2025
- Absolute $ Opportunity Analysis By Metal Type, 2026 to 2036
- Global Market Analysis and Forecast, By Source Type, 2021 to 2036
- Introduction / Key Findings
- Historical Market Size Value (USD Billion) Analysis By Source Type, 2021 to 2025
- Current and Future Market Size Value (USD Billion) Analysis and Forecast By Source Type, 2026 to 2036
- Post-Consumer Scrap
- Production Scrap
- Y-o-Y Growth Trend Analysis By Source Type, 2021 to 2025
- Absolute $ Opportunity Analysis By Source Type, 2026 to 2036
- Global Market Analysis and Forecast, By End Use, 2021 to 2036
- Introduction / Key Findings
- Historical Market Size Value (USD Billion) Analysis By End Use, 2021 to 2025
- Current and Future Market Size Value (USD Billion) Analysis and Forecast By End Use, 2026 to 2036
- Automotive
- Building and Construction
- Consumer Electronics
- Packaging
- Equipment and Tools
- Art, Decor and Home Furnishings
- Jewellery
- Others
- Y-o-Y Growth Trend Analysis By End Use, 2021 to 2025
- Absolute $ Opportunity Analysis By End Use, 2026 to 2036
- Global Market Analysis and Forecast, By Region, 2021 to 2036
- Introduction
- Historical Market Size Value (USD Billion) Analysis By Region, 2021 to 2025
- Current Market Size Value (USD Billion) Analysis and Forecast By Region, 2026 to 2036
- North America
- Latin America
- Western Europe
- Eastern Europe
- East Asia
- South Asia and Pacific
- Middle East and Africa
- Market Attractiveness Analysis By Region
- North America Market Analysis and Forecast, By Country, 2021 to 2036
- Historical Market Size Value (USD Billion) Trend Analysis By Market Taxonomy, 2021 to 2025
- Market Size Value (USD Billion) Forecast By Market Taxonomy, 2026 to 2036
- By Country
- United States
- Canada
- By Metal Type
- By Source Type
- By End Use
- By Country
- Market Attractiveness Analysis
- By Country
- By Metal Type
- By Source Type
- By End Use
- Key Takeaways
- Latin America Market Analysis and Forecast, By Country
- Historical Market Size Value (USD Billion) Trend Analysis By Market Taxonomy, 2021 to 2025
- Market Size Value (USD Billion) Forecast By Market Taxonomy, 2026 to 2036
- By Country
- Brazil
- Mexico
- Argentina
- Chile
- By Metal Type
- By Source Type
- By End Use
- By Country
- Market Attractiveness Analysis
- By Country
- By Metal Type
- By Source Type
- By End Use
- Key Takeaways
- Western Europe Market Analysis and Forecast, By Country
- Historical Market Size Value (USD Billion) Trend Analysis By Market Taxonomy, 2021 to 2025
- Market Size Value (USD Billion) Forecast By Market Taxonomy, 2026 to 2036
- By Country
- Germany
- France
- United Kingdom
- Italy
- Spain
- Benelux
- Nordics
- By Metal Type
- By Source Type
- By End Use
- By Country
- Market Attractiveness Analysis
- By Country
- By Metal Type
- By Source Type
- By End Use
- Key Takeaways
- Eastern Europe Market Analysis and Forecast, By Country
- Historical Market Size Value (USD Billion) Trend Analysis By Market Taxonomy, 2021 to 2025
- Market Size Value (USD Billion) Forecast By Market Taxonomy, 2026 to 2036
- By Country
- Poland
- Czech Republic
- Romania
- Hungary
- By Metal Type
- By Source Type
- By End Use
- By Country
- Market Attractiveness Analysis
- By Country
- By Metal Type
- By Source Type
- By End Use
- Key Takeaways
- East Asia Market Analysis and Forecast, By Country
- Historical Market Size Value (USD Billion) Trend Analysis By Market Taxonomy, 2021 to 2025
- Market Size Value (USD Billion) Forecast By Market Taxonomy, 2026 to 2036
- By Country
- China
- Japan
- South Korea
- By Metal Type
- By Source Type
- By End Use
- By Country
- Market Attractiveness Analysis
- By Country
- By Metal Type
- By Source Type
- By End Use
- Key Takeaways
- South Asia and Pacific Market Analysis and Forecast, By Country
- Historical Market Size Value (USD Billion) Trend Analysis By Market Taxonomy, 2021 to 2025
- Market Size Value (USD Billion) Forecast By Market Taxonomy, 2026 to 2036
- By Country
- India
- ASEAN
- Australia and New Zealand
- By Metal Type
- By Source Type
- By End Use
- By Country
- Market Attractiveness Analysis
- By Country
- By Metal Type
- By Source Type
- By End Use
- Key Takeaways
- Middle East and Africa Market Analysis and Forecast, By Country
- Historical Market Size Value (USD Billion) Trend Analysis By Market Taxonomy, 2021 to 2025
- Market Size Value (USD Billion) Forecast By Market Taxonomy, 2026 to 2036
- By Country
- GCC Countries
- South Africa
- Türkiye
- Israel
- By Metal Type
- By Source Type
- By End Use
- By Country
- Market Attractiveness Analysis
- By Country
- By Metal Type
- By Source Type
- By End Use
- Key Takeaways
- Key Countries Market Analysis
- United States
- Pricing Analysis
- Market Share Analysis, 2025
- By Metal Type
- By Source Type
- By End Use
- Canada
- Pricing Analysis
- Market Share Analysis, 2025
- By Metal Type
- By Source Type
- By End Use
- Mexico
- Pricing Analysis
- Market Share Analysis, 2025
- By Metal Type
- By Source Type
- By End Use
- Brazil
- Pricing Analysis
- Market Share Analysis, 2025
- By Metal Type
- By Source Type
- By End Use
- Chile
- Pricing Analysis
- Market Share Analysis, 2025
- By Metal Type
- By Source Type
- By End Use
- Germany
- Pricing Analysis
- Market Share Analysis, 2025
- By Metal Type
- By Source Type
- By End Use
- United Kingdom
- Pricing Analysis
- Market Share Analysis, 2025
- By Metal Type
- By Source Type
- By End Use
- Italy
- Pricing Analysis
- Market Share Analysis, 2025
- By Metal Type
- By Source Type
- By End Use
- Spain
- Pricing Analysis
- Market Share Analysis, 2025
- By Metal Type
- By Source Type
- By End Use
- France
- Pricing Analysis
- Market Share Analysis, 2025
- By Metal Type
- By Source Type
- By End Use
- India
- Pricing Analysis
- Market Share Analysis, 2025
- By Metal Type
- By Source Type
- By End Use
- ASEAN
- Pricing Analysis
- Market Share Analysis, 2025
- By Metal Type
- By Source Type
- By End Use
- Australia and New Zealand
- Pricing Analysis
- Market Share Analysis, 2025
- By Metal Type
- By Source Type
- By End Use
- China
- Pricing Analysis
- Market Share Analysis, 2025
- By Metal Type
- By Source Type
- By End Use
- Japan
- Pricing Analysis
- Market Share Analysis, 2025
- By Metal Type
- By Source Type
- By End Use
- South Korea
- Pricing Analysis
- Market Share Analysis, 2025
- By Metal Type
- By Source Type
- By End Use
- Poland
- Pricing Analysis
- Market Share Analysis, 2025
- By Metal Type
- By Source Type
- By End Use
- Hungary
- Pricing Analysis
- Market Share Analysis, 2025
- By Metal Type
- By Source Type
- By End Use
- Türkiye
- Pricing Analysis
- Market Share Analysis, 2025
- By Metal Type
- By Source Type
- By End Use
- South Africa
- Pricing Analysis
- Market Share Analysis, 2025
- By Metal Type
- By Source Type
- By End Use
- United States
- Market Structure Analysis
- Competition Dashboard
- Competition Benchmarking
- Market Share Analysis of Top Players
- By Regional
- By Metal Type
- By Source Type
- By End Use
- Emerging Startups
- Innovation Benchmarking
- Competition Analysis
- Competition Deep Dive
- Sims Limited
- Overview
- Product Portfolio
- Profitability by Market Segments
- Sales Footprint
- Strategy Overview
- Marketing Strategy
- Product Strategy
- Channel Strategy
- Nucor
- OmniSource (Steel Dynamics)
- Aurubis
- ArcelorMittal
- American Iron & Metal
- DBW Metals Recycling
- Kuusakoski
- Metallon Recycling
- TKC Metal Recycling
- Sims Limited
- Case Studies
- Success Stories
- Recent Developments
- Competition Deep Dive
- Assumptions & Acronyms Used
List of Tables
- Table 1: Global Market Value (USD Billion) Forecast by Region, 2021 to 2036
- Table 2: Global Market Value (USD Billion) Forecast by Metal Type, 2021 to 2036
- Table 3: Global Market Value (USD Billion) Forecast by Source Type, 2021 to 2036
- Table 4: Global Market Value (USD Billion) Forecast by End Use, 2021 to 2036
- Table 5: North America Market Value (USD Billion) Forecast by Country, 2021 to 2036
- Table 6: North America Market Value (USD Billion) Forecast by Metal Type, 2021 to 2036
- Table 7: North America Market Value (USD Billion) Forecast by Source Type, 2021 to 2036
- Table 8: North America Market Value (USD Billion) Forecast by End Use, 2021 to 2036
- Table 9: Latin America Market Value (USD Billion) Forecast by Country, 2021 to 2036
- Table 10: Latin America Market Value (USD Billion) Forecast by Metal Type, 2021 to 2036
- Table 11: Latin America Market Value (USD Billion) Forecast by Source Type, 2021 to 2036
- Table 12: Latin America Market Value (USD Billion) Forecast by End Use, 2021 to 2036
- Table 13: Western Europe Market Value (USD Billion) Forecast by Country, 2021 to 2036
- Table 14: Western Europe Market Value (USD Billion) Forecast by Metal Type, 2021 to 2036
- Table 15: Western Europe Market Value (USD Billion) Forecast by Source Type, 2021 to 2036
- Table 16: Western Europe Market Value (USD Billion) Forecast by End Use, 2021 to 2036
- Table 17: Eastern Europe Market Value (USD Billion) Forecast by Country, 2021 to 2036
- Table 18: Eastern Europe Market Value (USD Billion) Forecast by Metal Type, 2021 to 2036
- Table 19: Eastern Europe Market Value (USD Billion) Forecast by Source Type, 2021 to 2036
- Table 20: Eastern Europe Market Value (USD Billion) Forecast by End Use, 2021 to 2036
- Table 21: East Asia Market Value (USD Billion) Forecast by Country, 2021 to 2036
- Table 22: East Asia Market Value (USD Billion) Forecast by Metal Type, 2021 to 2036
- Table 23: East Asia Market Value (USD Billion) Forecast by Source Type, 2021 to 2036
- Table 24: East Asia Market Value (USD Billion) Forecast by End Use, 2021 to 2036
- Table 25: South Asia and Pacific Market Value (USD Billion) Forecast by Country, 2021 to 2036
- Table 26: South Asia and Pacific Market Value (USD Billion) Forecast by Metal Type, 2021 to 2036
- Table 27: South Asia and Pacific Market Value (USD Billion) Forecast by Source Type, 2021 to 2036
- Table 28: South Asia and Pacific Market Value (USD Billion) Forecast by End Use, 2021 to 2036
- Table 29: Middle East and Africa Market Value (USD Billion) Forecast by Country, 2021 to 2036
- Table 30: Middle East and Africa Market Value (USD Billion) Forecast by Metal Type, 2021 to 2036
- Table 31: Middle East and Africa Market Value (USD Billion) Forecast by Source Type, 2021 to 2036
- Table 32: Middle East and Africa Market Value (USD Billion) Forecast by End Use, 2021 to 2036
List of Figures
- Figure 1: Global Market Pricing Analysis
- Figure 2: Global Market Value (USD Billion) Forecast 2021-2036
- Figure 3: Global Market Value Share and BPS Analysis by Metal Type, 2026 and 2036
- Figure 4: Global Market Y-o-Y Growth Comparison by Metal Type, 2026-2036
- Figure 5: Global Market Attractiveness Analysis by Metal Type
- Figure 6: Global Market Value Share and BPS Analysis by Source Type, 2026 and 2036
- Figure 7: Global Market Y-o-Y Growth Comparison by Source Type, 2026-2036
- Figure 8: Global Market Attractiveness Analysis by Source Type
- Figure 9: Global Market Value Share and BPS Analysis by End Use, 2026 and 2036
- Figure 10: Global Market Y-o-Y Growth Comparison by End Use, 2026-2036
- Figure 11: Global Market Attractiveness Analysis by End Use
- Figure 12: Global Market Value (USD Billion) Share and BPS Analysis by Region, 2026 and 2036
- Figure 13: Global Market Y-o-Y Growth Comparison by Region, 2026-2036
- Figure 14: Global Market Attractiveness Analysis by Region
- Figure 15: North America Market Incremental Dollar Opportunity, 2026-2036
- Figure 16: Latin America Market Incremental Dollar Opportunity, 2026-2036
- Figure 17: Western Europe Market Incremental Dollar Opportunity, 2026-2036
- Figure 18: Eastern Europe Market Incremental Dollar Opportunity, 2026-2036
- Figure 19: East Asia Market Incremental Dollar Opportunity, 2026-2036
- Figure 20: South Asia and Pacific Market Incremental Dollar Opportunity, 2026-2036
- Figure 21: Middle East and Africa Market Incremental Dollar Opportunity, 2026-2036
- Figure 22: North America Market Value Share and BPS Analysis by Country, 2026 and 2036
- Figure 23: North America Market Value Share and BPS Analysis by Metal Type, 2026 and 2036
- Figure 24: North America Market Y-o-Y Growth Comparison by Metal Type, 2026-2036
- Figure 25: North America Market Attractiveness Analysis by Metal Type
- Figure 26: North America Market Value Share and BPS Analysis by Source Type, 2026 and 2036
- Figure 27: North America Market Y-o-Y Growth Comparison by Source Type, 2026-2036
- Figure 28: North America Market Attractiveness Analysis by Source Type
- Figure 29: North America Market Value Share and BPS Analysis by End Use, 2026 and 2036
- Figure 30: North America Market Y-o-Y Growth Comparison by End Use, 2026-2036
- Figure 31: North America Market Attractiveness Analysis by End Use
- Figure 32: Latin America Market Value Share and BPS Analysis by Country, 2026 and 2036
- Figure 33: Latin America Market Value Share and BPS Analysis by Metal Type, 2026 and 2036
- Figure 34: Latin America Market Y-o-Y Growth Comparison by Metal Type, 2026-2036
- Figure 35: Latin America Market Attractiveness Analysis by Metal Type
- Figure 36: Latin America Market Value Share and BPS Analysis by Source Type, 2026 and 2036
- Figure 37: Latin America Market Y-o-Y Growth Comparison by Source Type, 2026-2036
- Figure 38: Latin America Market Attractiveness Analysis by Source Type
- Figure 39: Latin America Market Value Share and BPS Analysis by End Use, 2026 and 2036
- Figure 40: Latin America Market Y-o-Y Growth Comparison by End Use, 2026-2036
- Figure 41: Latin America Market Attractiveness Analysis by End Use
- Figure 42: Western Europe Market Value Share and BPS Analysis by Country, 2026 and 2036
- Figure 43: Western Europe Market Value Share and BPS Analysis by Metal Type, 2026 and 2036
- Figure 44: Western Europe Market Y-o-Y Growth Comparison by Metal Type, 2026-2036
- Figure 45: Western Europe Market Attractiveness Analysis by Metal Type
- Figure 46: Western Europe Market Value Share and BPS Analysis by Source Type, 2026 and 2036
- Figure 47: Western Europe Market Y-o-Y Growth Comparison by Source Type, 2026-2036
- Figure 48: Western Europe Market Attractiveness Analysis by Source Type
- Figure 49: Western Europe Market Value Share and BPS Analysis by End Use, 2026 and 2036
- Figure 50: Western Europe Market Y-o-Y Growth Comparison by End Use, 2026-2036
- Figure 51: Western Europe Market Attractiveness Analysis by End Use
- Figure 52: Eastern Europe Market Value Share and BPS Analysis by Country, 2026 and 2036
- Figure 53: Eastern Europe Market Value Share and BPS Analysis by Metal Type, 2026 and 2036
- Figure 54: Eastern Europe Market Y-o-Y Growth Comparison by Metal Type, 2026-2036
- Figure 55: Eastern Europe Market Attractiveness Analysis by Metal Type
- Figure 56: Eastern Europe Market Value Share and BPS Analysis by Source Type, 2026 and 2036
- Figure 57: Eastern Europe Market Y-o-Y Growth Comparison by Source Type, 2026-2036
- Figure 58: Eastern Europe Market Attractiveness Analysis by Source Type
- Figure 59: Eastern Europe Market Value Share and BPS Analysis by End Use, 2026 and 2036
- Figure 60: Eastern Europe Market Y-o-Y Growth Comparison by End Use, 2026-2036
- Figure 61: Eastern Europe Market Attractiveness Analysis by End Use
- Figure 62: East Asia Market Value Share and BPS Analysis by Country, 2026 and 2036
- Figure 63: East Asia Market Value Share and BPS Analysis by Metal Type, 2026 and 2036
- Figure 64: East Asia Market Y-o-Y Growth Comparison by Metal Type, 2026-2036
- Figure 65: East Asia Market Attractiveness Analysis by Metal Type
- Figure 66: East Asia Market Value Share and BPS Analysis by Source Type, 2026 and 2036
- Figure 67: East Asia Market Y-o-Y Growth Comparison by Source Type, 2026-2036
- Figure 68: East Asia Market Attractiveness Analysis by Source Type
- Figure 69: East Asia Market Value Share and BPS Analysis by End Use, 2026 and 2036
- Figure 70: East Asia Market Y-o-Y Growth Comparison by End Use, 2026-2036
- Figure 71: East Asia Market Attractiveness Analysis by End Use
- Figure 72: South Asia and Pacific Market Value Share and BPS Analysis by Country, 2026 and 2036
- Figure 73: South Asia and Pacific Market Value Share and BPS Analysis by Metal Type, 2026 and 2036
- Figure 74: South Asia and Pacific Market Y-o-Y Growth Comparison by Metal Type, 2026-2036
- Figure 75: South Asia and Pacific Market Attractiveness Analysis by Metal Type
- Figure 76: South Asia and Pacific Market Value Share and BPS Analysis by Source Type, 2026 and 2036
- Figure 77: South Asia and Pacific Market Y-o-Y Growth Comparison by Source Type, 2026-2036
- Figure 78: South Asia and Pacific Market Attractiveness Analysis by Source Type
- Figure 79: South Asia and Pacific Market Value Share and BPS Analysis by End Use, 2026 and 2036
- Figure 80: South Asia and Pacific Market Y-o-Y Growth Comparison by End Use, 2026-2036
- Figure 81: South Asia and Pacific Market Attractiveness Analysis by End Use
- Figure 82: Middle East and Africa Market Value Share and BPS Analysis by Country, 2026 and 2036
- Figure 83: Middle East and Africa Market Value Share and BPS Analysis by Metal Type, 2026 and 2036
- Figure 84: Middle East and Africa Market Y-o-Y Growth Comparison by Metal Type, 2026-2036
- Figure 85: Middle East and Africa Market Attractiveness Analysis by Metal Type
- Figure 86: Middle East and Africa Market Value Share and BPS Analysis by Source Type, 2026 and 2036
- Figure 87: Middle East and Africa Market Y-o-Y Growth Comparison by Source Type, 2026-2036
- Figure 88: Middle East and Africa Market Attractiveness Analysis by Source Type
- Figure 89: Middle East and Africa Market Value Share and BPS Analysis by End Use, 2026 and 2036
- Figure 90: Middle East and Africa Market Y-o-Y Growth Comparison by End Use, 2026-2036
- Figure 91: Middle East and Africa Market Attractiveness Analysis by End Use
- Figure 92: Global Market - Tier Structure Analysis
- Figure 93: Global Market - Company Share Analysis
Frequently Asked Questions
How large is the recycled scrap metal market expected in 2026?
Recycled scrap metal market sales in 2026 are sized by FMI at USD 80.9 billion, up from USD 75.5 billion in 2025. By 2036, sales of recycled scrap metal are projected to reach USD 160.6 billion.
What CAGR is projected for the recycled scrap metal market through 2036?
A 7.1% CAGR is expected for the recycled scrap metal market from 2026 to 2036. Electric furnace steelmaking and export rules that keep scrap near domestic mills support that growth.
Which metal type holds a notable market share in 2026?
Metal type sales are led by ferrous scrap, expected at an estimated 74.4% share in 2026. Aluminum follows at about 11.8%.
Which source type holds a notable market share in 2026?
Obsolete material from buildings, cars and appliances gives post-consumer scrap a projected 57.5% share in 2026. Production scrap accounts for the other 42.5%.
Which country has a notable expansion outlook through 2036?
Highest in the FMI country table is the United Kingdom, at a 7.9% CAGR. India follows at 7.6%.
Who are the key companies in the recycled scrap metal market?
Sims Limited, Nucor, OmniSource (Steel Dynamics), ArcelorMittal and Aurubis are among the profiled companies. American Iron & Metal, DBW Metals Recycling, Kuusakoski, Metallon Recycling and TKC Metal Recycling complete the group.
Preview the report firsthand - request a free sample
Get SampleGet the brochure for pricing and purchase details.
Get PDF
