Reflective Air Packaging Market Size and Share Forecast Outlook 2025 to 2035

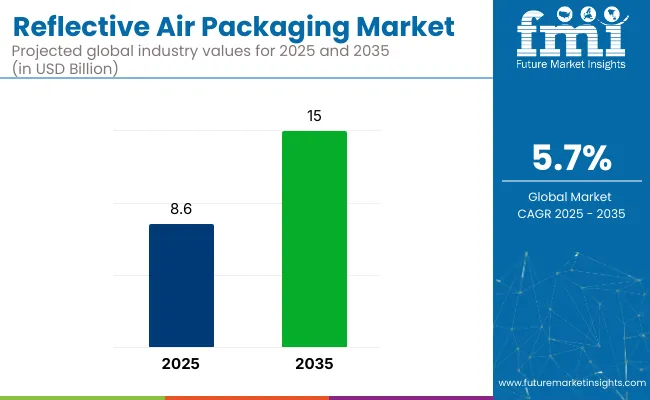
The global reflective air packaging market is projected to grow from USD 8.6 billion by 2025 to approximately USD 15.0 billion by 2035, registering a CAGR of 5.7% during the forecast period. Sales in 2024 were recorded at USD 944.1 million.
Quick Stats of Reflective Air Packaging Market

  • Market Value (2025): USD 8.6 billion
  • Forecast Value (2035): USD 15.0 billion
  • Forecast CAGR: 5.7%
  • Substrate Type Leader in 2025: Polyethylene Terephthalate (43.9% market share)
  • Top End-Use: Food and beverages (47.5% share)
  • Key Growth Country: North America (United States to witness CAGR of 5.9%)

Reflective Air Packaging Market

This market expansion is fueled by rising demand for temperature-sensitive and impact-resistant packaging solutions across key industries such as food & beverage, pharmaceuticals, and electronics. Reflective air packaging combines thermal insulation and cushioning properties by integrating multi-layered reflective materials and air bubble structures, ensuring product integrity throughout cold chain logistics. The format is gaining traction due to increasing global e-commerce deliveries and consumer preference for safer, tamper-evident transit packaging.

In 2023, Sealed Air Corporation introduced its strategic Reinvent SEE 2.0 initiative, aimed at improving operational efficiency and supporting sustainable innovation. Though the company did not release a dedicated figure toward reflective air packaging, its “CTO2Grow” (Cost Take-Out to Grow) program included significant investments across automation and sustainable packaging systems.

“Our actions will enable SEE to operate with greater efficiency and deliver high-quality, sustainable packaging innovations for our customers,” stated Ted Doheny, then-President and CEO of Sealed Air. These investments are expected to indirectly benefit insulated and thermal packaging solutions, including reflective formats tailored for cold chain applications.

Innovations in the reflective air packaging space are currently centered on replacing non-recyclable multilayer foils with recyclable and bio-based alternatives. Companies are actively developing lightweight reflective bubble mailers, reusable thermal liners, and multi-use air-cell wraps that offer high-performance insulation while reducing environmental impact.

Some products now incorporate integrated temperature sensors to help pharmaceutical and food logistics providers monitor real-time temperature conditions. These advancements are enabling brands to meet both logistical and regulatory requirements, while also enhancing sustainability credentials and consumer trust.

The Asia-Pacific region is anticipated to exhibit the fastest growth in the reflective air packaging market, fueled by expanding pharmaceutical and e-grocery delivery networks in China, India, Japan, and Southeast Asia. Urbanization, rising middle-class income, and an uptick in online purchases of perishable goods are driving demand for high-performance insulated packaging.

Local manufacturers are responding by investing in recyclable insulated mailers and hybrid barrier films, positioning themselves to cater to both domestic and export requirements. Additionally, governmental emphasis on reducing plastic waste is further prompting adoption of environmentally friendly reflective air packaging solutions across the region.

Analyzing Reflective Air Packaging Market by Top Investment Segment

The market has been segmented based on substrate type, end use, application, and region. By substrate type, polyethylene terephthalate (PET), high-density polyethylene (HDPE), cast polypropylene (CPP), and other polymeric materials are utilized to deliver high thermal insulation, mechanical durability, and moisture resistance properties for air-based barrier packaging.

End-use segmentation includes food and beverages, healthcare, electronics, cosmetics and personal care, industrial products, automotive, and others reflecting the cross-sector demand for temperature-sensitive, damage-resistant packaging solutions. Applications are classified into flexible packaging, rigid packaging, and pouch packaging, underscoring product adaptability across consumer and industrial supply chains.

Regional segmentation spans North America, Europe, South America, Asia Pacific, and the Middle East and Africa, capturing divergent trends in e-commerce growth, cold-chain infrastructure, and sustainability regulations driving demand for reflective air insulation packaging.
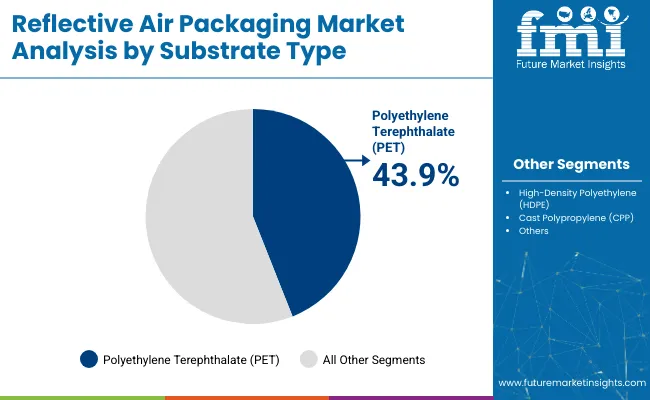
Polyethylene Terephthalate (PET) Segment to Hold 43.9% Share Due to Superior Barrier and Thermal Performance

Reflective Air Packaging Market Analysis By Substrate Type

The polyethylene terephthalate (PET) segment is projected to dominate the substrate type category with a 43.9% share in 2025, driven by its excellent thermal insulation, high tensile strength, and superior barrier properties. PET is widely used in reflective air packaging due to its ability to resist moisture, oxygen, and external contaminants critical for temperature-sensitive and high-value product categories.

Its reflective metallic surface efficiently maintains internal temperatures, making it ideal for cold chain logistics in food, pharmaceuticals, and biotech applications. PET-based reflective packaging is commonly employed in multilayer formats, laminated with insulating foams or bubbles to create advanced thermal envelopes and box liners.

The material’s high clarity and puncture resistance make it suitable for both flexible and semi-rigid configurations. Additionally, PET is recyclable, aligning well with sustainability commitments across retail and industrial supply chains. Its compatibility with automated packaging systems and custom die-cutting technologies has expanded its adoption in e-commerce and direct-to-consumer (D2C) shipping environments.

As industries face tightening regulations on thermal packaging emissions and plastic recycling mandates, PET continues to offer a balance of performance, cost-efficiency, and environmental compliance cementing its position as the leading substrate in reflective air packaging.
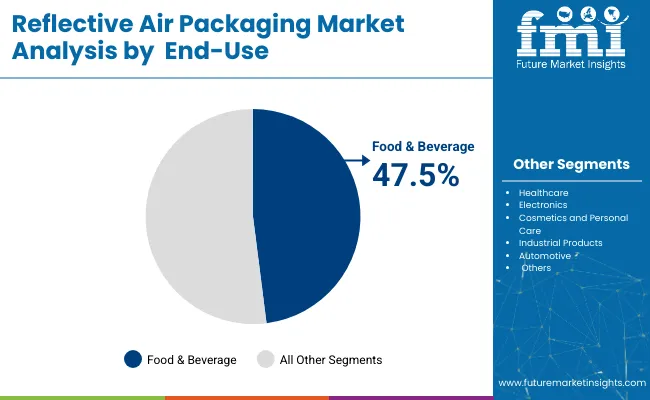
Food and Beverages Segment to Lead Amid Cold Chain Expansion and Freshness Preservation

Reflective Air Packaging Market Analysis By End Use

The food and beverages segment is anticipated to account for the largest share of 47.5% in the reflective air packaging market by 2025, fueled by the growing demand for thermal protection across frozen foods, fresh produce, dairy, meat, and ready-to-eat meal deliveries. With the rapid rise of online grocery platforms and direct-from-farm delivery services, temperature-sensitive packaging solutions have become critical to maintaining product freshness and safety.

Reflective air packaging enables superior insulation by reflecting radiant heat and minimizing thermal exchange, which is essential for both ambient and refrigerated supply chains. It is extensively used in combination with gel packs, EPS boxes, and corrugated outer containers to maintain the required temperature profiles during transit.

Global cold chain infrastructure investments especially in North America, Europe, and Asia Pacific-have accelerated the adoption of reflective materials in both B2B and B2C distribution. Furthermore, food safety regulations from entities like the FDA, EU EFSA, and HACCP have increased the demand for compliant, food-grade packaging materials that ensure hygiene and integrity.

Challenges and Opportunities

Challenge

High Manufacturing Costs

The Reflective Air Packaging Market faces a formidable challenge with advanced insulation materials having to be made at huge expense. The manufacture of such things as multilayer reflective films and air cushioning materials requires special processes, with overhead costs increasing and the ability of these products to be bought by small firms drastically curtailed.

Environmental Concerns and Recycling Limitations

Reflective air packaging, which lies on the use of non-biodegradable materials, lays environmental burdens. As many of these marriages are simply not in short supply-or not, anyway-this creates problems of waste management and means growing amounts of pressure from agencies that seek ways users can adopt ecologically-friendly alternatives.

Opportunity

Growing Demand for Sustainable Packaging

Growing demand for sustainable packaging. Both the rise of sustainability and people's demand for green packaging present good opportunities. For example, businesses producing biodegradable and/or recyclable reflective air packaging materials can tap into a brand new set of environmentally concerned consumers.

Expanding E-commerce and Cold Chain Logistics

Large increase in e-commerce business and the demand for carrying products that are sensitive to temperatures sum to provide powerful weights on reflective air packaging. Portions as disparate as fast food, pharmaceuticals, and office materials must all keep safe as the wind changes its direction as yet uncertain which way it will finally blow market growth for reflective air-packaging products is well underway.
Country-wise Outlook

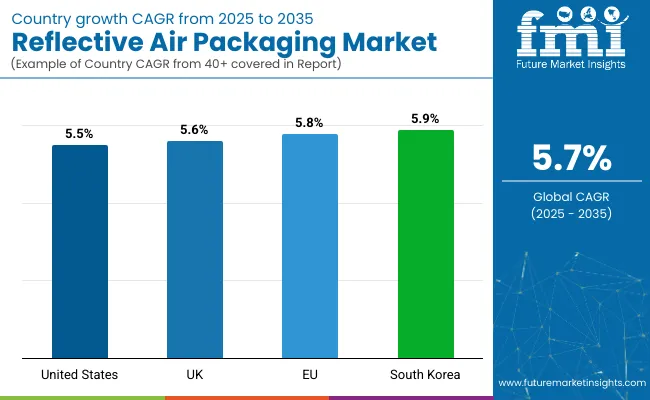
Reflective Air Packaging Market Cagr Analysis By Country

United States

Over the industry's history in the United States, Reflective Air Packaging has always been powered by consistently robust demand for temperature-controlled packaging among pharmaceuticals, food and beverage production or e-commerce.

Even today, fresh online grocery shoppers and meal kit receivers have merely enlarged the need for insulated protective packaging. Stringent rules to protect sustainable packaging while seeking the advantages of eco-friendly materials are a driving force behind further growth

Country

Country CAGR (2025 to 2035)
United States 5.5%

United Kingdom

Reflective Air Packaging is gaining momentum in the UK on account of the burgeoning cold chain logistics industry. The need for precise temperature controlled packaging in pharmaceutical and perishable food industries is what propels market growth.Sustainability projects and the drive to make packaging recyclable and biodegradable are helping launch innovative reflective air packaging technologies.

Country CAGR (2025 to 2035)
United Kingdom 5.6%

European Union

Reflective Air Packaging is being increasingly adopted in the European Union, particularly by the medical, food and logistics sectors. Germany, France and Italy-three leaders in sustainable packaging solutions for the EU due to strict regulations to limit plastic waste-are among those making greater investments in research and development of cutting-edge insulated packaging materials. The surge in cross-border e-commerce and pharmaceutical exports all fuel demand for high performance reflective air packaging.

Region CAGR (2025 to 2035)
European Union 5.8%

South Korea

The Reflective Air Packaging market in South Korea is expanding dramatically, supported by a strong presence of electronic, pharmaceutical and food delivery branches. The rise in demands for home delivery service has led to temperature-sensitive meal kit requirements; so there is a growing need for highly insulated packaging materials.

The government policies to encourage packaging sustainability and development of innovative, high-performance, lightweight packaging materials are moulding global trends in the market for reflective air packaging. South Korea's advanced hardware skills and attention to technological advances are also encouraging the adoption of reflective air packaging.

Country CAGR (2025 to 2035)
South Korea 5.9%

Competitive Outlook

The reflective air packaging market continues to grow for a variety of materials in a wide range of sizes as well as types. The breakthrough of laminated film the reflective air packaging market continues to expand. Demand is strong for temperature sensitive and protective packaging in such industries as food, pharmaceutical products or e-commerce logistics development is being driven by efficient insulation, preventing heat transfer and ensuring product integrity.
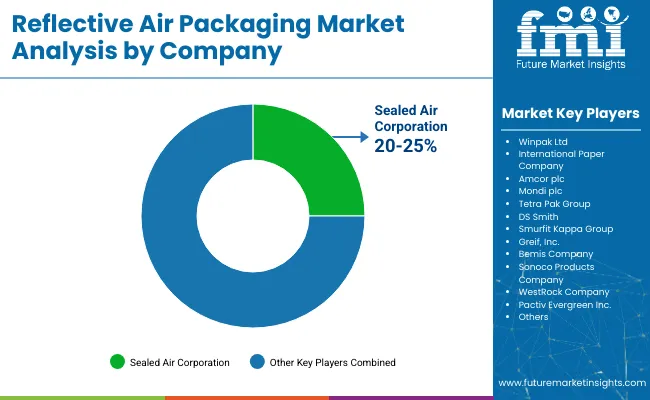
Key Companies

Reflective Air Packaging Market Analysis By Company

  • Sealed Air Corporation
  • Winpak Ltd
  • International Paper Company
  • Amcor plc
  • Mondi plc
  • Tetra Pak Group
  • DS Smith
  • Smurfit Kappa Group
  • Greif, Inc.
  • Bemis Company
  • Sonoco Products Company
  • WestRock Company
  • Pactiv Evergreen Inc.

Key Segmentation

By Substrate Type:

  • Polyethylene Terephthalate (PET)
  • High-Density Polyethylene (HDPE)
  • Cast Polypropylene (CPP)
  • Others

By End-Use:

  • Food and Beverages
  • Healthcare
  • Electronics
  • Cosmetics and Personal Care
  • Industrial Products
  • Automotive
  • Others

By Application:

  • Flexible Packaging
  • Rigid Packaging

By Region:

  • North America
  • Europe
  • South America
  • Asia Pacific
  • Middle East and Africa

Table of Content

  1. Executive Summary
    • Global Market Outlook
    • Demand-side Trends
    • Supply-side Trends
    • Technology Roadmap Analysis
    • Analysis and Recommendations
  2. Market Overview
    • Market Coverage / Taxonomy
    • Market Definition / Scope / Limitations
  3. Market Background
    • Market Dynamics
      • Drivers
      • Restraints
      • Opportunity
      • Trends
    • Scenario Forecast
      • Demand in Optimistic Scenario
      • Demand in Likely Scenario
      • Demand in Conservative Scenario
    • Opportunity Map Analysis
    • Product Life Cycle Analysis
    • Supply Chain Analysis
      • Supply Side Participants and their Roles
        • Producers
        • Mid-Level Participants (Traders/ Agents/ Brokers)
        • Wholesalers and Distributors
      • Value Added and Value Created at Node in the Supply Chain
      • List of Raw Material Suppliers
      • List of Existing and Potential Buyer’s
    • Investment Feasibility Matrix
    • Value Chain Analysis
      • Profit Margin Analysis
      • Wholesalers and Distributors
      • Retailers
    • PESTLE and Porter’s Analysis
    • Regulatory Landscape
      • By Key Regions
      • By Key Countries
    • Regional Parent Market Outlook
    • Production and Consumption Statistics
    • Import and Export Statistics
  4. Global Market Analysis 2020 to 2024 and Forecast, 2025 to 2035
    • Historical Market Size Value (USD Million) & Volume (Units) Analysis, 2020 to 2024
    • Current and Future Market Size Value (USD Million) & Volume (Units) Projections, 2025 to 2035
      • Y-o-Y Growth Trend Analysis
      • Absolute $ Opportunity Analysis
  5. Global Market Pricing Analysis 2020 to 2024 and Forecast 2025 to 2035
  6. Global Market Analysis 2020 to 2024 and Forecast 2025 to 2035, By Substrate Type
    • Introduction / Key Findings
    • Historical Market Size Value (USD Million) & Volume (Units) Analysis By Substrate Type, 2020 to 2024
    • Current and Future Market Size Value (USD Million) & Volume (Units) Analysis and Forecast By Substrate Type, 2025 to 2035
      • Polyethylene Terephthalate (PET)
      • High-Density Polyethylene (HDPE)
      • Cast Polypropylene (CPP)
      • Others
    • Y-o-Y Growth Trend Analysis By Substrate Type, 2020 to 2024
    • Absolute $ Opportunity Analysis By Substrate Type, 2025 to 2035
  7. Global Market Analysis 2020 to 2024 and Forecast 2025 to 2035, By End-Use
    • Introduction / Key Findings
    • Historical Market Size Value (USD Million) & Volume (Units) Analysis By End-Use, 2020 to 2024
    • Current and Future Market Size Value (USD Million) & Volume (Units) Analysis and Forecast By End-Use, 2025 to 2035
      • Food and Beverages
      • Healthcare
      • Electronics
      • Cosmetics and Personal Care
      • Industrial Products
      • Automotive
      • Others
    • Y-o-Y Growth Trend Analysis By End-Use, 2020 to 2024
    • Absolute $ Opportunity Analysis By End-Use, 2025 to 2035
  8. Global Market Analysis 2020 to 2024 and Forecast 2025 to 2035, By Application
    • Introduction / Key Findings
    • Historical Market Size Value (USD Million) & Volume (Units) Analysis By Application, 2020 to 2024
    • Current and Future Market Size Value (USD Million) & Volume (Units) Analysis and Forecast By Application, 2025 to 2035
      • Flexible Packaging
      • Rigid Packaging
      • Pouch Packaging
    • Y-o-Y Growth Trend Analysis By Application, 2020 to 2024
    • Absolute $ Opportunity Analysis By Application, 2025 to 2035
  9. Global Market Analysis 2020 to 2024 and Forecast 2025 to 2035, By Region
    • Introduction
    • Historical Market Size Value (USD Million) & Volume (Units) Analysis By Region, 2020 to 2024
    • Current Market Size Value (USD Million) & Volume (Units) Analysis and Forecast By Region, 2025 to 2035
      • North America
      • Latin America
      • Europe
      • East Asia
      • South Asia
      • Oceania
      • MEA
    • Market Attractiveness Analysis By Region
  10. North America Market Analysis 2020 to 2024 and Forecast 2025 to 2035, By Country
    • Historical Market Size Value (USD Million) & Volume (Units) Trend Analysis By Market Taxonomy, 2020 to 2024
    • Market Size Value (USD Million) & Volume (Units) Forecast By Market Taxonomy, 2025 to 2035
      • By Country
        • USA
        • Canada
      • By Substrate Type
      • By End-Use
      • By Application
    • Market Attractiveness Analysis
      • By Country
      • By Substrate Type
      • By End-Use
      • By Application
    • Key Takeaways
  11. Latin America Market Analysis 2020 to 2024 and Forecast 2025 to 2035, By Country
    • Historical Market Size Value (USD Million) & Volume (Units) Trend Analysis By Market Taxonomy, 2020 to 2024
    • Market Size Value (USD Million) & Volume (Units) Forecast By Market Taxonomy, 2025 to 2035
      • By Country
        • Brazil
        • Mexico
        • Argentina
        • Chile
        • Peru
        • Rest of Latin America
      • By Substrate Type
      • By End-Use
      • By Application
    • Market Attractiveness Analysis
      • By Country
      • By Substrate Type
      • By End-Use
      • By Application
    • Key Takeaways
  12. Europe Market Analysis 2020 to 2024 and Forecast 2025 to 2035, By Country
    • Historical Market Size Value (USD Million) & Volume (Units) Trend Analysis By Market Taxonomy, 2020 to 2024
    • Market Size Value (USD Million) & Volume (Units) Forecast By Market Taxonomy, 2025 to 2035
      • By Country
        • Germany
        • Italy
        • France
        • UK
        • Spain
        • Russia
        • BENELUX
        • Rest of Europe
      • By Substrate Type
      • By End-Use
      • By Application
    • Market Attractiveness Analysis
      • By Country
      • By Substrate Type
      • By End-Use
      • By Application
    • Key Takeaways
  13. East Asia Market Analysis 2020 to 2024 and Forecast 2025 to 2035, By Country
    • Historical Market Size Value (USD Million) & Volume (Units) Trend Analysis By Market Taxonomy, 2020 to 2024
    • Market Size Value (USD Million) & Volume (Units) Forecast By Market Taxonomy, 2025 to 2035
      • By Country
        • China
        • Japan
        • South Korea
      • By Substrate Type
      • By End-Use
      • By Application
    • Market Attractiveness Analysis
      • By Country
      • By Substrate Type
      • By End-Use
      • By Application
    • Key Takeaways
  14. South Asia Market Analysis 2020 to 2024 and Forecast 2025 to 2035, By Country
    • Historical Market Size Value (USD Million) & Volume (Units) Trend Analysis By Market Taxonomy, 2020 to 2024
    • Market Size Value (USD Million) & Volume (Units) Forecast By Market Taxonomy, 2025 to 2035
      • By Country
        • India
        • Thailand
        • Malaysia
        • Indonesia
        • Rest of South Asia
      • By Substrate Type
      • By End-Use
      • By Application
    • Market Attractiveness Analysis
      • By Country
      • By Substrate Type
      • By End-Use
      • By Application
    • Key Takeaways
  15. Oceania Market Analysis 2020 to 2024 and Forecast 2025 to 2035, By Country
    • Historical Market Size Value (USD Million) & Volume (Units) Trend Analysis By Market Taxonomy, 2020 to 2024
    • Market Size Value (USD Million) & Volume (Units) Forecast By Market Taxonomy, 2025 to 2035
      • By Country
        • Australia
        • New Zealand
      • By Substrate Type
      • By End-Use
      • By Application
    • Market Attractiveness Analysis
      • By Country
      • By Substrate Type
      • By End-Use
      • By Application
    • Key Takeaways
  16. MEA Market Analysis 2020 to 2024 and Forecast 2025 to 2035, By Country
    • Historical Market Size Value (USD Million) & Volume (Units) Trend Analysis By Market Taxonomy, 2020 to 2024
    • Market Size Value (USD Million) & Volume (Units) Forecast By Market Taxonomy, 2025 to 2035
      • By Country
        • GCC
        • Rest of MEA
      • By Substrate Type
      • By End-Use
      • By Application
    • Market Attractiveness Analysis
      • By Country
      • By Substrate Type
      • By End-Use
      • By Application
    • Key Takeaways
  17. Key Countries Market Analysis
    • USA
      • Pricing Analysis
      • Market Share Analysis, 2024
        • By Substrate Type
        • By End-Use
        • By Application
    • Canada
      • Pricing Analysis
      • Market Share Analysis, 2024
        • By Substrate Type
        • By End-Use
        • By Application
    • Brazil
      • Pricing Analysis
      • Market Share Analysis, 2024
        • By Substrate Type
        • By End-Use
        • By Application
    • Mexico
      • Pricing Analysis
      • Market Share Analysis, 2024
        • By Substrate Type
        • By End-Use
        • By Application
    • Argentina
      • Pricing Analysis
      • Market Share Analysis, 2024
        • By Substrate Type
        • By End-Use
        • By Application
  18. Market Structure Analysis
    • Competition Dashboard
    • Competition Benchmarking
    • Market Share Analysis of Top Players
      • By Regional
      • By Substrate Type
      • By End-Use
      • By Application
  19. Competition Analysis
    • Competition Deep Dive
      • Winpak Ltd
        • Overview
        • Product Portfolio
        • Profitability by Market Segments (Product/Age /Sales Channel/Region)
        • Sales Footprint
        • Strategy Overview
          • Marketing Strategy
          • Product Strategy
          • Channel Strategy
      • International Paper Company
        • Overview
        • Product Portfolio
        • Profitability by Market Segments (Product/Age /Sales Channel/Region)
        • Sales Footprint
        • Strategy Overview
          • Marketing Strategy
          • Product Strategy
          • Channel Strategy
      • Amcor plc
        • Overview
        • Product Portfolio
        • Profitability by Market Segments (Product/Age /Sales Channel/Region)
        • Sales Footprint
        • Strategy Overview
          • Marketing Strategy
          • Product Strategy
          • Channel Strategy
      • Mondi plc
        • Overview
        • Product Portfolio
        • Profitability by Market Segments (Product/Age /Sales Channel/Region)
        • Sales Footprint
        • Strategy Overview
          • Marketing Strategy
          • Product Strategy
          • Channel Strategy
      • Sealed Air Corporation
        • Overview
        • Product Portfolio
        • Profitability by Market Segments (Product/Age /Sales Channel/Region)
        • Sales Footprint
        • Strategy Overview
          • Marketing Strategy
          • Product Strategy
          • Channel Strategy
      • Tetra Pak Group
        • Overview
        • Product Portfolio
        • Profitability by Market Segments (Product/Age /Sales Channel/Region)
        • Sales Footprint
        • Strategy Overview
          • Marketing Strategy
          • Product Strategy
          • Channel Strategy
      • DS Smith
        • Overview
        • Product Portfolio
        • Profitability by Market Segments (Product/Age /Sales Channel/Region)
        • Sales Footprint
        • Strategy Overview
          • Marketing Strategy
          • Product Strategy
          • Channel Strategy
      • Smurfit Kappa Group
        • Overview
        • Product Portfolio
        • Profitability by Market Segments (Product/Age /Sales Channel/Region)
        • Sales Footprint
        • Strategy Overview
          • Marketing Strategy
          • Product Strategy
          • Channel Strategy
      • Greif, Inc.
        • Overview
        • Product Portfolio
        • Profitability by Market Segments (Product/Age /Sales Channel/Region)
        • Sales Footprint
        • Strategy Overview
          • Marketing Strategy
          • Product Strategy
          • Channel Strategy
      • Bemis Company
        • Overview
        • Product Portfolio
        • Profitability by Market Segments (Product/Age /Sales Channel/Region)
        • Sales Footprint
        • Strategy Overview
          • Marketing Strategy
          • Product Strategy
          • Channel Strategy
  20. Assumptions & Acronyms Used
  21. Research Methodology

List of Tables

  • Table 1: Global Market Value (USD Million) Forecast by Region, 2020 to 2035
  • Table 2: Global Market Volume (Units) Forecast by Region, 2020 to 2035
  • Table 3: Global Market Value (USD Million) Forecast by Substrate Type, 2020 to 2035
  • Table 4: Global Market Volume (Units) Forecast by Substrate Type, 2020 to 2035
  • Table 5: Global Market Value (USD Million) Forecast By End-Use, 2020 to 2035
  • Table 6: Global Market Volume (Units) Forecast By End-Use, 2020 to 2035
  • Table 7: Global Market Value (USD Million) Forecast By Application, 2020 to 2035
  • Table 8: Global Market Volume (Units) Forecast By Application, 2020 to 2035
  • Table 9: North America Market Value (USD Million) Forecast by Country, 2020 to 2035
  • Table 10: North America Market Volume (Units) Forecast by Country, 2020 to 2035
  • Table 11: North America Market Value (USD Million) Forecast by Substrate Type, 2020 to 2035
  • Table 12: North America Market Volume (Units) Forecast by Substrate Type, 2020 to 2035
  • Table 13: North America Market Value (USD Million) Forecast By End-Use, 2020 to 2035
  • Table 14: North America Market Volume (Units) Forecast By End-Use, 2020 to 2035
  • Table 15: North America Market Value (USD Million) Forecast By Application, 2020 to 2035
  • Table 16: North America Market Volume (Units) Forecast By Application, 2020 to 2035
  • Table 17: Latin America Market Value (USD Million) Forecast by Country, 2020 to 2035
  • Table 18: Latin America Market Volume (Units) Forecast by Country, 2020 to 2035
  • Table 19: Latin America Market Value (USD Million) Forecast by Substrate Type, 2020 to 2035
  • Table 20: Latin America Market Volume (Units) Forecast by Substrate Type, 2020 to 2035
  • Table 21: Latin America Market Value (USD Million) Forecast By End-Use, 2020 to 2035
  • Table 22: Latin America Market Volume (Units) Forecast By End-Use, 2020 to 2035
  • Table 23: Latin America Market Value (USD Million) Forecast By Application, 2020 to 2035
  • Table 24: Latin America Market Volume (Units) Forecast By Application, 2020 to 2035
  • Table 25: Europe Market Value (USD Million) Forecast by Country, 2020 to 2035
  • Table 26: Europe Market Volume (Units) Forecast by Country, 2020 to 2035
  • Table 27: Europe Market Value (USD Million) Forecast by Substrate Type, 2020 to 2035
  • Table 28: Europe Market Volume (Units) Forecast by Substrate Type, 2020 to 2035
  • Table 29: Europe Market Value (USD Million) Forecast By End-Use, 2020 to 2035
  • Table 30: Europe Market Volume (Units) Forecast By End-Use, 2020 to 2035
  • Table 31: Europe Market Value (USD Million) Forecast By Application, 2020 to 2035
  • Table 32: Europe Market Volume (Units) Forecast By Application, 2020 to 2035
  • Table 33: East Asia Market Value (USD Million) Forecast by Country, 2020 to 2035
  • Table 34: East Asia Market Volume (Units) Forecast by Country, 2020 to 2035
  • Table 35: East Asia Market Value (USD Million) Forecast by Substrate Type, 2020 to 2035
  • Table 36: East Asia Market Volume (Units) Forecast by Substrate Type, 2020 to 2035
  • Table 37: East Asia Market Value (USD Million) Forecast By End-Use, 2020 to 2035
  • Table 38: East Asia Market Volume (Units) Forecast By End-Use, 2020 to 2035
  • Table 39: East Asia Market Value (USD Million) Forecast By Application, 2020 to 2035
  • Table 40: East Asia Market Volume (Units) Forecast By Application, 2020 to 2035
  • Table 41: South Asia Market Value (USD Million) Forecast by Country, 2020 to 2035
  • Table 42: South Asia Market Volume (Units) Forecast by Country, 2020 to 2035
  • Table 43: South Asia Market Value (USD Million) Forecast by Substrate Type, 2020 to 2035
  • Table 44: South Asia Market Volume (Units) Forecast by Substrate Type, 2020 to 2035
  • Table 45: South Asia Market Value (USD Million) Forecast By End-Use, 2020 to 2035
  • Table 46: South Asia Market Volume (Units) Forecast By End-Use, 2020 to 2035
  • Table 47: South Asia Market Value (USD Million) Forecast By Application, 2020 to 2035
  • Table 48: South Asia Market Volume (Units) Forecast By Application, 2020 to 2035
  • Table 49: Oceania Market Value (USD Million) Forecast by Country, 2020 to 2035
  • Table 50: Oceania Market Volume (Units) Forecast by Country, 2020 to 2035
  • Table 51: Oceania Market Value (USD Million) Forecast by Substrate Type, 2020 to 2035
  • Table 52: Oceania Market Volume (Units) Forecast by Substrate Type, 2020 to 2035
  • Table 53: Oceania Market Value (USD Million) Forecast By End-Use, 2020 to 2035
  • Table 54: Oceania Market Volume (Units) Forecast By End-Use, 2020 to 2035
  • Table 55: Oceania Market Value (USD Million) Forecast By Application, 2020 to 2035
  • Table 56: Oceania Market Volume (Units) Forecast By Application, 2020 to 2035
  • Table 57: MEA Market Value (USD Million) Forecast by Country, 2020 to 2035
  • Table 58: MEA Market Volume (Units) Forecast by Country, 2020 to 2035
  • Table 59: MEA Market Value (USD Million) Forecast by Substrate Type, 2020 to 2035
  • Table 60: MEA Market Volume (Units) Forecast by Substrate Type, 2020 to 2035
  • Table 61: MEA Market Value (USD Million) Forecast By End-Use, 2020 to 2035
  • Table 62: MEA Market Volume (Units) Forecast By End-Use, 2020 to 2035
  • Table 63: MEA Market Value (USD Million) Forecast By Application, 2020 to 2035
  • Table 64: MEA Market Volume (Units) Forecast By Application, 2020 to 2035

List of Figures

  • Figure 1: Global Market Volume (Units) Forecast 2020 to 2035
  • Figure 2: Global Market Pricing Analysis
  • Figure 3: Global Market Value (USD Million) Forecast 2020 to 2035
  • Figure 4: Global Market Value Share and BPS Analysis by Substrate Type, 2025 and 2035
  • Figure 5: Global Market Y-o-Y Growth Comparison by Substrate Type, 2025 to 2035
  • Figure 6: Global Market Attractiveness Analysis by Substrate Type
  • Figure 7: Global Market Value Share and BPS Analysis By End-Use, 2025 and 2035
  • Figure 8: Global Market Y-o-Y Growth Comparison By End-Use, 2025 to 2035
  • Figure 9: Global Market Attractiveness Analysis By End-Use
  • Figure 10: Global Market Value Share and BPS Analysis By Application, 2025 and 2035
  • Figure 11: Global Market Y-o-Y Growth Comparison By Application, 2025 to 2035
  • Figure 12: Global Market Attractiveness Analysis By Application
  • Figure 13: Global Market Value (USD Million) Share and BPS Analysis by Region, 2025 and 2035
  • Figure 14: Global Market Y-o-Y Growth Comparison by Region, 2025 to 2035
  • Figure 15: Global Market Attractiveness Analysis by Region
  • Figure 16: North America Market Incremental $ Opportunity, 2025 to 2035
  • Figure 17: Latin America Market Incremental $ Opportunity, 2025 to 2035
  • Figure 18: Europe Market Incremental $ Opportunity, 2025 to 2035
  • Figure 19: East Asia Market Incremental $ Opportunity, 2025 to 2035
  • Figure 20: South Asia Market Incremental $ Opportunity, 2025 to 2035
  • Figure 21: Oceania Market Incremental $ Opportunity, 2025 to 2035
  • Figure 22: MEA Market Incremental $ Opportunity, 2025 to 2035
  • Figure 23: North America Market Value Share and BPS Analysis by Country, 2025 and 2035
  • Figure 24: North America Market Value Share and BPS Analysis by Substrate Type, 2025 and 2035
  • Figure 25: North America Market Y-o-Y Growth Comparison by Substrate Type, 2025 to 2035
  • Figure 26: North America Market Attractiveness Analysis by Substrate Type
  • Figure 27: North America Market Value Share and BPS Analysis By End-Use, 2025 and 2035
  • Figure 28: North America Market Y-o-Y Growth Comparison By End-Use, 2025 to 2035
  • Figure 29: North America Market Attractiveness Analysis By End-Use
  • Figure 30: North America Market Value Share and BPS Analysis By Application, 2025 and 2035
  • Figure 31: North America Market Y-o-Y Growth Comparison By Application, 2025 to 2035
  • Figure 32: North America Market Attractiveness Analysis By Application
  • Figure 33: Latin America Market Value Share and BPS Analysis by Country, 2025 and 2035
  • Figure 34: Latin America Market Value Share and BPS Analysis by Substrate Type, 2025 and 2035
  • Figure 35: Latin America Market Y-o-Y Growth Comparison by Substrate Type, 2025 to 2035
  • Figure 36: Latin America Market Attractiveness Analysis by Substrate Type
  • Figure 37: Latin America Market Value Share and BPS Analysis By End-Use, 2025 and 2035
  • Figure 38: Latin America Market Y-o-Y Growth Comparison By End-Use, 2025 to 2035
  • Figure 39: Latin America Market Attractiveness Analysis By End-Use
  • Figure 40: Latin America Market Value Share and BPS Analysis By Application, 2025 and 2035
  • Figure 41: Latin America Market Y-o-Y Growth Comparison By Application, 2025 to 2035
  • Figure 42: Latin America Market Attractiveness Analysis By Application
  • Figure 43: Europe Market Value Share and BPS Analysis by Country, 2025 and 2035
  • Figure 44: Europe Market Value Share and BPS Analysis by Substrate Type, 2025 and 2035
  • Figure 45: Europe Market Y-o-Y Growth Comparison by Substrate Type, 2025 to 2035
  • Figure 46: Europe Market Attractiveness Analysis by Substrate Type
  • Figure 47: Europe Market Value Share and BPS Analysis By End-Use, 2025 and 2035
  • Figure 48: Europe Market Y-o-Y Growth Comparison By End-Use, 2025 to 2035
  • Figure 49: Europe Market Attractiveness Analysis By End-Use
  • Figure 50: Europe Market Value Share and BPS Analysis By Application, 2025 and 2035
  • Figure 51: Europe Market Y-o-Y Growth Comparison By Application, 2025 to 2035
  • Figure 52: Europe Market Attractiveness Analysis By Application
  • Figure 53: East Asia Market Value Share and BPS Analysis by Country, 2025 and 2035
  • Figure 54: East Asia Market Value Share and BPS Analysis by Substrate Type, 2025 and 2035
  • Figure 55: East Asia Market Y-o-Y Growth Comparison by Substrate Type, 2025 to 2035
  • Figure 56: East Asia Market Attractiveness Analysis by Substrate Type
  • Figure 57: East Asia Market Value Share and BPS Analysis By End-Use, 2025 and 2035
  • Figure 58: East Asia Market Y-o-Y Growth Comparison By End-Use, 2025 to 2035
  • Figure 59: East Asia Market Attractiveness Analysis By End-Use
  • Figure 60: East Asia Market Value Share and BPS Analysis By Application, 2025 and 2035
  • Figure 61: East Asia Market Y-o-Y Growth Comparison By Application, 2025 to 2035
  • Figure 62: East Asia Market Attractiveness Analysis By Application
  • Figure 63: South Asia Market Value Share and BPS Analysis by Country, 2025 and 2035
  • Figure 64: South Asia Market Value Share and BPS Analysis by Substrate Type, 2025 and 2035
  • Figure 65: South Asia Market Y-o-Y Growth Comparison by Substrate Type, 2025 to 2035
  • Figure 66: South Asia Market Attractiveness Analysis by Substrate Type
  • Figure 67: South Asia Market Value Share and BPS Analysis By End-Use, 2025 and 2035
  • Figure 68: South Asia Market Y-o-Y Growth Comparison By End-Use, 2025 to 2035
  • Figure 69: South Asia Market Attractiveness Analysis By End-Use
  • Figure 70: South Asia Market Value Share and BPS Analysis By Application, 2025 and 2035
  • Figure 71: South Asia Market Y-o-Y Growth Comparison By Application, 2025 to 2035
  • Figure 72: South Asia Market Attractiveness Analysis By Application
  • Figure 73: Oceania Market Value Share and BPS Analysis by Country, 2025 and 2035
  • Figure 74: Oceania Market Value Share and BPS Analysis by Substrate Type, 2025 and 2035
  • Figure 75: Oceania Market Y-o-Y Growth Comparison by Substrate Type, 2025 to 2035
  • Figure 76: Oceania Market Attractiveness Analysis by Substrate Type
  • Figure 77: Oceania Market Value Share and BPS Analysis By End-Use, 2025 and 2035
  • Figure 78: Oceania Market Y-o-Y Growth Comparison By End-Use, 2025 to 2035
  • Figure 79: Oceania Market Attractiveness Analysis By End-Use
  • Figure 80: Oceania Market Value Share and BPS Analysis By Application, 2025 and 2035
  • Figure 81: Oceania Market Y-o-Y Growth Comparison By Application, 2025 to 2035
  • Figure 82: Oceania Market Attractiveness Analysis By Application
  • Figure 83: MEA Market Value Share and BPS Analysis by Country, 2025 and 2035
  • Figure 84: MEA Market Value Share and BPS Analysis by Substrate Type, 2025 and 2035
  • Figure 85: MEA Market Y-o-Y Growth Comparison by Substrate Type, 2025 to 2035
  • Figure 86: MEA Market Attractiveness Analysis by Substrate Type
  • Figure 87: MEA Market Value Share and BPS Analysis By End-Use, 2025 and 2035
  • Figure 88: MEA Market Y-o-Y Growth Comparison By End-Use, 2025 to 2035
  • Figure 89: MEA Market Attractiveness Analysis By End-Use
  • Figure 90: MEA Market Value Share and BPS Analysis By Application, 2025 and 2035
  • Figure 91: MEA Market Y-o-Y Growth Comparison By Application, 2025 to 2035
  • Figure 92: MEA Market Attractiveness Analysis By Application
  • Figure 93: Global Market - Tier Structure Analysis
  • Figure 94: Global Market - Company Share Analysis

Frequently Asked Questions

What was the overall size of the Reflective Air Packaging market in 2025?

The overall market size for Reflective Air Packaging market was USD 8.6 billion in 2025.

How big the bio is based Reflective Air Packaging market expected in 2035?

The Reflective Air Packaging market is expected to reach USD 15.0 billion in 2035.

What will drive the demand for Reflective Air Packaging market during the forecast period?

The Reflective Air Packaging market will grow due to increasing demand for temperature-sensitive shipping, sustainable insulation materials, expanding e-commerce logistics, and enhanced protective packaging in food, pharmaceuticals, and other industries.

List the top 5 countries contributing in Reflective Air Packaging market?

The top 5 countries which drives the development of Reflective Air Packaging market are USA, European Union, Japan, South Korea and UK.

Which segment in type is expected to lead Reflective Air Packaging market?

Flexible Reflective Air Packaging demand supplier to command significant share over the assessment period.

Explore Similar Insights

Future Market Insights

Reflective Air Packaging Market