Reflective Fiber Collimator Market Forecast and Outlook (2025-2035)

The reflective fiber collimator market is projected to grow from USD 337.9  million in 2025 to USD 566.4 million by 2035, with a compound annual growth rate (CAGR) of 5.3%. The YoY percentage changes reflect steady growth, but there are notable accelerations in specific years. For instance, the year-on-year growth between 2025 and 2026 shows an increase of 5.3%, which is consistent with the overall CAGR. However, as the market matures, there are years where growth becomes more pronounced, particularly in the 2029 to 2030 period, where a sharp 6% increase in revenue can be expected. This acceleration likely results from increased investments in industries like telecommunications, healthcare, and aerospace, where reflective fiber collimators are used for advanced optical systems. As fiber optics and communication networks evolve, the market continues to benefit from the expanding need for precision in light projection systems.
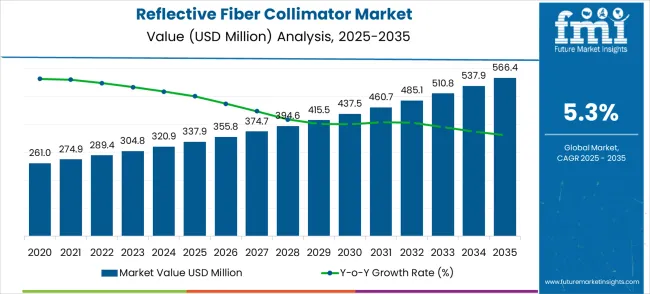
Quick Stats for Reflective Fiber Collimator Market

  • Reflective Fiber Collimator Market Value (2025): USD 337.9 million
  • Reflective Fiber Collimator Market Forecast Value (2035): USD 566.4 million
  • Reflective Fiber Collimator Market Forecast CAGR: 5.3%
  • Leading Segment in Reflective Fiber Collimator Market: Fixed Fiber Collimator (52.4%)
  • Key Growth Regions in Reflective Fiber Collimator Market: Asia Pacific, North America, and Europe
  • Top Players in Reflective Fiber Collimator Market: Schäfter+Kirchhoff, Edmund Optics, Thorlabs, IPG Photonics, Z Optics, Meet Optics, Lumiworks, Optical Surface, Optikos, LBTEK, Silicon Lightwave, Hobbite, Changchun Sunday Optics, Huirui Optics, Castech, OPTO Wide, C.F. Technology, Dimension Labs

Reflective Fiber Collimator Market Market Value Analysis

The steady YoY growth for the reflective fiber collimator market is a direct result of rising demand for high-performance optical systems, driven by industries such as telecommunications, medical diagnostics, and defense. The highest growth spike in this market is expected between 2029 and 2030, driven by technological advancements in optical fiber systems. This acceleration is likely fueled by heightened demand for reliable optical collimators used in next-gen communication infrastructure and satellite systems. Additionally, government policies and infrastructure investments in high-speed internet and satellite technologies are supporting this upward trend. As the market evolves, continued growth is expected as these sectors increasingly rely on fiber optics for their critical systems, thereby amplifying the demand for reflective fiber collimators. Thus, while the market grows steadily, these accelerations and decelerations reveal key periods of strategic expansion driven by external forces in telecommunications and defense.

Reflective Fiber Collimator Market Key Takeaways

Metric Value
Estimated Value in (2025E) USD 337.9 million
Forecast Value in (2035F) USD 566.4 million
Forecast CAGR (2025 to 2035) 5.3%

The reflective fiber collimator market is positioned within the optical components market, where it holds around 2.1% of the total market share. Within the fiber optic components market, it has a slightly higher share, at approximately 3.4%, due to the growing need for precision optical systems. In the optical fibers market, reflective fiber collimators contribute about 1.8%, driven by their utility in efficient light transmission and alignment in fiber optic systems.

Within the broader photonics market, the market share of reflective fiber collimators stands at 2.9%, as their role in manipulating light plays a crucial part in various photonic devices. Finally, in the telecommunications equipment market, reflective fiber collimators capture around 2.3% of the market share, owing to their importance in signal transmission and optical communication systems. This market is expected to grow as technological needs for precise light manipulation and communication increase across various industries.

Opportunity Pathway – Reflective Fiber Collimator Market

The reflective fiber collimator market is set for steady expansion, driven by growing fiber optic communication networks, precision device packaging, and demand for high-performance photonics. By 2035, these pathways together unlock USD 220–260 million in incremental revenue opportunities.

Pathway A – Fiber Optic Device Packaging. High-precision fixed collimators for packaging applications in telecom and datacom create the largest near-term opportunity. Expected pool: USD 50–70 million.

Pathway B – Fiber Optic Coupled Sources. Focus-adjustable collimators for coupling light sources into fiber networks and photonic devices represent a growing segment. Pool: USD 40–55 million.

Pathway C – Telecom & Data Center Networks. Deployment in high-speed optical networks and cloud infrastructure drives recurring demand for precision collimators. Market pool: USD 35–50 million.

Pathway D – LIDAR & Sensing Applications. Use in autonomous vehicles, industrial sensors, and 3D scanning applications expands demand for custom collimators. Incremental pool: USD 25–40 million.

Pathway E – Test & Measurement Systems. Collimators in fiber-optic testing equipment, lab instrumentation, and calibration devices provide a specialized niche. Pool: USD 20–30 million.

Pathway F – Emerging Photonics Markets. Adoption in quantum communication, medical photonics, and aerospace sensing presents a medium-term growth pathway. Expected pool: USD 20–30 million.

Pathway G – OEM Partnerships & Integrated Systems. Collaborating with device manufacturers for bundled optical solutions ensures steady revenue and market penetration. Pool: USD 15–25 million.

Pathway H – Precision & Custom Solutions. High-value bespoke collimators for specialized industrial, defense, and research applications offer incremental opportunities. Pool: USD 15–20 million.

Why is the Reflective Fiber Collimator Market Growing?

Market expansion is being supported by the increasing deployment of fiber optic communication systems worldwide and the corresponding demand for high-quality optical components that ensure optimal light transmission and beam quality. Modern optical systems require precise collimation to achieve the beam characteristics necessary for efficient light coupling, accurate measurement, and reliable system performance across diverse applications. Advanced reflective fiber collimators provide the optical performance characteristics needed to minimize beam divergence, reduce system losses, and maintain consistent beam quality in critical optical applications.

The growing emphasis on high-speed data transmission and advanced optical communication technologies is driving demand for precision collimators that can support demanding performance requirements in telecommunications infrastructure. Industrial applications requiring accurate laser processing and optical measurement are creating opportunities for specialized collimator designs that combine high optical performance with robust mechanical construction. The rising adoption of optical sensing systems and laser-based manufacturing processes is also contributing to increased demand for collimators with superior beam quality and environmental stability across different industrial and scientific applications.

Segmental Analysis

The market is segmented by type, end-use, and region. By type, the market is divided into fixed fiber collimator and focus-adjustable fiber collimator. Based on end-use, the market is categorized into fiber optic device packaging, fiber optic coupled source, and others. Regionally, the market is divided into North America, East Asia, South Asia & Pacific, Europe, Latin America, and Middle East & Africa.
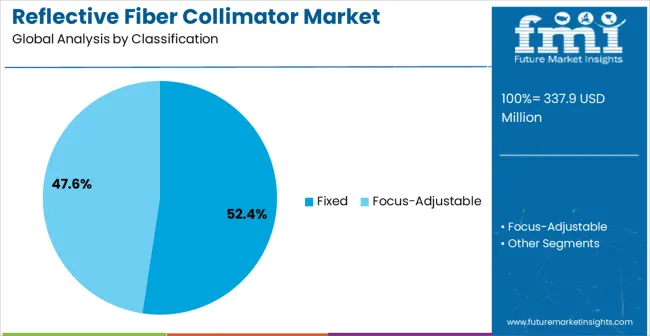
By Type, Fixed Fiber Collimator Segment Accounts for 52.4% Market Share

Reflective Fiber Collimator Market Analysis By Classification

The fixed fiber collimator segment is projected to account for 52.4% of the reflective fiber collimator market in 2025, reaffirming its position as the category's most widely adopted configuration type. Manufacturers increasingly understand the reliability and cost-effectiveness of fixed collimator designs in standard optical applications, including telecommunications systems, laser processing equipment, and optical measurement instruments. Fixed collimators' proven performance in maintaining consistent beam characteristics and simplified optical system integration directly addresses manufacturers' requirements for dependable optical components.

This collimator type forms the foundation of most volume production optical system positioning, as it represents the most economical and performance-proven solution for standard collimation applications. Industry validation and extensive field testing continue to strengthen adoption of fixed collimator systems. With optical system manufacturers demanding cost-effective solutions and reliable optical performance, fixed collimators align with both operational efficiency and manufacturing cost optimization goals. Their widespread compatibility across diverse optical configurations ensures sustained market dominance, making them the central technology driver of reflective fiber collimator demand.
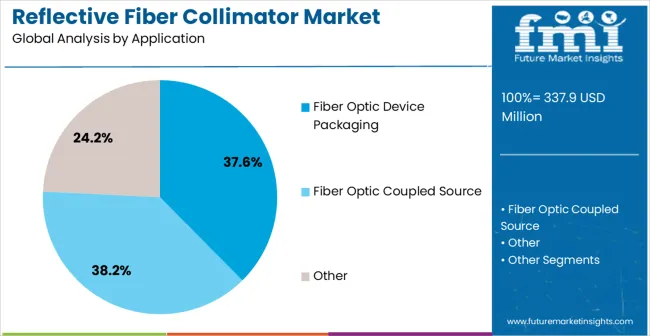
By End-Use, Fiber Optic Coupled Source Segment Accounts for 38.2% Market Share

Reflective Fiber Collimator Market Analysis By Application

The fiber optic coupled source application is projected to represent 38.2% of reflective fiber collimator demand in 2025, positioning it as the largest application category for precision optical components. This segment’s growth is anchored in its critical role in enabling efficient light delivery and stable optical performance across diverse fiber optic systems. Coupled source collimators ensure optimized beam alignment, reduced signal loss, and high coupling efficiency, making them indispensable in advanced optical device integration. Manufacturers prioritize this application for its technical importance, scalability, and contribution to next-generation optical communication and sensing platforms.

The segment is supported by rising deployment of high-bandwidth fiber optic networks and the increasing adoption of laser-based optical sources requiring precise collimation. Furthermore, the demand for miniaturized and energy-efficient optical devices continues to accelerate, reinforcing the value of coupled source collimators in compact system designs. As optical communication infrastructure and photonics-based applications expand globally, fiber optic coupled source applications are set to dominate collimator demand, consolidating their position as a cornerstone of modern optical component markets.

What are the Drivers, Restraints, and Key Trends of the Reflective Fiber Collimator Market?

The reflective fiber collimator market is experiencing growth driven by the increasing demand for precision optical devices across telecommunications, laser systems, and imaging applications. These collimators are essential for directing light beams accurately, reducing signal loss, and enhancing optical system performance. Opportunities are expanding with advancements in fiber optic technology and increasing use in medical and industrial sectors. However, challenges persist related to manufacturing complexities, high production costs, and competition from alternative optical solutions that provide similar performance at lower costs.

Increasing Demand for Precision in Optical Systems and Fiber Networks

The demand for reflective fiber collimators is rising, particularly within optical systems and fiber networks. In opinion, industries relying on high-speed communication, such as telecommunications and data transmission, depend on collimators to ensure precise beam alignment and signal clarity. As the global demand for faster and more reliable fiber optic systems continues to grow, reflective fiber collimators play an indispensable role in minimizing signal loss and improving overall system efficiency. With the expanding need for low-loss, high-precision light transmission, this market is set for continued growth in data communication and optical systems.

Opportunities in Medical, Defense, and Industrial Applications

The reflective fiber collimator market is seeing expanding opportunities in sectors such as medical, defense, and industrial applications. In opinion, reflective collimators are becoming crucial for laser-based procedures in the medical field, especially for optical imaging and surgical applications. Similarly, industries like defense and manufacturing are increasingly adopting these devices for high-precision laser systems and material processing. The market is also benefiting from growing research activities in optical sciences, where these collimators provide essential light control and manipulation. As these sectors continue to evolve, the demand for specialized, high-performance reflective fiber collimators is expected to rise.
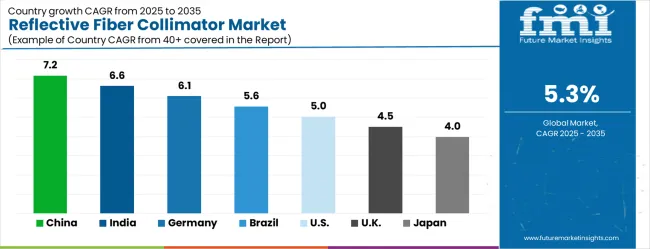
Analysis of Reflective Fiber Collimator Market by Key Country

Reflective Fiber Collimator Market Cagr Analysis By Country

Country CAGR (2025-2035)
China 7.2%
India 6.6%
Germany 6.1%
Brazil 5.6%
United States 5%
United Kingdom 4.5%
Japan 4%

The reflective fiber collimator market is experiencing steady growth globally, with China leading at 7.2% CAGR through 2035, driven by rapid expansion of fiber optic infrastructure, increasing telecommunications investment, and growing optical component manufacturing capabilities. India follows at 6.6%, supported by expanding telecommunications networks, increasing digitization initiatives, and growing optical technology adoption. Germany shows robust growth at 6.1%, emphasizing precision optical engineering and advanced photonics technology development. Brazil records 5.6%, focusing on telecommunications infrastructure modernization and optical component market development. The United States demonstrates 5.0% growth, prioritizing optical technology innovation and advanced manufacturing capabilities. The United Kingdom shows 4.5% expansion, supported by photonics research excellence and optical component development programs. Japan maintains 4.0% growth, leveraging precision manufacturing expertise and advanced optical technology capabilities.

The report covers an in-depth analysis of 40+ countries, the top-performing countries are highlighted below.

Opportunity Analysis for Reflective Fiber Collimator Market in China

The reflective fiber collimator market in China is growing at a CAGR of 7.2%, supported by the country's robust telecommunications infrastructure and expanding optical technology sector. China’s growing demand for precision optical components in industries such as fiber optics, medical devices, and laser systems is driving the adoption of reflective fiber collimators. The government’s focus on developing high-tech infrastructure and increasing investments in research and development further support market growth.

  • Robust telecommunications infrastructure drives demand for optical components in China.
  • Growing integration of fiber optics in medical devices and laser systems boosts market expansion.
  • Government initiatives and investments in research and development support the adoption of reflective fiber collimators in China.

Growth Outlook on Reflective Fiber Collimator Market in India

The reflective fiber collimator market in India is projected to grow at a CAGR of 6.6%, fueled by rising demand for optical components in the telecommunications, electronics, and research sectors. India’s growing telecommunications industry, along with increasing investments in research and technology, are driving the demand for high-precision optical devices such as reflective fiber collimators. Additionally, the country's expanding manufacturing sector further accelerates the adoption of these optical components.

  • Growing demand for precision optical components in telecommunications and research drives market growth in India.
  • Increasing investments in research and technology support the adoption of reflective fiber collimators.
  • Expanding manufacturing sector boosts the demand for high-precision optical devices in India.

In-depth Review of Reflective Fiber Collimator Market in Germany

The reflective fiber collimator market in Germany is expected to grow at a CAGR of 6.1%, driven by the country’s advanced manufacturing sector and strong research capabilities in optical technologies. Germany's focus on industrial automation, telecommunications, and scientific research continues to foster the adoption of fiber optic technologies, including reflective fiber collimators. The country’s commitment to developing high-precision optical solutions for various applications further supports market expansion.

  • Strong manufacturing and research capabilities in Germany support fiber collimator adoption.
  • Growing use of optical technologies in industrial automation, telecommunications, and research fuels market growth.
  • Demand for high-precision optical solutions in various applications continues to drive the market in Germany.

Market Analysis for Reflective Fiber Collimator Market in Brazil

The reflective fiber collimator market in Brazil is expected to grow at a CAGR of 5.6%, supported by the increasing adoption of optical components in telecommunications, industrial, and research sectors. Brazil’s growing focus on improving its telecommunications infrastructure, along with rising demand for laser systems and precision optical components, drives the market for reflective fiber collimators. Additionally, the country’s expanding technology sector and growing investments in R&D provide further momentum to market growth.
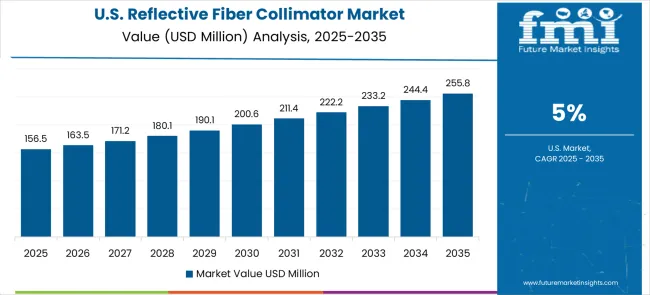
  • Growing telecommunications infrastructure and adoption of optical components fuel market growth in Brazil.
  • Rising demand for laser systems and precision optical devices boosts adoption of fiber collimators.
  • Expanding technology sector and investments in research and development support the market in Brazil.

Sales Forecast for Reflective Fiber Collimator Market in the United States

Reflective Fiber Collimator Market Country Value Analysis

The reflective fiber collimator market in the United States is growing at a CAGR of 5%, driven by the country’s advanced research and technology sectors. The USA is experiencing increasing demand for high-precision optical components in industries such as telecommunications, defense, and scientific research. The country’s focus on technological innovation and investments in fiber optic technologies further contribute to the adoption of reflective fiber collimators in various applications.

  • Increasing demand for high-precision optical components in telecommunications and defense drives market growth in the USA
  • Technological innovation and investments in fiber optics support adoption of reflective fiber collimators.
  • Rising focus on scientific research and development accelerates the demand for precision optical devices in the USA

Revenue Prospects for Reflective Fiber Collimator Market in the United Kingdom

The reflective fiber collimator market in the United Kingdom is projected to grow at a CAGR of 4.5%, supported by the country’s growing demand for optical components in research and telecommunications. The UK has been a hub for scientific research and technological development, which continues to drive the adoption of fiber optic technologies, including reflective fiber collimators. The market is further supported by ongoing innovation in telecommunications and laser technologies.
  • Growing demand for optical components in telecommunications and research fuels market growth in the UK
  • The UK’s focus on scientific research and technological development supports the adoption of fiber collimators.
  • Ongoing innovation in laser technologies and optical solutions continues to drive market expansion in the UK

Demand Assessment for Reflective Fiber Collimator Market in Japan

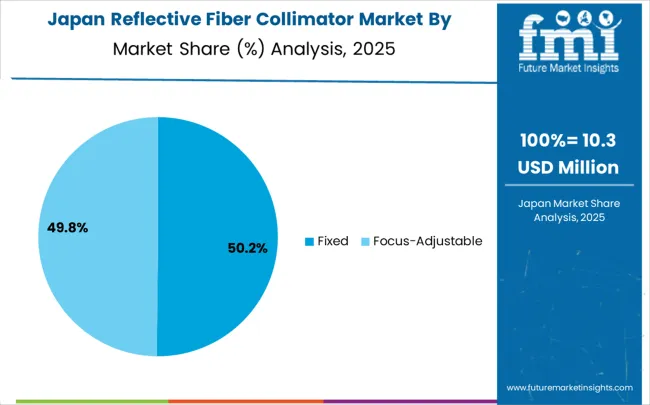
Reflective Fiber Collimator Market Japan Market Share Analysis By Classification

The reflective fiber collimator market in Japan is expected to grow at a CAGR of 4%, driven by the country’s focus on precision optical technologies and increasing demand for high-quality optical components. Japan’s growing telecommunications and electronics sectors, along with strong research and development initiatives in optical technologies, are accelerating the adoption of reflective fiber collimators. The market is also supported by Japan’s focus on automation and advanced manufacturing processes.
  • Precision optical technologies and growing demand for high-quality components drive market growth in Japan.
  • Rising adoption of fiber optics in telecommunications and electronics accelerates the demand for fiber collimators.
  • Strong research and development initiatives in optical technologies support the market expansion in Japan.

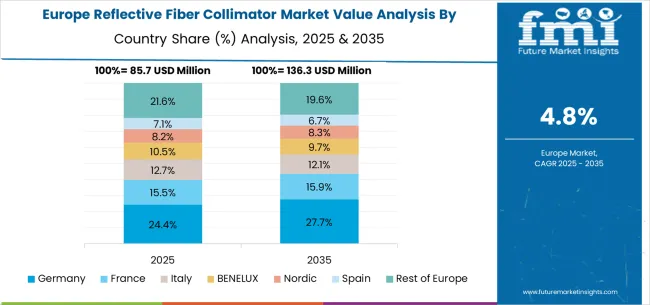
Europe Market Split by Country

Reflective Fiber Collimator Market Europe Country Market Share Analysis, 2025 & 2035

The reflective fiber collimator market in Europe is projected to grow from USD 85.7 million in 2025 to USD 136.3 million by 2035, at a CAGR of 4.8%. Germany will maintain leadership, moving from 22.4% in 2025 to 27.7% by 2035, driven by advanced optical component manufacturing, telecommunications infrastructure, and innovation in photonics. France will hold 15.5% in 2025, softening to 12.1% by 2035, reflecting a relative slowdown in adoption. Italy will see stable demand, at 12.7% in 2025 and easing to 12.1% by 2035, supported by modest but steady optical technology adoption.

The BENELUX region will account for 10.2% in 2025, slightly declining to 9.3% in 2035, while the Nordic countries will move from 8.2% to 8.3%, showing consistent demand backed by telecom expansion and high-quality standards. Spain will contribute 7.1% in 2025, dipping to 6.7% by 2035, while the Rest of Europe will shrink from 21.6% in 2025 to 19.8% by 2035, reflecting a consolidation of market activity in Germany.
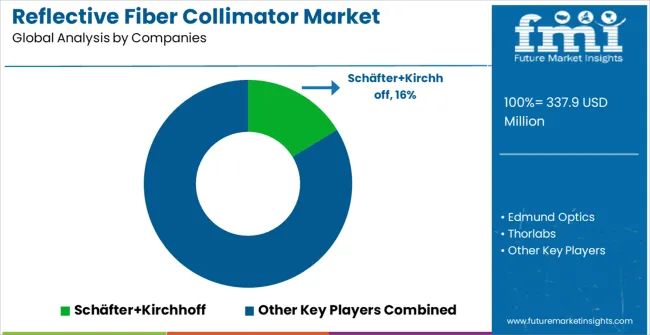
Competitive Landscape of Reflective Fiber Collimator Market

Reflective Fiber Collimator Market Analysis By Company

The reflective fiber collimator market is characterized by competition among specialized optical component manufacturers, photonics technology companies, and precision optics providers focusing on high-performance optical solutions for telecommunications and industrial applications. Companies are investing in advanced optical design capabilities, precision manufacturing technologies, comprehensive quality control programs, and technical support services to deliver reliable, accurate, and cost-effective collimator solutions for demanding optical applications. Technology innovation, optical performance optimization, and manufacturing excellence are central to strengthening product portfolios and market positioning in this specialized optical component sector.

Schäfter+Kirchhoff, Germany-based, provides comprehensive optical component solutions with focus on precision fiber optic coupling, advanced collimator designs, and specialized optical systems for research and industrial applications. Edmund Optics, USA, delivers extensive optical component portfolios with emphasis on catalog availability, technical support, and rapid delivery for diverse optical applications. Thorlabs offers sophisticated optical components and systems with focus on research applications, modular system integration, and comprehensive technical documentation. IPG Photonics provides specialized fiber optic components with emphasis on high-power laser applications and advanced optical system integration.

Z Optics delivers precision optical components with focus on custom design capabilities and specialized manufacturing processes. Meet Optics, Lumiworks, and Optical Surface provide specialized collimator solutions with emphasis on performance optimization and application-specific designs. Optikos, LBTEK, and Silicon Lightwave offer comprehensive optical testing and component solutions for demanding applications. Hobbite, Changchun Sunday Optics, Huirui Optics, Castech, OPTO Wide, C.F. Technology, and Dimension Labs provide specialized optical components across diverse market segments, maintaining focus on quality assurance, performance reliability, and cost-effective manufacturing for telecommunications, industrial, and scientific applications.

Key Players in the Reflective Fiber Collimator Market

  • Schäfter+Kirchhoff
  • Edmund Optics
  • Thorlabs
  • IPG Photonics
  • Z Optics
  • Meet Optics
  • Lumiworks
  • Optical Surface
  • Optikos
  • LBTEK
  • Silicon Lightwave
  • Hobbite
  • Changchun Sunday Optics
  • Huirui Optics
  • Castech
  • OPTO Wide
  • C.F. Technology
  • Dimension Labs

Scope of the Report

Items Values
Quantitative Units (2025) USD 337.9 million
Type Fixed Fiber Collimator, Focus-Adjustable Fiber Collimator, Others
End-Use Fiber Optic Device Packaging, Fiber Optic Coupled Source, Others
Regions Covered North America, Europe, East Asia, South Asia & Pacific, Latin America, Middle East & Africa
Countries Covered United States, Canada, United Kingdom, Germany, France, China, Japan, South Korea, India, Brazil, Australia and 40+ countries
Key Companies Profiled Schäfter+Kirchhoff, Edmund Optics, Thorlabs, IPG Photonics, Z Optics, Meet Optics, Lumiworks, Optical Surface, Optikos, LBTEK, Silicon Lightwave, Hobbite, Changchun Sunday Optics, Huirui Optics, Castech, OPTO Wide, C.F. Technology, Dimension Labs
Additional Attributes Dollar sales by collimator type and wavelength range, regional adoption trends across telecommunications and industrial markets, competitive landscape analysis with established optical component manufacturers and emerging photonics technology providers, customer preferences for fixed versus adjustable collimator configurations, integration with fiber optic systems and laser processing applications

Reflective Fiber Collimator Market by Segments

Type:

  • Fixed Fiber Collimator
  • Focus-Adjustable Fiber Collimator
  • Others

End-Use:

  • Fiber Optic Device Packaging
  • Fiber Optic Coupled Source
  • Others

Region: 

  • North America 
    • United States 
    • Canada 
    • Mexico 
  • Europe 
    • Germany 
    • United Kingdom 
    • France 
    • Italy 
    • Spain 
    • Nordic 
    • BENELUX 
    • Rest of Europe 
  • East Asia 
    • China 
    • Japan 
    • South Korea 
  • South Asia & Pacific 
    • India 
    • ASEAN 
    • Australia & New Zealand 
    • Rest of South Asia & Pacific 
  • Latin America 
    • Brazil 
    • Chile 
    • Rest of Latin America 
  • Middle East & Africa 
    • Kingdom of Saudi Arabia 
    • Other GCC Countries 
    • Turkiye 
    • South Africa 
    • Other African Union 
    • Rest of Middle East & Africa 


Table of Content

  1. Executive Summary
    • Global Market Outlook
    • Demand to side Trends
    • Supply to side Trends
    • Technology Roadmap Analysis
    • Analysis and Recommendations
  2. Market Overview
    • Market Coverage / Taxonomy
    • Market Definition / Scope / Limitations
  3. Market Background
    • Market Dynamics
      • Drivers
      • Restraints
      • Opportunity
      • Trends
    • Scenario Forecast
      • Demand in Optimistic Scenario
      • Demand in Likely Scenario
      • Demand in Conservative Scenario
    • Opportunity Map Analysis
    • Product Life Cycle Analysis
    • Supply Chain Analysis
    • Investment Feasibility Matrix
    • Value Chain Analysis
    • PESTLE and Porter’s Analysis
    • Regulatory Landscape
    • Regional Parent Market Outlook
    • Production and Consumption Statistics
    • Import and Export Statistics
  4. Global Market Analysis 2020 to 2024 and Forecast, 2025 to 2035
    • Historical Market Size Value (USD Million) Analysis, 2020 to 2024
    • Current and Future Market Size Value (USD Million) Projections, 2025 to 2035
      • Y to o to Y Growth Trend Analysis
      • Absolute $ Opportunity Analysis
  5. Global Market Pricing Analysis 2020 to 2024 and Forecast 2025 to 2035
  6. Global Market Analysis 2020 to 2024 and Forecast 2025 to 2035, By Classification
    • Introduction / Key Findings
    • Historical Market Size Value (USD Million) Analysis By Classification , 2020 to 2024
    • Current and Future Market Size Value (USD Million) Analysis and Forecast By Classification , 2025 to 2035
      • Fixed
      • Focus-Adjustable
    • Y to o to Y Growth Trend Analysis By Classification , 2020 to 2024
    • Absolute $ Opportunity Analysis By Classification , 2025 to 2035
  7. Global Market Analysis 2020 to 2024 and Forecast 2025 to 2035, By Application
    • Introduction / Key Findings
    • Historical Market Size Value (USD Million) Analysis By Application, 2020 to 2024
    • Current and Future Market Size Value (USD Million) Analysis and Forecast By Application, 2025 to 2035
      • Fiber Optic Device Packaging
      • Fiber Optic Coupled Source
      • Other
    • Y to o to Y Growth Trend Analysis By Application, 2020 to 2024
    • Absolute $ Opportunity Analysis By Application, 2025 to 2035
  8. Global Market Analysis 2020 to 2024 and Forecast 2025 to 2035, By Region
    • Introduction
    • Historical Market Size Value (USD Million) Analysis By Region, 2020 to 2024
    • Current Market Size Value (USD Million) Analysis and Forecast By Region, 2025 to 2035
      • North America
      • Latin America
      • Western Europe
      • Eastern Europe
      • East Asia
      • South Asia and Pacific
      • Middle East & Africa
    • Market Attractiveness Analysis By Region
  9. North America Market Analysis 2020 to 2024 and Forecast 2025 to 2035, By Country
    • Historical Market Size Value (USD Million) Trend Analysis By Market Taxonomy, 2020 to 2024
    • Market Size Value (USD Million) Forecast By Market Taxonomy, 2025 to 2035
      • By Country
        • USA
        • Canada
        • Mexico
      • By Classification
      • By Application
    • Market Attractiveness Analysis
      • By Country
      • By Classification
      • By Application
    • Key Takeaways
  10. Latin America Market Analysis 2020 to 2024 and Forecast 2025 to 2035, By Country
    • Historical Market Size Value (USD Million) Trend Analysis By Market Taxonomy, 2020 to 2024
    • Market Size Value (USD Million) Forecast By Market Taxonomy, 2025 to 2035
      • By Country
        • Brazil
        • Chile
        • Rest of Latin America
      • By Classification
      • By Application
    • Market Attractiveness Analysis
      • By Country
      • By Classification
      • By Application
    • Key Takeaways
  11. Western Europe Market Analysis 2020 to 2024 and Forecast 2025 to 2035, By Country
    • Historical Market Size Value (USD Million) Trend Analysis By Market Taxonomy, 2020 to 2024
    • Market Size Value (USD Million) Forecast By Market Taxonomy, 2025 to 2035
      • By Country
        • Germany
        • UK
        • Italy
        • Spain
        • France
        • Nordic
        • BENELUX
        • Rest of Western Europe
      • By Classification
      • By Application
    • Market Attractiveness Analysis
      • By Country
      • By Classification
      • By Application
    • Key Takeaways
  12. Eastern Europe Market Analysis 2020 to 2024 and Forecast 2025 to 2035, By Country
    • Historical Market Size Value (USD Million) Trend Analysis By Market Taxonomy, 2020 to 2024
    • Market Size Value (USD Million) Forecast By Market Taxonomy, 2025 to 2035
      • By Country
        • Russia
        • Poland
        • Hungary
        • Balkan & Baltic
        • Rest of Eastern Europe
      • By Classification
      • By Application
    • Market Attractiveness Analysis
      • By Country
      • By Classification
      • By Application
    • Key Takeaways
  13. East Asia Market Analysis 2020 to 2024 and Forecast 2025 to 2035, By Country
    • Historical Market Size Value (USD Million) Trend Analysis By Market Taxonomy, 2020 to 2024
    • Market Size Value (USD Million) Forecast By Market Taxonomy, 2025 to 2035
      • By Country
        • China
        • Japan
        • South Korea
      • By Classification
      • By Application
    • Market Attractiveness Analysis
      • By Country
      • By Classification
      • By Application
    • Key Takeaways
  14. South Asia and Pacific Market Analysis 2020 to 2024 and Forecast 2025 to 2035, By Country
    • Historical Market Size Value (USD Million) Trend Analysis By Market Taxonomy, 2020 to 2024
    • Market Size Value (USD Million) Forecast By Market Taxonomy, 2025 to 2035
      • By Country
        • India
        • ASEAN
        • Australia & New Zealand
        • Rest of South Asia and Pacific
      • By Classification
      • By Application
    • Market Attractiveness Analysis
      • By Country
      • By Classification
      • By Application
    • Key Takeaways
  15. Middle East & Africa Market Analysis 2020 to 2024 and Forecast 2025 to 2035, By Country
    • Historical Market Size Value (USD Million) Trend Analysis By Market Taxonomy, 2020 to 2024
    • Market Size Value (USD Million) Forecast By Market Taxonomy, 2025 to 2035
      • By Country
        • Kingdom of Saudi Arabia
        • Other GCC Countries
        • Turkiye
        • South Africa
        • Other African Union
        • Rest of Middle East & Africa
      • By Classification
      • By Application
    • Market Attractiveness Analysis
      • By Country
      • By Classification
      • By Application
    • Key Takeaways
  16. Key Countries Market Analysis
    • USA
      • Pricing Analysis
      • Market Share Analysis, 2024
        • By Classification
        • By Application
    • Canada
      • Pricing Analysis
      • Market Share Analysis, 2024
        • By Classification
        • By Application
    • Mexico
      • Pricing Analysis
      • Market Share Analysis, 2024
        • By Classification
        • By Application
    • Brazil
      • Pricing Analysis
      • Market Share Analysis, 2024
        • By Classification
        • By Application
    • Chile
      • Pricing Analysis
      • Market Share Analysis, 2024
        • By Classification
        • By Application
    • Germany
      • Pricing Analysis
      • Market Share Analysis, 2024
        • By Classification
        • By Application
    • UK
      • Pricing Analysis
      • Market Share Analysis, 2024
        • By Classification
        • By Application
    • Italy
      • Pricing Analysis
      • Market Share Analysis, 2024
        • By Classification
        • By Application
    • Spain
      • Pricing Analysis
      • Market Share Analysis, 2024
        • By Classification
        • By Application
    • France
      • Pricing Analysis
      • Market Share Analysis, 2024
        • By Classification
        • By Application
    • India
      • Pricing Analysis
      • Market Share Analysis, 2024
        • By Classification
        • By Application
    • ASEAN
      • Pricing Analysis
      • Market Share Analysis, 2024
        • By Classification
        • By Application
    • Australia & New Zealand
      • Pricing Analysis
      • Market Share Analysis, 2024
        • By Classification
        • By Application
    • China
      • Pricing Analysis
      • Market Share Analysis, 2024
        • By Classification
        • By Application
    • Japan
      • Pricing Analysis
      • Market Share Analysis, 2024
        • By Classification
        • By Application
    • South Korea
      • Pricing Analysis
      • Market Share Analysis, 2024
        • By Classification
        • By Application
    • Russia
      • Pricing Analysis
      • Market Share Analysis, 2024
        • By Classification
        • By Application
    • Poland
      • Pricing Analysis
      • Market Share Analysis, 2024
        • By Classification
        • By Application
    • Hungary
      • Pricing Analysis
      • Market Share Analysis, 2024
        • By Classification
        • By Application
    • Kingdom of Saudi Arabia
      • Pricing Analysis
      • Market Share Analysis, 2024
        • By Classification
        • By Application
    • Turkiye
      • Pricing Analysis
      • Market Share Analysis, 2024
        • By Classification
        • By Application
    • South Africa
      • Pricing Analysis
      • Market Share Analysis, 2024
        • By Classification
        • By Application
  17. Market Structure Analysis
    • Competition Dashboard
    • Competition Benchmarking
    • Market Share Analysis of Top Players
      • By Regional
      • By Classification
      • By Application
  18. Competition Analysis
    • Competition Deep Dive
      • Schäfter+Kirchhoff
        • Overview
        • Product Portfolio
        • Profitability by Market Segments (Product/Age /Sales Channel/Region)
        • Sales Footprint
        • Strategy Overview
          • Marketing Strategy
          • Product Strategy
          • Channel Strategy
      • Edmund Optics
      • Thorlabs
      • IPG Photonics
      • Z Optics
      • Meet Optics
      • Lumiworks
      • Optical Surface
      • Optikos
      • LBTEK
      • Silicon Lightwave
      • Hobbite
      • Changchun Sunday Optics
      • Huirui Optics
      • Castech
      • OPTO Wide
      • C.F. Technology
      • Dimension Labs
      • CF
  19. Assumptions & Acronyms Used
  20. Research Methodology

List of Tables

  • Table 1: Global Market Value (USD Million) Forecast by Region, 2020 to 2035
  • Table 2: Global Market Value (USD Million) Forecast by Classification , 2020 to 2035
  • Table 3: Global Market Value (USD Million) Forecast by Application, 2020 to 2035
  • Table 4: North America Market Value (USD Million) Forecast by Country, 2020 to 2035
  • Table 5: North America Market Value (USD Million) Forecast by Classification , 2020 to 2035
  • Table 6: North America Market Value (USD Million) Forecast by Application, 2020 to 2035
  • Table 7: Latin America Market Value (USD Million) Forecast by Country, 2020 to 2035
  • Table 8: Latin America Market Value (USD Million) Forecast by Classification , 2020 to 2035
  • Table 9: Latin America Market Value (USD Million) Forecast by Application, 2020 to 2035
  • Table 10: Western Europe Market Value (USD Million) Forecast by Country, 2020 to 2035
  • Table 11: Western Europe Market Value (USD Million) Forecast by Classification , 2020 to 2035
  • Table 12: Western Europe Market Value (USD Million) Forecast by Application, 2020 to 2035
  • Table 13: Eastern Europe Market Value (USD Million) Forecast by Country, 2020 to 2035
  • Table 14: Eastern Europe Market Value (USD Million) Forecast by Classification , 2020 to 2035
  • Table 15: Eastern Europe Market Value (USD Million) Forecast by Application, 2020 to 2035
  • Table 16: East Asia Market Value (USD Million) Forecast by Country, 2020 to 2035
  • Table 17: East Asia Market Value (USD Million) Forecast by Classification , 2020 to 2035
  • Table 18: East Asia Market Value (USD Million) Forecast by Application, 2020 to 2035
  • Table 19: South Asia and Pacific Market Value (USD Million) Forecast by Country, 2020 to 2035
  • Table 20: South Asia and Pacific Market Value (USD Million) Forecast by Classification , 2020 to 2035
  • Table 21: South Asia and Pacific Market Value (USD Million) Forecast by Application, 2020 to 2035
  • Table 22: Middle East & Africa Market Value (USD Million) Forecast by Country, 2020 to 2035
  • Table 23: Middle East & Africa Market Value (USD Million) Forecast by Classification , 2020 to 2035
  • Table 24: Middle East & Africa Market Value (USD Million) Forecast by Application, 2020 to 2035

List of Figures

  • Figure 1: Global Market Pricing Analysis
  • Figure 2: Global Market Value (USD Million) Forecast 2020-2035
  • Figure 3: Global Market Value Share and BPS Analysis by Classification , 2025 and 2035
  • Figure 4: Global Market Y to o to Y Growth Comparison by Classification , 2025-2035
  • Figure 5: Global Market Attractiveness Analysis by Classification
  • Figure 6: Global Market Value Share and BPS Analysis by Application, 2025 and 2035
  • Figure 7: Global Market Y to o to Y Growth Comparison by Application, 2025-2035
  • Figure 8: Global Market Attractiveness Analysis by Application
  • Figure 9: Global Market Value (USD Million) Share and BPS Analysis by Region, 2025 and 2035
  • Figure 10: Global Market Y to o to Y Growth Comparison by Region, 2025-2035
  • Figure 11: Global Market Attractiveness Analysis by Region
  • Figure 12: North America Market Incremental Dollar Opportunity, 2025-2035
  • Figure 13: Latin America Market Incremental Dollar Opportunity, 2025-2035
  • Figure 14: Western Europe Market Incremental Dollar Opportunity, 2025-2035
  • Figure 15: Eastern Europe Market Incremental Dollar Opportunity, 2025-2035
  • Figure 16: East Asia Market Incremental Dollar Opportunity, 2025-2035
  • Figure 17: South Asia and Pacific Market Incremental Dollar Opportunity, 2025-2035
  • Figure 18: Middle East & Africa Market Incremental Dollar Opportunity, 2025-2035
  • Figure 19: North America Market Value Share and BPS Analysis by Country, 2025 and 2035
  • Figure 20: North America Market Value Share and BPS Analysis by Classification , 2025 and 2035
  • Figure 21: North America Market Y to o to Y Growth Comparison by Classification , 2025-2035
  • Figure 22: North America Market Attractiveness Analysis by Classification
  • Figure 23: North America Market Value Share and BPS Analysis by Application, 2025 and 2035
  • Figure 24: North America Market Y to o to Y Growth Comparison by Application, 2025-2035
  • Figure 25: North America Market Attractiveness Analysis by Application
  • Figure 26: Latin America Market Value Share and BPS Analysis by Country, 2025 and 2035
  • Figure 27: Latin America Market Value Share and BPS Analysis by Classification , 2025 and 2035
  • Figure 28: Latin America Market Y to o to Y Growth Comparison by Classification , 2025-2035
  • Figure 29: Latin America Market Attractiveness Analysis by Classification
  • Figure 30: Latin America Market Value Share and BPS Analysis by Application, 2025 and 2035
  • Figure 31: Latin America Market Y to o to Y Growth Comparison by Application, 2025-2035
  • Figure 32: Latin America Market Attractiveness Analysis by Application
  • Figure 33: Western Europe Market Value Share and BPS Analysis by Country, 2025 and 2035
  • Figure 34: Western Europe Market Value Share and BPS Analysis by Classification , 2025 and 2035
  • Figure 35: Western Europe Market Y to o to Y Growth Comparison by Classification , 2025-2035
  • Figure 36: Western Europe Market Attractiveness Analysis by Classification
  • Figure 37: Western Europe Market Value Share and BPS Analysis by Application, 2025 and 2035
  • Figure 38: Western Europe Market Y to o to Y Growth Comparison by Application, 2025-2035
  • Figure 39: Western Europe Market Attractiveness Analysis by Application
  • Figure 40: Eastern Europe Market Value Share and BPS Analysis by Country, 2025 and 2035
  • Figure 41: Eastern Europe Market Value Share and BPS Analysis by Classification , 2025 and 2035
  • Figure 42: Eastern Europe Market Y to o to Y Growth Comparison by Classification , 2025-2035
  • Figure 43: Eastern Europe Market Attractiveness Analysis by Classification
  • Figure 44: Eastern Europe Market Value Share and BPS Analysis by Application, 2025 and 2035
  • Figure 45: Eastern Europe Market Y to o to Y Growth Comparison by Application, 2025-2035
  • Figure 46: Eastern Europe Market Attractiveness Analysis by Application
  • Figure 47: East Asia Market Value Share and BPS Analysis by Country, 2025 and 2035
  • Figure 48: East Asia Market Value Share and BPS Analysis by Classification , 2025 and 2035
  • Figure 49: East Asia Market Y to o to Y Growth Comparison by Classification , 2025-2035
  • Figure 50: East Asia Market Attractiveness Analysis by Classification
  • Figure 51: East Asia Market Value Share and BPS Analysis by Application, 2025 and 2035
  • Figure 52: East Asia Market Y to o to Y Growth Comparison by Application, 2025-2035
  • Figure 53: East Asia Market Attractiveness Analysis by Application
  • Figure 54: South Asia and Pacific Market Value Share and BPS Analysis by Country, 2025 and 2035
  • Figure 55: South Asia and Pacific Market Value Share and BPS Analysis by Classification , 2025 and 2035
  • Figure 56: South Asia and Pacific Market Y to o to Y Growth Comparison by Classification , 2025-2035
  • Figure 57: South Asia and Pacific Market Attractiveness Analysis by Classification
  • Figure 58: South Asia and Pacific Market Value Share and BPS Analysis by Application, 2025 and 2035
  • Figure 59: South Asia and Pacific Market Y to o to Y Growth Comparison by Application, 2025-2035
  • Figure 60: South Asia and Pacific Market Attractiveness Analysis by Application
  • Figure 61: Middle East & Africa Market Value Share and BPS Analysis by Country, 2025 and 2035
  • Figure 62: Middle East & Africa Market Value Share and BPS Analysis by Classification , 2025 and 2035
  • Figure 63: Middle East & Africa Market Y to o to Y Growth Comparison by Classification , 2025-2035
  • Figure 64: Middle East & Africa Market Attractiveness Analysis by Classification
  • Figure 65: Middle East & Africa Market Value Share and BPS Analysis by Application, 2025 and 2035
  • Figure 66: Middle East & Africa Market Y to o to Y Growth Comparison by Application, 2025-2035
  • Figure 67: Middle East & Africa Market Attractiveness Analysis by Application
  • Figure 68: Global Market - Tier Structure Analysis
  • Figure 69: Global Market - Company Share Analysis

Frequently Asked Questions

How big is the reflective fiber collimator market in 2025?

The global reflective fiber collimator market is estimated to be valued at USD 337.9 million in 2025.

What will be the size of reflective fiber collimator market in 2035?

The market size for the reflective fiber collimator market is projected to reach USD 566.4 million by 2035.

How much will be the reflective fiber collimator market growth between 2025 and 2035?

The reflective fiber collimator market is expected to grow at a 5.3% CAGR between 2025 and 2035.

What are the key product types in the reflective fiber collimator market?

The key product types in reflective fiber collimator market are fixed and focus-adjustable.

Which application segment to contribute significant share in the reflective fiber collimator market in 2025?

In terms of application, fiber optic coupled source segment to command 38.2% share in the reflective fiber collimator market in 2025.

Explore Similar Insights

Future Market Insights

Reflective Fiber Collimator Market

Chat With

MaRIA

Hi There, I am MaRIA, Your Market Research Intelligence Assistant. How may I help you?