Reports

- Global Locations -

Headquarters

Future Market Insights, Inc.

Christiana Corporate, 200
Continental Drive, Suite 401,
Newark, Delaware - 19713,
United States

T: +1-845-579-5705

Americas

Future Market Insights, Inc.

616 Corporate Way, Suite 2-9018,
Valley Cottage, NY 10989, United States

T: +1-347-918-3531

MEA

Future Market Insights

1602-6 Jumeirah Bay X2 Tower, Plot No: JLT-PH2-X2A,
Jumeirah Lakes Towers, Dubai,
United Arab Emirates

Europe

Future Market Insights

3rd Floor, 207 Regent Street,
W1B 3HH London
United Kingdom

T: + 44 (0) 20 8123 9659
D: +44 (0) 20 3287 4268

Asia Pacific

Future Market Insights

IndiaLand Global Tech Park, Unit UG-1, Behind Grand HighStreet, Phase 1, Hinjawadi, MH, Pune – 411057, India

Retro-Reflective Labels Market Overview (2022-2032)

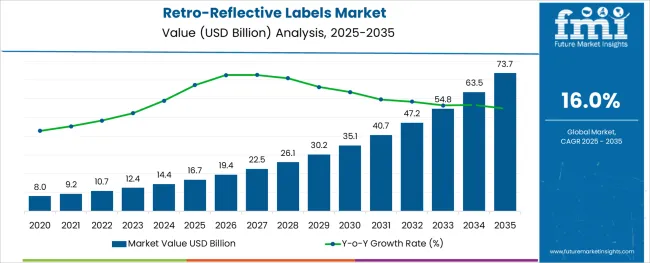
[250 Pages Report] The retro-reflective labels market is projected to register a CAGR of 12% during the forecast period, up from US$ 4.87 Bn in 2021 to reach a valuation of US$ 17 Bn by 2032.

The retro-reflective labels market is anticipated to show promising growth prospects during the forecast period as a result of growing competition. New competitors are offering a variety of options at reasonable pricing to fulfill the demand for retro-reflective labels making them more accessible to customers in the global retro-reflective labels market.

Labels are critical components of a packaged product's value chain. Sales of retro-reflective labels are increasing since businesses frequently use packaging and labeling for their products, making the label an integral part of the consumer contact. Retro-Reflective labels provide information on a variety of product qualities, such as the producer, the contents and ingredients, and the recommended use.

Apart from providing information about the goods, labels also serve as a kind of branding and marketing communication. The primary benefit of retro-reflective labels is long-range scanning, which is mostly utilised in warehouses for racking and stacking items at higher elevations.

Report Attribute Details
Estimated Base Year Value (2021) US$  9.3 Billion
Expected Market Value (2022) US$ 10.7 Billion
Anticipated Forecast Value (2032) US$ 47.6 Billion
Projected Growth Rate (2022-2032)  16 % CAGR

Sales of retro-reflective labels are expected to rise significantly. In addition to this, sales of retro-reflective labels are rising on account of US$ 19.5 Bn by 2026. Increasing demand for retro-reflective labels is also projected to contribute to the growth of the retro-reflective labels market share.

Barcode labels with a long range may make tracking crates and shipping containers as simple as tracking products in a shop. Retro-reflective labels are created by embedding glass beads or tiny shards beneath the surface. These beads or shards reflect light back.

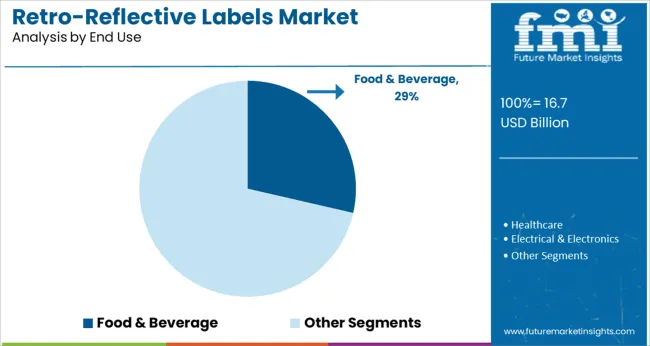
Sales of retro-reflective labels are increasing due to their several uses in a variety of end-use sectors, including food and beverage, healthcare and pharmaceuticals, electrical and electronics, shipping and logistics, and cosmetics and personal care.

Manufacturers in the retro-reflective labels market get a big platform from which to serve the whole demand for retro-reflective labels. The demand for retro-reflective labels is seeing increased competition. With growing competition, new competitors are offering a variety of options at reasonable pricing, fulfilling the demand for retro-reflective labels more accessible to customers.

Avery Dennison Corporation, UPM Raflatac, PPG Industries, Inc., Brady Worldwide, Inc., 3M Company, Lintec Corporation, etc., are some of the leading participants in the retro-reflective labels market.

Don't pay for what you don't need

Customize your report by selecting specific countries or regions and save 30%!

What are the Key Contributors to the Retro-Reflective Labels Market Share?

The worldwide retroreflective labels market is segmented by producers that specialize in retail and industrial applications. Sales of retroreflective labels are subject to improvement due to technological compositions and sophisticated design principles that are included in the material selection and production process. 

Retroreflective labels simplify identification, and reflective barcodes, with their long-range legibility, are ideal for expediting identification in industrial applications. For example, warehouses can utilize long-range labels to identify fourth-tier bins. By reading a retroreflective label on a bin from a distance of more than 30 feet, a forklift operator may instantly retrieve critical information about that bin — what it contains, where it has to be transported, and where it originated from. 

Sales of retroreflective labels are also blooming as they provide several advantages, including economic effectiveness, reduced labour needs, and simplicity of inventory management. The worldwide sales of retroreflective labels rapid expansion are projected to fuel demand for retroreflective labels

The ease and comfort of transporting bulk packaging solutions safely have fueled the rise in worldwide sales of retroreflective labels. Manufacturers of retroreflective labels are seeing significant business prospects growing demand for retroreflective labels from manufacturers and shipping & logistics end-users. 

Barcodes have been in use for decades and have developed into a critical component of business in terms of utility. Only during the last decade have barcodes seen a boom in popularity. Improving sales of retroreflective labels is due to the technological surge in connection, where the majority of customers obtain information via electronic devices. 

Due to their longevity, thermal transfer labels are increasingly being utilised to print barcodes. Additionally, brand owners and package manufacturers worldwide are looking for novel ways to meet the demand for retroreflective labels through technical developments in retroreflective labels production. These factors are projected to fuel the sales of retroreflective labels even more throughout the forecast period.

Which is the Key Retro-Reflective Labels Market?

The greatest market for sales of retro-reflective labels is APAC. The area's rapid expansion in industries such as automotive and transportation, as well as building and infrastructure, has helped the region establish a leadership position in the global retro-reflective labels market

According to significant producers such as 3M (US), ORAFOL (Germany), and Avery Dennison, the area is also a prospective in the retro-reflective labels market (US). The area has a significant demand for retro-reflective labels used in a variety of applications, including safety gear, road markings, signboards, and conspicuity markings.
Ismail Sutaria
Ismail Sutaria

Principal Consultant

Talk to Analyst

Find your sweet spots for generating winning opportunities in this market.

How Strong is the Competition in the Retro-Reflective Labels Market?

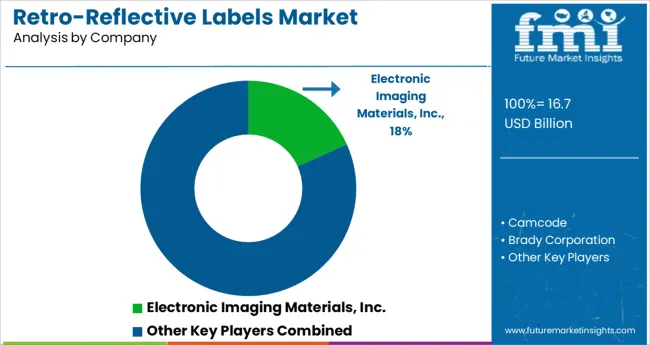
Avery Dennison Corporation, UPM Raflatac, PPG Industries, Inc., Brady Worldwide, Inc., 3M Company, Lintec Corporation, etc. are some of the leading participants in the retro-reflective labels market.

Recent Developments of the Retro-Reflective Labels Market:

  • Scott Safety (US), a leading maker of innovative products such as self-contained breathing apparatus (SCBA) systems, gas and flame detection equipment, and other safety gear, was bought by 3M in October 2017. Through this purchase, 3M expanded the product portfolio of its personal safety business segment. Along with reflective materials, 3M's personal safety division offers products and solutions such as head, eye, and facial protection.

ORAFOL purchased a graphic distributor with a substantial presence in Melbourne, Perth, and Adelaide in August 2017. (Australia). With such a broad presence, the acquired graphic distributor became the only provider of ORAFOL goods in Australia's retro-reflective and 

Scope of Report

Report Attribute Details
Growth rate CAGR of 16% from 2022 to 2032
Base year for estimation 2021
Historical data 2015 - 2020
Forecast period 2022 - 2032
Quantitative units Revenue in USD Million and CAGR from 2022 to 2032
Report coverage Revenue forecast, volume forecast, company ranking, competitive landscape, growth factors, and trends, Pricing Analysis
Segments covered Product type, material type, application, end users, region
Regional scope North America; Western Europe, Eastern Europe, Middle East, Africa, ASEAN, South Asia, Rest of Asia, Australia and New Zealand
Country scope U.S.; Canada; Mexico; Germany; U.K.; France; Italy; Spain; Russia; Belgium; Poland; Czech Republic; China; India; Japan; Australia; Brazil; Argentina; Colombia; Saudi Arabia; UAE; Iran; South Africa
Key companies profiled Avery Dennison Corporation, UPM Raflatac, PPG Industries, Inc., Brady Worldwide, Inc., 3M Company, Lintec Corporation, etc.
Customization scope Free report customization (equivalent to up to 8 analysts working days) with purchase. Addition or alteration to country, regional & segment scope.
Pricing and purchase options Avail of customized purchase options to meet your exact research needs.

Get the data you need at a Fraction of the cost

Personalize your report by choosing insights you need
and save 40%!

Key Segments For Retro-Reflective Labels Market

By Product Type:

  • Pre-printed
  • Personalized (On-demand)

By Material Type:

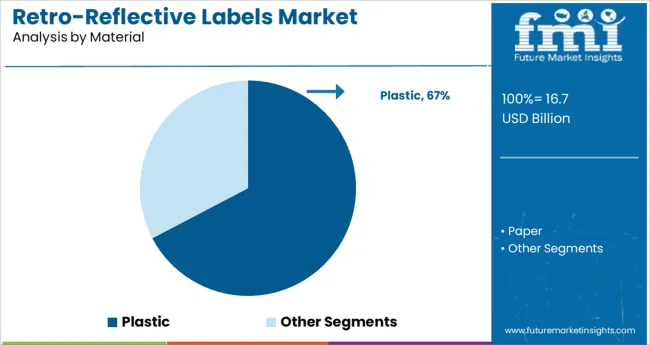
  • Plastic
  • Paper
  • Glass Beads

By Application:

  • Manufacturers
  • Shipping & logistics

By End User:

  • Food & Beverages
  • Healthcare & Pharmaceuticals
  • Electrical & Electronics
  • Cosmetics & Personal Care
  • Chemicals & Fertilizers
  • Other Industries

By Region:

  • North America (U.S., Canada)
  • Latin America (Mexico, Brazil)
  • Europe (Germany, U.K., France, Italy, Spain, Poland, Russia)
  • East Asia (China, Japan, South Korea)
  • South Asia (India, Thailand, Malaysia, Vietnam, Indonesia)
  • Oceania (Australia, New Zealand)
  • Middle East & Africa (GCC Countries, Turkey, Northern Africa, South Africa)

Frequently Asked Questions

What is the Growth Outlook for the Retro-Reflective Labels Market?

The retro-reflective labels market is predicted to register a CAGR of 16% during the forecast period.

Who are the Key Players in the Retro-Reflective Labels Market?

Key players holding substantial retro-reflective labels market share include Avery Dennison Corporation, UPM Raflatac, PPG Industries, Inc., Brady Worldwide, Inc., 3M Company, Lintec Corporation and many more.

What is the Future of the Retro-Reflective Labels Market?

As per the analysis, the retro-reflective labels market share is likely to be US$ 19.5 Bn by 2026.

Which is the Key Driver in the Retro-Reflective Labels Market?

Sales of retro-reflective labels are also blooming as it provide several advantages, including economic effectiveness, reduced labour needs, and simplicity of inventory management.

Table of Content

1. Executive Summary

    1.1. Global Market Outlook

    1.2. Demand-side Trends

    1.3. Supply-side Trends

    1.4. Technology Roadmap Analysis

    1.5. Analysis and Recommendations

2. Market Overview

    2.1. Market Coverage / Taxonomy

    2.2. Market Definition / Scope / Limitations

3. Market Background

    3.1. Market Dynamics

        3.1.1. Drivers

        3.1.2. Restraints

        3.1.3. Opportunity

        3.1.4. Trends

    3.2. Impact of Covid-19

        3.2.1. Demand in Optimistic Scenario

        3.2.2. Demand in Likely Scenario

        3.2.3. Demand in Conservative Scenario

    3.3. Macro Factors and Forecast Factors

    3.4. Value Chain Analysis

        3.4.1. Profit Margin Analysis

        3.4.2. Raw Material Suppliers

        3.4.3. Manufacturers, Wholesalers and Distributors

        3.4.4. End Users/ Customers

    3.5. Regional Parent Market Outlook

    3.6. Production and Consumption Statistics

    3.7. Global Average Pricing Analysis Benchmark

4. Global Market Analysis 2015-2021 and Forecast, 2022-2032

    4.1. Historical Market Size Value (US$ Mn) & Volume (Sq. Mt.) Analysis, 2015-2021

    4.2. Current and Future Market Size Value (US$ Mn) & Volume (Sq. Mt.) Projections, 2022-2032

        4.2.1. Y-o-Y Growth Trend Analysis

        4.2.2. Absolute $ Opportunity Analysis

5. Global Market Analysis 2015–2021 and Forecast 2022–2032, By Material

    5.1. Introduction / Key Findings

    5.2. Historical Market Size Value (US$ Mn) & Volume (Sq. Mt.) Analysis by Material, 2015-2021

    5.3. Current and Future Market Size Value (US$ Mn) & Volume (Sq. Mt.) Analysis and Forecast by Material, 2022-2032

        5.3.1. Plastic

        5.3.2. Paper

    5.4. Y-o-Y Growth Trend Analysis by Material, 2015-2021

    5.5. Absolute $ Opportunity Analysis by Material, 2022-2032

6. Global Market Analysis 2015–2021 and Forecast 2022–2032, By Printing

    6.1. Introduction / Key Findings

    6.2. Historical Market Size Value (US$ Mn) & Volume (Sq. Mt.) Analysis by Printing, 2015-2021

    6.3. Current and Future Market Size Value (US$ Mn) & Volume (Sq. Mt.) Analysis and Forecast by Printing, 2022-2032

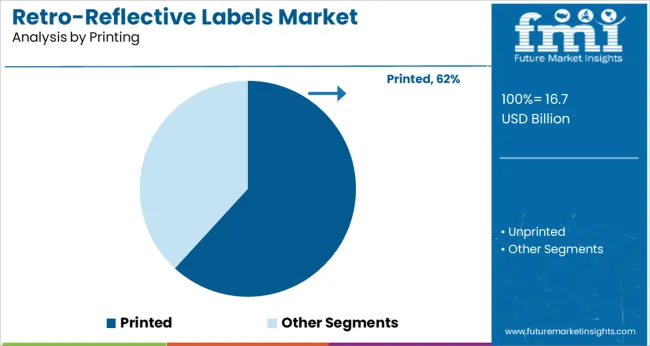
        6.3.1. Printed

        6.3.2. Unprinted

    6.4. Y-o-Y Growth Trend Analysis by Printing, 2015-2021

    6.5. Absolute $ Opportunity Analysis by Printing, 2022-2032

7. Global Market Analysis 2015–2021 and Forecast 2022–2032, By End Use

    7.1. Introduction / Key Findings

    7.2. Historical Market Size Value (US$ Mn) & Volume (Sq. Mt.) Analysis by End Use, 2015-2021

    7.3. Current and Future Market Size Value (US$ Mn) & Volume (Sq. Mt.) Analysis and Forecast by End Use, 2022-2032

        7.3.1. Food & Beverage

        7.3.2. Healthcare

        7.3.3. Electrical & Electronics

        7.3.4. Shipping & Logistics

        7.3.5. Other Consumer Goods

    7.4. Y-o-Y Growth Trend Analysis by End Use, 2015-2021

    7.5. Absolute $ Opportunity Analysis by End Use, 2022-2032

8. Global Market Analysis 2015–2021 and Forecast 2022–2032, By Region

    8.1. Introduction / Key Findings

    8.2. Historical Market Size Value (US$ Mn) & Volume (Sq. Mt.) Analysis by Region, 2015-2021

    8.3. Current and Future Market Size Value (US$ Mn) & Volume (Sq. Mt.) Analysis and Forecast by Region, 2022-2032

        8.3.1. North America

        8.3.2. Latin America

        8.3.3. Europe

        8.3.4. East Asia

        8.3.5. South Asia

        8.3.6. Oceania

        8.3.7. Middle East and Africa (MEA)

    8.4. Market Attractiveness Analysis, by Region

9. North America Market Analysis 2015–2021 and Forecast 2022–2032, By Country

    9.1. Historical Market Size Value (US$ Mn) & Volume (Sq. Mt.) Trend Analysis by Market Taxonomy, 2015-2021

    9.2. Market Size Value (US$ Mn) & Volume (Sq. Mt.) Forecast by Market Taxonomy, 2022-2032

        9.2.1. By Country

            9.2.1.1. U.S.

            9.2.1.2. Canada

        9.2.2. By Material

        9.2.3. By Printing

        9.2.4. By End Use

    9.3. Market Attractiveness Analysis

        9.3.1. By Country

        9.3.2. By Material

        9.3.3. By Printing

        9.3.4. By End Use

    9.4. Key Takeaways

10. Latin America Market Analysis 2015–2021 and Forecast 2022–2032, By Country

    10.1. Historical Market Size Value (US$ Mn) & Volume (Sq. Mt.) Trend Analysis by Market Taxonomy, 2015-2021

    10.2. Market Size Value (US$ Mn) & Volume (Sq. Mt.) Forecast by Market Taxonomy, 2022-2032

        10.2.1. By Country

            10.2.1.1. Brazil

            10.2.1.2. Mexico

            10.2.1.3. Argentina

            10.2.1.4. Chile

            10.2.1.5. Peru

            10.2.1.6. Rest of Latin America

        10.2.2. By Material

        10.2.3. By Printing

        10.2.4. By End Use

    10.3. Market Attractiveness Analysis

        10.3.1. By Country

        10.3.2. By Material

        10.3.3. By Printing

        10.3.4. By End Use

    10.4. Key Takeaways

11. Europe Market Analysis 2015–2021 and Forecast 2022–2032, By Country

    11.1. Historical Market Size Value (US$ Mn) & Volume (Sq. Mt.) Trend Analysis by Market Taxonomy, 2015-2021

    11.2. Market Size Value (US$ Mn) & Volume (Sq. Mt.) Forecast by Market Taxonomy, 2022-2032

        11.2.1. By Country

            11.2.1.1. Germany

            11.2.1.2. Italy

            11.2.1.3. France

            11.2.1.4. U.K.

            11.2.1.5. Spain

            11.2.1.6. BENELUX

            11.2.1.7. Nordic

            11.2.1.8. Russia

            11.2.1.9. Poland

            11.2.1.10. Rest of Europe

        11.2.2. By Material

        11.2.3. By Printing

        11.2.4. By End Use

    11.3. Market Attractiveness Analysis

        11.3.1. By Country

        11.3.2. By Material

        11.3.3. By Printing

        11.3.4. By End Use

    11.4. Key Takeaways

12. East Asia Market Analysis 2015–2021 and Forecast 2022–2032, By Country

    12.1. Historical Market Size Value (US$ Mn) & Volume (Sq. Mt.) Trend Analysis by Market Taxonomy, 2015-2021

    12.2. Market Size Value (US$ Mn) & Volume (Sq. Mt.) Forecast by Market Taxonomy, 2022-2032

        12.2.1. By Country

            12.2.1.1. China

            12.2.1.2. Japan

            12.2.1.3. South Korea

        12.2.2. By Material

        12.2.3. By Printing

        12.2.4. By End Use

    12.3. Market Attractiveness Analysis

        12.3.1. By Country

        12.3.2. By Material

        12.3.3. By Printing

        12.3.4. By End Use

    12.4. Key Takeaways

13. South Asia Market Analysis 2015–2021 and Forecast 2022–2032, By Country

    13.1. Historical Market Size Value (US$ Mn) & Volume (Sq. Mt.) Trend Analysis by Market Taxonomy, 2015-2021

    13.2. Market Size Value (US$ Mn) & Volume (Sq. Mt.) Forecast by Market Taxonomy, 2022-2032

        13.2.1. By Country

            13.2.1.1. India

            13.2.1.2. Thailand

            13.2.1.3. Malaysia

            13.2.1.4. Indonesia

            13.2.1.5. Rest of South Asia

        13.2.2. By Material

        13.2.3. By Printing

        13.2.4. By End Use

    13.3. Market Attractiveness Analysis

        13.3.1. By Country

        13.3.2. By Material

        13.3.3. By Printing

        13.3.4. By End Use

    13.4. Key Takeaways

14. Oceania Market Analysis 2015–2021 and Forecast 2022–2032, By Country

    14.1. Historical Market Size Value (US$ Mn) & Volume (Sq. Mt.) Trend Analysis by Market Taxonomy, 2015-2021

    14.2. Market Size Value (US$ Mn) & Volume (Sq. Mt.) Forecast by Market Taxonomy, 2022-2032

        14.2.1. By Country

            14.2.1.1. Australia

            14.2.1.2. New Zealand

        14.2.2. By Material

        14.2.3. By Printing

        14.2.4. By End Use

    14.3. Market Attractiveness Analysis

        14.3.1. By Country

        14.3.2. By Material

        14.3.3. By Printing

        14.3.4. By End Use

    14.4. Key Takeaways

15. Middle East & Africa Market Analysis 2015–2021 and Forecast 2022–2032, By Country

    15.1. Historical Market Size Value (US$ Mn) & Volume (Sq. Mt.) Trend Analysis by Market Taxonomy, 2015-2021

    15.2. Market Size Value (US$ Mn) & Volume (Sq. Mt.) Forecast by Market Taxonomy, 2022-2032

        15.2.1. By Country

            15.2.1.1. GCC Countries

            15.2.1.2. Turkey

            15.2.1.3. Northern Africa

            15.2.1.4. South Africa

            15.2.1.5. Rest of MEA

        15.2.2. By Material

        15.2.3. By Printing

        15.2.4. By End Use

    15.3. Market Attractiveness Analysis

        15.3.1. By Country

        15.3.2. By Material

        15.3.3. By Printing

        15.3.4. By End Use

    15.4. Key Takeaways

16. Country wise Market Analysis

    16.1. United States (U.S.)

        16.1.1. Market Share Analysis, 2022

        16.1.2. By Material

        16.1.3. By Printing

        16.1.4. By End Use

    16.2. Canada

        16.2.1. Market Share Analysis, 2022

        16.2.2. By Material

        16.2.3. By Printing

        16.2.4. By End Use

    16.3. Brazil

        16.3.1. Market Share Analysis, 2022

        16.3.2. By Material

        16.3.3. By Printing

        16.3.4. By End Use

    16.4. Mexico

        16.4.1. Market Share Analysis, 2022

        16.4.2. By Material

        16.4.3. By Printing

        16.4.4. By End Use

    16.5. Germany

        16.5.1. Market Share Analysis, 2022

        16.5.2. By Material

        16.5.3. By Printing

        16.5.4. By End Use

    16.6. Italy

        16.6.1. Market Share Analysis, 2022

        16.6.2. By Material

        16.6.3. By Printing

        16.6.4. By End Use

    16.7. France

        16.7.1. Market Share Analysis, 2022

        16.7.2. By Material

        16.7.3. By Printing

        16.7.4. By End Use

    16.8. Spain

        16.8.1. Market Share Analysis, 2022

        16.8.2. By Material

        16.8.3. By Printing

        16.8.4. By End Use

    16.9. U.K.

        16.9.1. Market Share Analysis, 2022

        16.9.2. By Material

        16.9.3. By Printing

        16.9.4. By End Use

    16.10. Russia

        16.10.1. Market Share Analysis, 2022

        16.10.2. By Material

        16.10.3. By Printing

        16.10.4. By End Use

    16.11. China

        16.11.1. Market Share Analysis, 2022

        16.11.2. By Material

        16.11.3. By Printing

        16.11.4. By End Use

    16.12. Japan

        16.12.1. Market Share Analysis, 2022

        16.12.2. By Material

        16.12.3. By Printing

        16.12.4. By End Use

    16.13. India

        16.13.1. Market Share Analysis, 2022

        16.13.2. By Material

        16.13.3. By Printing

        16.13.4. By End Use

    16.14. GCC Countries

        16.14.1. Market Share Analysis, 2022

        16.14.2. By Material

        16.14.3. By Printing

        16.14.4. By End Use

    16.15. Australia

        16.15.1. Market Share Analysis, 2022

        16.15.2. By Material

        16.15.3. By Printing

        16.15.4. By End Use

17. Market Structure Analysis

    17.1. Competition Dashboard

    17.2. Competition Benchmarking

    17.3. Market Share Analysis of Top Players

        17.3.1. By Region

        17.3.2. By Product Portfolio

18. Competition Analysis

    18.1. Competition Deep Dive

        18.1.1. Electronic Imaging Materials, Inc.

            18.1.1.1. Overview

            18.1.1.2. Product Portfolio

            18.1.1.3. Profitability by Market Segments (Product/Channel/Region)

            18.1.1.4. Sales Footprint

            18.1.1.5. Strategy Overview

                18.1.1.5.1. Marketing Strategy

                18.1.1.5.2. Product Strategy

                18.1.1.5.3. Channel Strategy

        18.1.2. Camcode

            18.1.2.1. Overview

            18.1.2.2. Product Portfolio

            18.1.2.3. Profitability by Market Segments (Product/Channel/Region)

            18.1.2.4. Sales Footprint

            18.1.2.5. Strategy Overview

                18.1.2.5.1. Marketing Strategy

                18.1.2.5.2. Product Strategy

                18.1.2.5.3. Channel Strategy

        18.1.3. Brady Corporation

            18.1.3.1. Overview

            18.1.3.2. Product Portfolio

            18.1.3.3. Profitability by Market Segments (Product/Channel/Region)

            18.1.3.4. Sales Footprint

            18.1.3.5. Strategy Overview

                18.1.3.5.1. Marketing Strategy

                18.1.3.5.2. Product Strategy

                18.1.3.5.3. Channel Strategy

        18.1.4. ASG Services LLC

            18.1.4.1. Overview

            18.1.4.2. Product Portfolio

            18.1.4.3. Profitability by Market Segments (Product/Channel/Region)

            18.1.4.4. Sales Footprint

            18.1.4.5. Strategy Overview

                18.1.4.5.1. Marketing Strategy

                18.1.4.5.2. Product Strategy

                18.1.4.5.3. Channel Strategy

        18.1.5. RMS Omega Technologies

            18.1.5.1. Overview

            18.1.5.2. Product Portfolio

            18.1.5.3. Profitability by Market Segments (Product/Channel/Region)

            18.1.5.4. Sales Footprint

            18.1.5.5. Strategy Overview

                18.1.5.5.1. Marketing Strategy

                18.1.5.5.2. Product Strategy

                18.1.5.5.3. Channel Strategy

        18.1.6. ProLux Systemtechnik GmbH & Co. KG

            18.1.6.1. Overview

            18.1.6.2. Product Portfolio

            18.1.6.3. Profitability by Market Segments (Product/Channel/Region)

            18.1.6.4. Sales Footprint

            18.1.6.5. Strategy Overview

                18.1.6.5.1. Marketing Strategy

                18.1.6.5.2. Product Strategy

                18.1.6.5.3. Channel Strategy

        18.1.7. Shelf Tag Supply

            18.1.7.1. Overview

            18.1.7.2. Product Portfolio

            18.1.7.3. Profitability by Market Segments (Product/Channel/Region)

            18.1.7.4. Sales Footprint

            18.1.7.5. Strategy Overview

                18.1.7.5.1. Marketing Strategy

                18.1.7.5.2. Product Strategy

                18.1.7.5.3. Channel Strategy

        18.1.8. MINDWARE TECHNOLOGIES

            18.1.8.1. Overview

            18.1.8.2. Product Portfolio

            18.1.8.3. Profitability by Market Segments (Product/Channel/Region)

            18.1.8.4. Sales Footprint

            18.1.8.5. Strategy Overview

                18.1.8.5.1. Marketing Strategy

                18.1.8.5.2. Product Strategy

                18.1.8.5.3. Channel Strategy

        18.1.9. SKK S.A.

            18.1.9.1. Overview

            18.1.9.2. Product Portfolio

            18.1.9.3. Profitability by Market Segments (Product/Channel/Region)

            18.1.9.4. Sales Footprint

            18.1.9.5. Strategy Overview

                18.1.9.5.1. Marketing Strategy

                18.1.9.5.2. Product Strategy

                18.1.9.5.3. Channel Strategy

        18.1.10. Novex Systems LLC

            18.1.10.1. Overview

            18.1.10.2. Product Portfolio

            18.1.10.3. Profitability by Market Segments (Product/Channel/Region)

            18.1.10.4. Sales Footprint

            18.1.10.5. Strategy Overview

                18.1.10.5.1. Marketing Strategy

                18.1.10.5.2. Product Strategy

                18.1.10.5.3. Channel Strategy

        18.1.11. NovaVision Inc.

            18.1.11.1. Overview

            18.1.11.2. Product Portfolio

            18.1.11.3. Profitability by Market Segments (Product/Channel/Region)

            18.1.11.4. Sales Footprint

            18.1.11.5. Strategy Overview

                18.1.11.5.1. Marketing Strategy

                18.1.11.5.2. Product Strategy

                18.1.11.5.3. Channel Strategy

        18.1.12. Marsh Label Technologies

            18.1.12.1. Overview

            18.1.12.2. Product Portfolio

            18.1.12.3. Profitability by Market Segments (Product/Channel/Region)

            18.1.12.4. Sales Footprint

            18.1.12.5. Strategy Overview

                18.1.12.5.1. Marketing Strategy

                18.1.12.5.2. Product Strategy

                18.1.12.5.3. Channel Strategy

19. Assumptions and Acronyms Used

20. Research Methodology

List of Tables

Table 01: Global Market Value (US$ Mn) Forecast by Region, 2015-2032

Table 02: Global Market Volume (Sq. Mt.) Forecast by Region, 2015-2032

Table 03: Global Market Value (US$ Mn) Forecast by Material, 2015-2032

Table 04: Global Market Volume (Sq. Mt.) Forecast by Material, 2015-2032

Table 05: Global Market Value (US$ Mn) Forecast by Printing, 2015-2032

Table 06: Global Market Volume (Sq. Mt.) Forecast by Printing, 2015-2032

Table 07: Global Market Value (US$ Mn) Forecast by End Use, 2015-2032

Table 08: Global Market Volume (Sq. Mt.) Forecast by End Use, 2015-2032

Table 09: North America Market Value (US$ Mn) Forecast by Country, 2015-2032

Table 10: North America Market Volume (Sq. Mt.) Forecast by Country, 2015-2032

Table 11: North America Market Value (US$ Mn) Forecast by Material, 2015-2032

Table 12: North America Market Volume (Sq. Mt.) Forecast by Material, 2015-2032

Table 13: North America Market Value (US$ Mn) Forecast by Printing, 2015-2032

Table 14: North America Market Volume (Sq. Mt.) Forecast by Printing, 2015-2032

Table 15: North America Market Value (US$ Mn) Forecast by End Use, 2015-2032

Table 16: North America Market Volume (Sq. Mt.) Forecast by End Use, 2015-2032

Table 17: Latin America Market Value (US$ Mn) Forecast by Country, 2015-2032

Table 18: Latin America Market Volume (Sq. Mt.) Forecast by Country, 2015-2032

Table 19: Latin America Market Value (US$ Mn) Forecast by Material, 2015-2032

Table 20: Latin America Market Volume (Sq. Mt.) Forecast by Material, 2015-2032

Table 21: Latin America Market Value (US$ Mn) Forecast by Printing, 2015-2032

Table 22: Latin America Market Volume (Sq. Mt.) Forecast by Printing, 2015-2032

Table 23: Latin America Market Value (US$ Mn) Forecast by End Use, 2015-2032

Table 24: Latin America Market Volume (Sq. Mt.) Forecast by End Use, 2015-2032

Table 25: Europe Market Value (US$ Mn) Forecast by Country, 2015-2032

Table 26: Europe Market Volume (Sq. Mt.) Forecast by Country, 2015-2032

Table 27: Europe Market Value (US$ Mn) Forecast by Material, 2015-2032

Table 28: Europe Market Volume (Sq. Mt.) Forecast by Material, 2015-2032

Table 29: Europe Market Value (US$ Mn) Forecast by Printing, 2015-2032

Table 30: Europe Market Volume (Sq. Mt.) Forecast by Printing, 2015-2032

Table 31: Europe Market Value (US$ Mn) Forecast by End Use, 2015-2032

Table 32: Europe Market Volume (Sq. Mt.) Forecast by End Use, 2015-2032

Table 33: East Asia Market Value (US$ Mn) Forecast by Country, 2015-2032

Table 34: East Asia Market Volume (Sq. Mt.) Forecast by Country, 2015-2032

Table 35: East Asia Market Value (US$ Mn) Forecast by Material, 2015-2032

Table 36: East Asia Market Volume (Sq. Mt.) Forecast by Material, 2015-2032

Table 37: East Asia Market Value (US$ Mn) Forecast by Printing, 2015-2032

Table 38: East Asia Market Volume (Sq. Mt.) Forecast by Printing, 2015-2032

Table 39: East Asia Market Value (US$ Mn) Forecast by End Use, 2015-2032

Table 40: East Asia Market Volume (Sq. Mt.) Forecast by End Use, 2015-2032

Table 41: South Asia Market Value (US$ Mn) Forecast by Country, 2015-2032

Table 42: South Asia Market Volume (Sq. Mt.) Forecast by Country, 2015-2032

Table 43: South Asia Market Value (US$ Mn) Forecast by Material, 2015-2032

Table 44: South Asia Market Volume (Sq. Mt.) Forecast by Material, 2015-2032

Table 45: South Asia Market Value (US$ Mn) Forecast by Printing, 2015-2032

Table 46: South Asia Market Volume (Sq. Mt.) Forecast by Printing, 2015-2032

Table 47: South Asia Market Value (US$ Mn) Forecast by End Use, 2015-2032

Table 48: South Asia Market Volume (Sq. Mt.) Forecast by End Use, 2015-2032

Table 49: Oceania Market Value (US$ Mn) Forecast by Country, 2015-2032

Table 50: Oceania Market Volume (Sq. Mt.) Forecast by Country, 2015-2032

Table 51: Oceania Market Value (US$ Mn) Forecast by Material, 2015-2032

Table 52: Oceania Market Volume (Sq. Mt.) Forecast by Material, 2015-2032

Table 53: Oceania Market Value (US$ Mn) Forecast by Printing, 2015-2032

Table 54: Oceania Market Volume (Sq. Mt.) Forecast by Printing, 2015-2032

Table 55: Oceania Market Value (US$ Mn) Forecast by End Use, 2015-2032

Table 56: Oceania Market Volume (Sq. Mt.) Forecast by End Use, 2015-2032

Table 57: MEA Market Value (US$ Mn) Forecast by Country, 2015-2032

Table 58: MEA Market Volume (Sq. Mt.) Forecast by Country, 2015-2032

Table 59: MEA Market Value (US$ Mn) Forecast by Material, 2015-2032

Table 60: MEA Market Volume (Sq. Mt.) Forecast by Material, 2015-2032

Table 61: MEA Market Value (US$ Mn) Forecast by Printing, 2015-2032

Table 62: MEA Market Volume (Sq. Mt.) Forecast by Printing, 2015-2032

Table 63: MEA Market Value (US$ Mn) Forecast by End Use, 2015-2032

Table 64: MEA Market Volume (Sq. Mt.) Forecast by End Use, 2015-2032

Table 65: U.S. Market Value (US$ Mn) Forecast by Material, Printing, and End Use (2022(E) & 2032(F))

Table 66: Canada Market Value (US$ Mn) Forecast by Material, Printing, and End Use (2022(E) & 2032(F))

Table 67: Brazil Market Value (US$ Mn) Forecast by Material, Printing, and End Use (2022(E) & 2032(F))

Table 68: Mexico Market Value (US$ Mn) Forecast by Material, Printing, and End Use (2022(E) & 2032(F))

Table 69: Germany Market Value (US$ Mn) Forecast by Material, Printing, and End Use (2022(E) & 2032(F))

Table 70: Italy Market Value (US$ Mn) Forecast by Material, Printing, and End Use (2022(E) & 2032(F))

Table 71: France Market Value (US$ Mn) Forecast by Material, Printing, and End Use (2022(E) & 2032(F))

Table 72: Spain Market Value (US$ Mn) Forecast by Material, Printing, and End Use (2022(E) & 2032(F))

Table 73: U.K. Market Value (US$ Mn) Forecast by Material, Printing, and End Use (2022(E) & 2032(F))

Table 74: Russia Market Value (US$ Mn) Forecast by Material, Printing, and End Use (2022(E) & 2032(F))

Table 75: China Market Value (US$ Mn) Forecast by Material, Printing, and End Use (2022(E) & 2032(F))

Table 76: Japan Market Value (US$ Mn) Forecast by Material, Printing, and End Use (2022(E) & 2032(F))

Table 77: India Market Value (US$ Mn) Forecast by Material, Printing, and End Use (2022(E) & 2032(F))

Table 78: GCC Countries Market Value (US$ Mn) Forecast by Material, Printing, and End Use (2022(E) & 2032(F))

Table 79: Australia Market Value (US$ Mn) Forecast by Material, Printing, and End Use (2022(E) & 2032(F))

List of Charts

Figure 01: Global Market Value (US$ Mn) by Material, 2022-2032

Figure 02: Global Market Value (US$ Mn) by Printing, 2022-2032

Figure 03: Global Market Value (US$ Mn) by End Use, 2022-2032

Figure 04: Global Market Value (US$ Mn) by Region, 2022-2032

Figure 05: Global Market Value (US$ Mn) Analysis by Region, 2015-2021

Figure 06: Global Market Volume (Sq. Mt.) Analysis by Region, 2015-2032

Figure 07: Global Market Value Share (%) and BPS Analysis by Region, 2022 & 2032

Figure 08: Global Market Y-o-Y Growth (%) Projections by Region, 2022-2032

Figure 09: Global Market Value (US$ Mn) Analysis by Material, 2015-2021

Figure 10: Global Market Volume (Sq. Mt.) Analysis by Material, 2015-2032

Figure 11: Global Market Value Share (%) and BPS Analysis by Material, 2022 & 2032

Figure 12: Global Market Y-o-Y Growth (%) Projections by Material, 2022-2032

Figure 13: Global Market Value (US$ Mn) Analysis by Printing, 2015-2021

Figure 14: Global Market Volume (Sq. Mt.) Analysis by Printing, 2015-2032

Figure 15: Global Market Value Share (%) and BPS Analysis by Printing, 2022 & 2032

Figure 16: Global Market Y-o-Y Growth (%) Projections by Printing, 2022-2032

Figure 17: Global Market Value (US$ Mn) Analysis by End Use, 2015-2021

Figure 18: Global Market Volume (Sq. Mt.) Analysis by End Use, 2015-2032

Figure 19: Global Market Value Share (%) and BPS Analysis by End Use, 2022 & 2032

Figure 20: Global Market Y-o-Y Growth (%) Projections by End Use, 2022-2032

Figure 21: Global Market Attractiveness by Material, 2022-2032

Figure 22: Global Market Attractiveness by Printing, 2022-2032

Figure 23: Global Market Attractiveness by End Use, 2022-2032

Figure 24: Global Market Attractiveness by End Use, 2022-2032

Figure 25: Global Market Attractiveness by Region, 2022-2032

Figure 26: North America Market Value (US$ Mn) by Material, 2022-2032

Figure 27: North America Market Value (US$ Mn) by Printing, 2022-2032

Figure 28: North America Market Value (US$ Mn) by End Use, 2022-2032

Figure 29: North America Market Value (US$ Mn) by Country, 2022-2032

Figure 30: North America Market Value (US$ Mn) Analysis by Country, 2015-2021

Figure 31: North America Market Volume (Sq. Mt.) Analysis by Country, 2015-2032

Figure 32: North America Market Value Share (%) and BPS Analysis by Country, 2022 & 2032

Figure 33: North America Market Y-o-Y Growth (%) Projections by Country, 2022-2032

Figure 34: North America Market Value (US$ Mn) Analysis by Material, 2015-2021

Figure 35: North America Market Volume (Sq. Mt.) Analysis by Material, 2015-2032

Figure 36: North America Market Value Share (%) and BPS Analysis by Material, 2022 & 2032

Figure 37: North America Market Y-o-Y Growth (%) Projections by Material, 2022-2032

Figure 38: North America Market Value (US$ Mn) Analysis by Printing, 2015-2021

Figure 39: North America Market Volume (Sq. Mt.) Analysis by Printing, 2015-2032

Figure 40: North America Market Value Share (%) and BPS Analysis by Printing, 2022 & 2032

Figure 41: North America Market Y-o-Y Growth (%) Projections by Printing, 2022-2032

Figure 42: North America Market Value (US$ Mn) Analysis by End Use, 2015-2021

Figure 43: North America Market Volume (Sq. Mt.) Analysis by End Use, 2015-2032

Figure 44: North America Market Value Share (%) and BPS Analysis by End Use, 2022 & 2032

Figure 45: North America Market Y-o-Y Growth (%) Projections by End Use, 2022-2032

Figure 46: North America Market Attractiveness by Material, 2022-2032

Figure 47: North America Market Attractiveness by Printing, 2022-2032

Figure 48: North America Market Attractiveness by End Use, 2022-2032

Figure 49: North America Market Attractiveness by Country, 2022-2032

Figure 50: Latin America Market Value (US$ Mn) by Material, 2022 & 2032

Figure 51: Latin America Market Value (US$ Mn) by Printing, 2022-2032

Figure 52: Latin America Market Value (US$ Mn) by End Use, 2022-2032

Figure 53: Latin America Market Value (US$ Mn) by Country, 2022-2032

Figure 54: Latin America Market Value (US$ Mn) Analysis by Country, 2015-2021

Figure 55: Latin America Market Volume (Sq. Mt.) Analysis by Country, 2015-2032

Figure 56: Latin America Market Value Share (%) and BPS Analysis by Country, 2022 & 2032

Figure 57: Latin America Market Y-o-Y Growth (%) Projections by Country, 2022-2032

Figure 58: Latin America Market Value (US$ Mn) Analysis by Material, 2015-2021

Figure 59: Latin America Market Volume (Sq. Mt.) Analysis by Material, 2015-2032

Figure 60: Latin America Market Value Share (%) and BPS Analysis by Material, 2022 & 2032

Figure 61: Latin America Market Y-o-Y Growth (%) Projections by Material, 2022-2032

Figure 62: Latin America Market Value (US$ Mn) Analysis by Printing, 2015-2021

Figure 63: Latin America Market Volume (Sq. Mt.) Analysis by Printing, 2015-2032

Figure 64: Latin America Market Value Share (%) and BPS Analysis by Printing, 2022 & 2032

Figure 65: Latin America Market Y-o-Y Growth (%) Projections by Printing, 2022-2032

Figure 66: Latin America Market Value (US$ Mn) Analysis by End Use, 2015-2021

Figure 67: Latin America Market Volume (Sq. Mt.) Analysis by End Use, 2015-2032

Figure 68: Latin America Market Value Share (%) and BPS Analysis by End Use, 2022 & 2032

Figure 69: Latin America Market Y-o-Y Growth (%) Projections by End Use, 2022-2032

Figure 70: Latin America Market Attractiveness by Material, 2022-2032

Figure 71: Latin America Market Attractiveness by Printing, 2022-2032

Figure 72: Latin America Market Attractiveness by End Use, 2022-2032

Figure 73: Latin America Market Attractiveness by Country, 2022-2032

Figure 74: Europe Market Value (US$ Mn) by Material, 2022-2032

Figure 75: Europe Market Value (US$ Mn) by Printing, 2022-2032

Figure 76: Europe Market Value (US$ Mn) by End Use, 2022-2032

Figure 77: Europe Market Value (US$ Mn) by Country, 2022-2032

Figure 78: Europe Market Value (US$ Mn) Analysis by Country, 2015-2021

Figure 79: Europe Market Volume (Sq. Mt.) Analysis by Country, 2015-2032

Figure 80: Europe Market Value Share (%) and BPS Analysis by Country, 2022 & 2032

Figure 81: Europe Market Y-o-Y Growth (%) Projections by Country, 2022-2032

Figure 82: Europe Market Value (US$ Mn) Analysis by Material, 2015-2021

Figure 83: Europe Market Volume (Sq. Mt.) Analysis by Material, 2015-2032

Figure 84: Europe Market Value Share (%) and BPS Analysis by Material, 2022 & 2032

Figure 85: Europe Market Y-o-Y Growth (%) Projections by Material, 2022-2032

Figure 86: Europe Market Value (US$ Mn) Analysis by Printing, 2015-2021

Figure 87: Europe Market Volume (Sq. Mt.) Analysis by Printing, 2015-2032

Figure 88: Europe Market Value Share (%) and BPS Analysis by Printing, 2022 & 2032

Figure 89: Europe Market Y-o-Y Growth (%) Projections by Printing, 2022-2032

Figure 90: Europe Market Value (US$ Mn) Analysis by End Use, 2015-2021

Figure 91: Europe Market Volume (Sq. Mt.) Analysis by End Use, 2015-2032

Figure 92: Europe Market Value Share (%) and BPS Analysis by End Use, 2022 & 2032

Figure 93: Europe Market Y-o-Y Growth (%) Projections by End Use, 2022-2032

Figure 94: Europe Market Attractiveness by Material, 2022-2032

Figure 95: Europe Market Attractiveness by Printing, 2022-2032

Figure 96: Europe Market Attractiveness by End Use, 2022-2032

Figure 97: Europe Market Attractiveness by Country, 2022-2032

Figure 98: East Asia Market Value (US$ Mn) by Material, 2022-2032

Figure 99: East Asia Market Value (US$ Mn) by Printing, 2022-2032

Figure 100: East Asia Market Value (US$ Mn) by End Use, 2022-2032

Figure 101: East Asia Market Value (US$ Mn) by Country, 2022-2032

Figure 102: East Asia Market Value (US$ Mn) Analysis by Country, 2015-2021

Figure 103: East Asia Market Volume (Sq. Mt.) Analysis by Country, 2015-2032

Figure 104: East Asia Market Value Share (%) and BPS Analysis by Country, 2022 & 2032

Figure 105: East Asia Market Y-o-Y Growth (%) Projections by Country, 2022-2032

Figure 106: East Asia Market Value (US$ Mn) Analysis by Material, 2015-2021

Figure 107: East Asia Market Volume (Sq. Mt.) Analysis by Material, 2015-2032

Figure 108: East Asia Market Value Share (%) and BPS Analysis by Material, 2022 & 2032

Figure 109: East Asia Market Y-o-Y Growth (%) Projections by Material, 2022-2032

Figure 110: East Asia Market Value (US$ Mn) Analysis by Printing, 2015-2021

Figure 111: East Asia Market Volume (Sq. Mt.) Analysis by Printing, 2015-2032

Figure 112: East Asia Market Value Share (%) and BPS Analysis by Printing, 2022 & 2032

Figure 113: East Asia Market Y-o-Y Growth (%) Projections by Printing, 2022-2032

Figure 114: East Asia Market Value (US$ Mn) Analysis by End Use, 2015-2021

Figure 115: East Asia Market Volume (Sq. Mt.) Analysis by End Use, 2015-2032

Figure 116: East Asia Market Value Share (%) and BPS Analysis by End Use, 2022 & 2032

Figure 117: East Asia Market Y-o-Y Growth (%) Projections by End Use, 2022-2032

Figure 118: East Asia Market Attractiveness by Material, 2022-2032

Figure 119: East Asia Market Attractiveness by Printing, 2022-2032

Figure 120: East Asia Market Attractiveness by End Use, 2022-2032

Figure 121: East Asia Market Attractiveness by Country, 2022-2032

Figure 122: South Asia Market Value (US$ Mn) by Material, 2022-2032

Figure 123: South Asia Market Value (US$ Mn) by Printing, 2022-2032

Figure 124: South Asia Market Value (US$ Mn) by End Use, 2022-2032

Figure 125: South Asia Market Value (US$ Mn) by Country, 2022-2032

Figure 126: South Asia Market Value (US$ Mn) Analysis by Country, 2015-2021

Figure 127: South Asia Market Volume (Sq. Mt.) Analysis by Country, 2015-2032

Figure 128: South Asia Market Value Share (%) and BPS Analysis by Country, 2022 & 2032

Figure 129: South Asia Market Y-o-Y Growth (%) Projections by Country, 2022-2032

Figure 130: South Asia Market Value (US$ Mn) Analysis by Material, 2015-2021

Figure 131: South Asia Market Volume (Sq. Mt.) Analysis by Material, 2015-2032

Figure 132: South Asia Market Value Share (%) and BPS Analysis by Material, 2022 & 2032

Figure 133: South Asia Market Y-o-Y Growth (%) Projections by Material, 2022-2032

Figure 134: South Asia Market Value (US$ Mn) Analysis by Printing, 2015-2021

Figure 135: South Asia Market Volume (Sq. Mt.) Analysis by Printing, 2015-2032

Figure 136: South Asia Market Value Share (%) and BPS Analysis by Printing, 2022 & 2032

Figure 137: South Asia Market Y-o-Y Growth (%) Projections by Printing, 2022-2032

Figure 138: South Asia Market Value (US$ Mn) Analysis by End Use, 2015-2021

Figure 139: South Asia Market Volume (Sq. Mt.) Analysis by End Use, 2015-2032

Figure 140: South Asia Market Value Share (%) and BPS Analysis by End Use, 2022 & 2032

Figure 141: South Asia Market Y-o-Y Growth (%) Projections by End Use, 2022-2032

Figure 142: South Asia Market Attractiveness by Material, 2022-2032

Figure 143: South Asia Market Attractiveness by Printing, 2022-2032

Figure 144: South Asia Market Attractiveness by End Use, 2022-2032

Figure 145: South Asia Market Attractiveness by Country, 2022-2032

Figure 146: Oceania Market Value (US$ Mn) by Material, 2022-2032

Figure 147: Oceania Market Value (US$ Mn) by Printing, 2022-2032

Figure 148: Oceania Market Value (US$ Mn) by End Use, 2022-2032

Figure 149: Oceania Market Value (US$ Mn) by Country, 2022-2032

Figure 150: Oceania Market Value (US$ Mn) Analysis by Country, 2015-2021

Figure 151: Oceania Market Volume (Sq. Mt.) Analysis by Country, 2015-2032

Figure 152: Oceania Market Value Share (%) and BPS Analysis by Country, 2022 & 2032

Figure 153: Oceania Market Y-o-Y Growth (%) Projections by Country, 2022-2032

Figure 154: Oceania Market Value (US$ Mn) Analysis by Material, 2015-2021

Figure 155: Oceania Market Volume (Sq. Mt.) Analysis by Material, 2015-2032

Figure 156: Oceania Market Value Share (%) and BPS Analysis by Material, 2022 & 2032

Figure 157: Oceania Market Y-o-Y Growth (%) Projections by Material, 2022-2032

Figure 158: Oceania Market Value (US$ Mn) Analysis by Printing, 2015-2021

Figure 159: Oceania Market Volume (Sq. Mt.) Analysis by Printing, 2015-2032

Figure 160: Oceania Market Value Share (%) and BPS Analysis by Printing, 2022 & 2032

Figure 161: Oceania Market Y-o-Y Growth (%) Projections by Printing, 2022-2032

Figure 162: Oceania Market Value (US$ Mn) Analysis by End Use, 2015-2021

Figure 163: Oceania Market Volume (Sq. Mt.) Analysis by End Use, 2015-2032

Figure 164: Oceania Market Value Share (%) and BPS Analysis by End Use, 2022 & 2032

Figure 165: Oceania Market Y-o-Y Growth (%) Projections by End Use, 2022-2032

Figure 166: Oceania Market Attractiveness by Material, 2022-2032

Figure 167: Oceania Market Attractiveness by Printing, 2022-2032

Figure 168: Oceania Market Attractiveness by End Use, 2022-2032

Figure 169 Oceania Market Attractiveness by Country, 2022-2032

Figure 170: MEA Market Value (US$ Mn) by Material, 2022-2032

Figure 171: MEA Market Value (US$ Mn) by Printing, 2022-2032

Figure 172: MEA Market Value (US$ Mn) by End Use, 2022-2032

Figure 173: MEA Market Value (US$ Mn) by Country, 2022-2032

Figure 174: MEA Market Value (US$ Mn) Analysis by Country, 2015-2021

Figure 175: MEA Market Volume (Sq. Mt.) Analysis by Country, 2015-2032

Figure 176: MEA Market Value Share (%) and BPS Analysis by Country, 2022 & 2032

Figure 177: MEA Market Y-o-Y Growth (%) Projections by Country, 2022-2032

Figure 178: MEA Market Value (US$ Mn) Analysis by Material, 2015-2021

Figure 179: MEA Market Volume (Sq. Mt.) Analysis by Material, 2015-2032

Figure 180: MEA Market Value Share (%) and BPS Analysis by Material, 2022 & 2032

Figure 181: MEA Market Y-o-Y Growth (%) Projections by Material, 2022-2032

Figure 182: MEA Market Value (US$ Mn) Analysis by Printing, 2015-2021

Figure 183: MEA Market Volume (Sq. Mt.) Analysis by Printing, 2015-2032

Figure 184: MEA Market Value Share (%) and BPS Analysis by Printing, 2022 & 2032

Figure 185: MEA Market Y-o-Y Growth (%) Projections by Printing, 2022-2032

Figure 186: MEA Market Value (US$ Mn) Analysis by End Use, 2015-2021

Figure 187: MEA Market Volume (Sq. Mt.) Analysis by End Use, 2015-2032

Figure 188: MEA Market Value Share (%) and BPS Analysis by End Use, 2022 & 2032

Figure 189: MEA Market Y-o-Y Growth (%) Projections by End Use, 2022-2032

Figure 190: MEA Market Attractiveness by Material, 2022-2032

Figure 191: MEA Market Attractiveness by Printing, 2022-2032

Figure 192: MEA Market Attractiveness by End Use, 2022-2032

Figure 193 MEA Market Attractiveness by Country, 2022-2032

Recommendations

Packaging

Linerless Label Market

Published : October 2023

Technology

Security Labels Market

Published : February 2023

Packaging

Time Temperature Indicator Labels Market

Published : January 2023

Packaging

Shrink Sleeve Labels Market

Published : September 2022

Explore Packaging Insights

View Reports

Retro-Reflective Labels Market