
- Market Size (2026)
- USD 2600.0 Mn
- Forecast (2036)
- USD 28379.9 Mn
- CAGR (2026 to 2036)
- 27.0%
How big is the Retrieval-Augmented Generation (RAG) Market in 2026?
Revenue in the global retrieval-augmented generation market is forecast to climb to USD 28,379.9 million in 2036 at a CAGR of 27.0% between 2026 and 2036. The market was valued at USD 2,000.0 million in 2025, with USD 2,600.0 million estimated for 2026.
Retrieval-Augmented Generation (RAG) Market Size and Forecast
Table 1: Retrieval-Augmented Generation (RAG) Market Size and Forecast
| Market size and forecast | Value |
|---|---|
| Market size in 2025 | USD 2,000.0 million |
| Estimated market size in 2026 | USD 2,600.0 million |
| Projected market size by 2036 | USD 28,379.9 million |
| CAGR from 2026 to 2036 | 27.0% |
Source: Future Market Insights analysis of the Retrieval-Augmented generation (RAG) market, 2026.
Enterprise retrieval is becoming a separately managed software purchase as cloud vendors incorporate more of the implementation chain into their services. Google made Vertex AI RAG Engine generally available on 9 January 2025. AWS did the same for GraphRAG in Amazon Bedrock Knowledge Bases on 7 March 2025. Microsoft introduced agentic retrieval in Azure AI Search as a public preview on 19 May 2025.
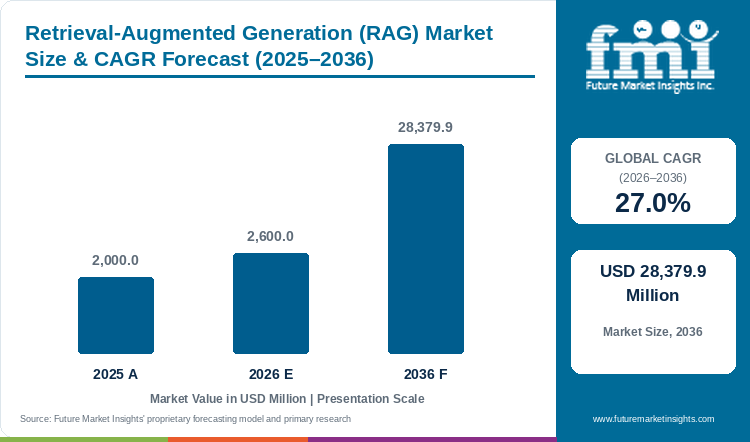
This consolidation supports platform sales while leaving work with the buyer. A managed retrieval engine still needs access controls, document updates and tests reflecting the questions employees ask. A system that finds related passages but produces unsupported conclusions creates continuing review costs. RAG demand therefore extends beyond the broader generative AI market into the work of connecting generation to business evidence. FMI projects revenue to rise 10.9 times between the 2026 estimate and 2036.
Key Market Trends & Insights
- Services gain share from 25.0% in 2026 to 30.9% by 2036 in FMI's outlook. The commercial opening is sustained integration and retrieval evaluation as implementations multiply across departments.
- Embedding suppliers are separating indexing from query workloads. Cohere introduced Embed 5 on 30 September 2026 with Pro and Fast variants sharing an embedding space, and its release notes distinguish offline indexing requirements from interactive query requirements.
- Search suppliers compete through existing information infrastructure. Databricks AI Search supports indexes synchronized with Delta tables, while MongoDB documents retrieval directly from collections containing embeddings. These approaches address different installed systems and reduce the attraction of selecting a new database solely for an initial demonstration.
Regional Highlights
- China and India widen their share of global revenue. FMI's 2036 shares are China 11.6% (from 9.0%) and India 6.5% (from 5.0%).
- Share slips for the United States, Germany and France as revenue grows. FMI projects the United States slipping from 42.0% to 39.7%, Germany slipping from 6.0% to 5.2% and France slipping from 4.0% to 3.5% over 2026 to 2036.
Analyst Perspective
“FMI expects the strongest RAG suppliers to compete on the evidence returned for a business question and the expense of keeping that evidence current. A successful pilot establishes technical possibility. Recurring revenue depends on permission-aware retrieval, controlled changes and a review process that identifies when the material available cannot support an answer. Service providers have a continuing role because those requirements change with the customer's content and operating practices.”
- Sudip saha, Principal Consultant, FMI
How is the Retrieval-Augmented Generation (RAG) Market segmented?
- By component: Platforms and Tools. Vector Databases and Search. Services.
- By deployment: Public Cloud. Private Cloud. On-Premises and Hybrid.
- By end use: IT and Telecom. Banking and Financial Services. Healthcare and Life Sciences. Retail and E-commerce. Legal and Professional Services. Other.
- By region: North America. Western Europe. East Asia. South Asia and Pacific. Rest of world aggregate.
Why does the Platforms and Tools segment lead by Component in the Retrieval-Augmented Generation (RAG) Market in 2026?
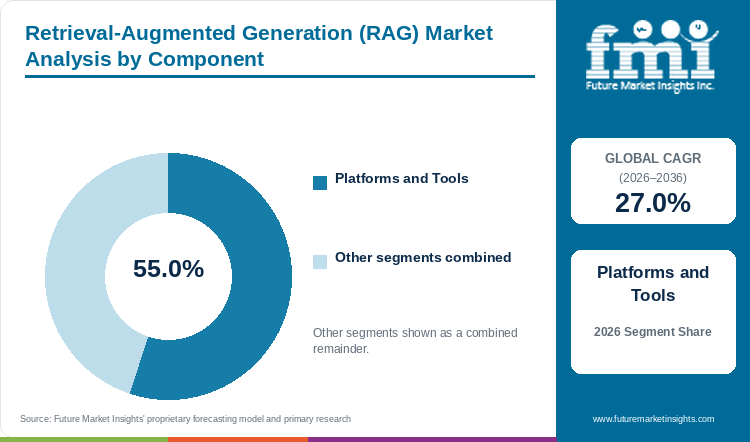
The Platforms and Tools segment holds 55.0% of the Retrieval-Augmented Generation (RAG) Market by component in 2026.
Platform revenue leads because enterprise implementations require a working chain around retrieval. The purchase includes the systems that ingest information, organize searchable content and connect retrieved passages to a response. IBM's reference architecture separates preparation from runtime retrieval and generation. This makes the integration boundary visible to customers deciding which functions to operate themselves.
Oracle places vector search alongside business information in its database architecture, while managed cloud engines offer an alternative operating arrangement. Existing database relationships therefore influence the platform shortlist. A new RAG contract may expand a supplier's established account or introduce a specialist where the existing search service fails a particular requirement.
FMI projects Platforms and Tools to reach USD 14,072.9 million by 2036. Its share falls to 49.6% even as revenue grows at 25.7% annually. Services grow faster, reflecting the commercial importance of implementation and continuing adjustment. The related enterprise LLM market addresses model deployment more broadly. RAG platform differentiation depends on the additional retrieval work customers are willing to buy separately.
Vector Databases and Search and Services together account for the remaining 45.0% by component.
Table 2: Component, 2026 Share
| Leading Share | 2026 market share |
|---|---|
| Platforms and Tools | 55.0% |
| All Other Segments Combined Share | 45.0% |
Source: Future Market Insights analysis of the Retrieval-Augmented generation (RAG) market, 2026.
Why does the Public Cloud segment lead by Deployment in the Retrieval-Augmented Generation (RAG) Market in 2026?
The Public Cloud segment holds 62.0% of the Retrieval-Augmented Generation (RAG) Market by deployment in 2026.
Public Cloud leads the commercial mix because managed retrieval sits beside the model and infrastructure services enterprises already purchase. The commercial attraction is fewer separately operated components. Actual suitability still depends on the location and handling of customer information.
The alternatives remain significant. Private Cloud contributes 16.0% of revenue in 2026, while On-Premises and Hybrid contributes 22.0%. France's privacy regulator documented a France Travail application using an on-premises Mixtral model with RAG. Its discussion tied infrastructure choice to confidentiality concerns in that specific project.
FMI projects Public Cloud revenue of USD 18,966.9 million by 2036, or 66.8% of the market. On-Premises and Hybrid also grows in absolute terms, reaching USD 4,518.3 million. Suppliers serving controlled environments therefore retain a substantial opportunity even as the cloud share increases. Hosting flexibility and integration into the customer's existing access system remain separate commercial capabilities.
Private Cloud and On-Premises and Hybrid together hold the remaining 38.0% by deployment.
Table 3: Deployment, 2026 Share
| Leading Share | 2026 market share |
|---|---|
| Public Cloud | 62.0% |
| All Other Segments Combined Share | 38.0% |
Source: Future Market Insights analysis of the Retrieval-Augmented generation (RAG) market, 2026.
Why does the IT and Telecom segment lead by End Use in the Retrieval-Augmented Generation (RAG) Market in 2026?
The IT and Telecom segment holds 22.0% of the Retrieval-Augmented Generation (RAG) Market by end use in 2026.
IT and Telecom has a narrow lead over Banking and Financial Services at 20.0%. Technical support, engineering documentation and operating procedures offer identifiable bodies of content against which a retrieval application can be assessed. IBM's watsonx Code Assistant documentation specifically describes grounding answers in code and documentation.
The economic question is whether the system resolves work with less expert search and review. Outdated procedures, duplicated technical descriptions and changing permissions complicate that outcome. A deployment that retrieves the wrong software version may create additional support work despite producing fluent answers. FMI therefore treats content maintenance and task evaluation as part of the sector's recurring commercial requirement.
IT and Telecom revenue reaches USD 6,104.0 million by 2036 at a 26.7% CAGR. Healthcare and Life Sciences grows faster at 29.7%, taking its share from 14.0% to 17.3%.
Banking and Financial Services, Healthcare and Life Sciences, Retail and E-commerce, Legal and Professional Services and Other together hold the remaining 78.0% by end use.
Table 4: End Use, 2026 Share
| Leading Share | 2026 market share |
|---|---|
| IT and Telecom | 22.0% |
| All Other Segments Combined Share | 78.0% |
Source: Future Market Insights analysis of the Retrieval-Augmented generation (RAG) market, 2026.
What are the key drivers restraints and opportunities?
The need to use current enterprise information supports RAG spending. Incomplete retrieval and access-control failures limit rollout, while continuing evaluation and content integration create service opportunities.
Driver
Enterprise AI applications require current, attributable business context beyond a model's original training.
Restraint
Retrieval errors, inconsistent source material and inappropriate access can undermine production approval.
Opportunity
Managed retrieval operations and domain-specific evaluation support repeat work after an initial deployment.
How do purchasing rules and qualification affect Retrieval-Augmented generation (RAG) market demand?
The demand mechanism is the frequency with which business information changes. Product policies, engineering releases and service instructions do not remain fixed through a model's life. NIST's RAG glossary explains that a separate retrieval system can change the information available without retraining the generative model. FMI reads this as a recurring commercial task: content must remain searchable and aligned with the current business process.
The strongest account expansion comes from applications with an identifiable information owner and measurable task outcome. A support operation can review whether the retrieved procedure matches an active product. An internal policy assistant can be tested against the policy version and employee access rights. These are more useful spending controls than a demonstration built on a small set of convenient documents. Expansion across departments then creates connector, permission and testing work that benefits service specialists alongside platform suppliers.
What limits reliable Retrieval-Augmented generation (RAG) market supply and quality?
The sufficient-context research examined whether the material presented was enough and how systems respond when it is not. Commercial acceptance therefore needs tests for unanswered questions as well as successful responses. Otherwise, apparent answer coverage can conceal unsupported conclusions.
Access control creates a different failure mode. Elastic documents document- and field-level security alongside retrieval capabilities, while Germany's BSI warns that prompt injection cannot be completely prevented and recommends restricting application rights. The purchasing consequence is more precise than a general preference for secure software. Customers need evidence that denied content does not enter retrieval or the answers generated from it. This connects RAG implementation to enterprise AI governance and compliance work, while leaving the two revenue categories distinct.
Where can suppliers win additional business in the Retrieval-Augmented generation (RAG) market?
Suppliers have room to improve results before replacing the underlying model. Document parsing, table handling, terminology and ranking affect what reaches the generator. Cohere's September 2026 embedding release addresses mixed text-and-image inputs, and its October 2026 reranking release distinguishes quality-focused and latency-focused variants.
FMI expects differentiated services around evaluation, migration and content refresh to grow with production use. Multilingual implementations add further work because a relevant passage may use a different language from the question. The wider natural language processing market provides the supporting language capabilities. The RAG-specific sale remains the integration that retrieves appropriate evidence and keeps the application useful over time.
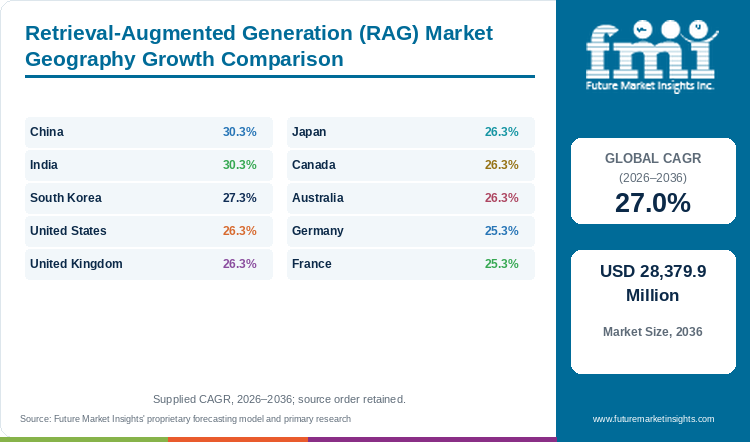
Retrieval-Augmented Generation (RAG) Market by Country (2026 to 2036)
Table 5: Retrieval-Augmented Generation (RAG) Market Country Growth Forecast
| Country | CAGR, 2026 to 2036 |
|---|---|
| China | 30.3% |
| India | 30.3% |
| South Korea | 27.3% |
| United States | 26.3% |
| United Kingdom | 26.3% |
| Japan | 26.3% |
| Canada | 26.3% |
| Australia | 26.3% |
| Germany | 25.3% |
| France | 25.3% |
Source: Future Market Insights analysis of the Retrieval-Augmented generation (RAG) market, 2026.
China
Domestic managed retrieval services provide a practical route into China's RAG market. Alibaba Cloud's August 2026 Knowledge Storage Service documentation describes serverless document import, parsing, chunking, vectorization and hybrid search. It lists availability in Beijing, Shanghai, Hangzhou, Shenzhen and Hong Kong, as well as Singapore. China's RAG revenue is forecast to grow at a 30.3% CAGR from 2026 to 2036, reaching USD 3,303.4 million from USD 234.0 million. China contributes USD 3,069.4 million of new revenue, second of ten. China accounts for 9.0% of global revenue in 2026 and 11.6% in 2036. In the Retrieval-Augmented generation market, China's revenue grows 14.1 times over the decade, against 10.9 times globally.
The product structure matters commercially because retrieval can enter an existing cloud relationship without a separate infrastructure build. Implementation partners still need to reconcile business terminology and document ownership. Those decisions remain part of the customer engagement.
FMI sees the most defensible supplier position in integration close to the customer's actual repositories and language requirements. A Chinese-language knowledge application may contain product names, tables and mixed-language technical references that need different retrieval tests. The sales case improves when the supplier demonstrates relevant results on that content instead of relying on a general model benchmark. China's forecast share rises from 9.0% in 2026 to 11.6% in 2036, reflecting faster revenue growth than the global average within this outlook.
India
Access to shared AI infrastructure broadens the range of organizations able to develop retrieval applications in India. The government's 30 December 2025 IndiaAI backgrounder reported 38,000 GPUs deployed under the mission, against an original target of 10,000. It indicates support for AI development, while successful commercial implementation still requires usable customer content and integration skills.
India shares the highest national growth forecast in this assessment. FMI projects a 30.3% CAGR between 2026 and 2036, taking revenue from USD 130.0 million to USD 1,835.2 million. Its global share rises from 5.0% to 6.5% over that period. The forecast leaves room for both enterprise platform purchases and implementation services attached to domain-specific applications. In the Retrieval-Augmented generation market, India accounts for 5.0% of global revenue in 2026 and 6.5% in 2036. In the Retrieval-Augmented generation market, India contributes USD 1,705.2 million of new revenue, third of ten. In the Retrieval-Augmented generation market, India's 2026 revenue ranks joint fifth of ten.
FMI sees an important distinction between inexpensive access to computing and inexpensive operation of a useful service. Retrieval quality depends on the language, format and current status of the underlying material. Multilingual deployments may need evaluation across different versions of the same policy or product description.
Service providers can therefore compete through domain preparation and measurable retrieval outcomes, alongside software development. The most credible expansion case starts with a bounded information task and demonstrates maintained quality as content changes.
South Korea
South Korea's AI Basic Act took effect on 22 January 2026. The Ministry of Science and ICT announced a grace period of at least one year and a support desk to help businesses prepare. Nor does the legislation classify every RAG application as a high-impact use.
FMI forecasts South Korean RAG revenue of USD 78.0 million in 2026, rising to USD 871.9 million in 2036. A 27.3% CAGR from 2026 to 2036 places the market slightly above the global revenue growth rate. Demand depends on organizations converting language capability into applications connected to their own operating information. From 2026 to 2036, revenue in South Korea rises 11.2 times and global revenue 10.9 times.
For a supplier, the practical opportunity is to connect system behavior with the intended use and audience. A technical knowledge assistant should demonstrate how it handles relevant Korean-language material and mixed-language product references. If the application supports a consequential business process, the buyer also needs to determine the appropriate human review and transparency arrangements. A general statement that retrieval makes an answer trustworthy is insufficient.
FMI expects integration work to remain commercially relevant as customers adjust deployment practices and expand access. The services required include evaluation on the actual content, review of information boundaries and monitoring after changes. Providers that make these tasks visible within the contract can compete on operational responsibility instead of relying entirely on a broad model-quality claim.
United States
The U.S. RAG opportunity begins with a large enterprise software spending base, but adoption statistics require careful interpretation. The Census Bureau's April 2026 study found that 18.0% of firms used AI in a business function during November 2025 to January 2026. The employment-weighted measure was 32.0%, indicating a different concentration when larger employers receive more weight. FMI forecasts U.S. RAG revenue to expand at a 26.3% CAGR between 2026 and 2036, from USD 1,092.0 million to USD 11,278.2 million. The United States compounds at 26.3%, which is 0.7 points below the global 27.0%.
For suppliers, the initial commercial question is which existing information system controls the account. A company already paying for enterprise search faces a different migration decision from one assembling a new retrieval service. Database suppliers and specialist application companies consequently compete for different portions of an implementation. The market does not consist solely of new vector database contracts.
FMI expects U.S. account expansion to depend on repeatable evaluation across several business functions. An assistant used by engineering may need different content and permissions when introduced to sales or customer service. Reusing infrastructure can support expansion, but a new department still needs its own acceptance tests. The forecast therefore leaves room for services even where a cloud vendor supplies the retrieval engine. Revenue quality depends on retained use after these operational differences become visible.
United Kingdom
Public-sector implementation guidance gives the UK a concrete reference point for enterprise RAG purchasing. The Government Digital Service published its AI Playbook on 10 February 2025. The document discusses retrieval-augmented generation within a broader approach to safe and effective AI use. Its significance for suppliers lies in the purchasing conversation: a retrieval application must have an appropriate use case, operating controls and a plan for evaluation.
FMI estimates UK RAG revenue at USD 156.0 million in 2026 and projects USD 1,611.2 million by 2036. The corresponding CAGR is 26.3% from 2026 to 2036. The United Kingdom records a USD 1,455.2 million increase, fourth of the ten. The United Kingdom stands at 6.0% of the global total in 2026 and 5.7% in 2036. In the Retrieval-Augmented generation market, the United Kingdom's revenue grows 10.3 times over the decade, against 10.9 times globally. The United Kingdom's 2026 revenue ranks joint third of ten.
The implementation must identify whose judgement the system assists and which evidence that person needs. A policy-search tool, a service desk assistant and a research application face different tolerances for incomplete answers. FMI expects suppliers to win repeat work where they make these differences explicit during acceptance and ongoing review. This favors a service offer that includes content maintenance and performance monitoring alongside licensing. It also limits the value of selling the same demonstration across unrelated departments without changing the evaluation questions or access conditions.
Japan
Japan's Digital Agency adopted government generative AI procurement and use guidelines on 27 May 2025, with an English translation updated in June 2025. The guidelines connect use promotion with risk management and include procurement-related materials. For RAG providers, this creates a defined reference for discussing how a proposed system will be purchased and operated.
FMI expects Japan's RAG market to rise from USD 130.0 million in 2026 to USD 1,342.6 million by 2036. Revenue grows at a 26.3% CAGR across 2026 to 2036. The commercial task is to connect useful retrieval to existing administrative and enterprise processes without treating a general language capability as proof of application performance.
Document structure is an important part of that task. A technical manual may contain tables, revisions and references that lose meaning if separated incorrectly. An acceptable Japanese-language response also needs to preserve the distinctions present in the relevant document. FMI expects evaluation on the customer's actual material to carry more commercial weight than a broad multilingual benchmark alone.
The opportunity extends to maintaining the application after launch. Changes in document format, ownership or departmental procedures can alter retrieval behavior even if the underlying model remains unchanged. Suppliers offering a clear review process for such changes can secure continuing service revenue. Platform vendors benefit when that work remains attached to a stable managed environment instead of being rebuilt for each departmental project.
Canada
Canada's adoption evidence separates familiarity with generative AI from the purchase of a governed enterprise application. Statistics Canada's July 2026 release examined workers aged 15 to 69 using March 2026 Labour Force Survey supplementary questions. It recorded particularly high generative AI use in senior management and natural and applied sciences occupations.
FMI forecasts Canadian RAG sales of USD 104.0 million in 2026 and USD 1,074.1 million by 2036, a 26.3% CAGR from 2026 to 2036. The commercial opportunity involves connecting familiar AI interfaces to information that institutions can appropriately make available. That requires more than employee enthusiasm for a general-purpose tool. Revenue in Canada multiplies 10.3 times by 2036, compared with 10.9 times worldwide. In the Retrieval-Augmented generation market, Canada contributes 4.0% of world revenue in 2026 and 3.8% in 2036.
The Treasury Board's guide advises federal institutions to assess risks and involve relevant legal, privacy and security expertise before deployment. FMI interprets this as a reason to sell an operating arrangement together with the retrieval application. A customer needs to understand the treatment of sensitive information and the responsibilities for reviewing output. Those questions remain relevant even when a supplier provides a managed platform.
Canadian procurement opportunities therefore differ by information sensitivity and intended audience. An internal technical assistant and a public-facing service cannot share an identical acceptance standard. Suppliers that define this distinction early can reduce avoidable rework and support expansion into additional use cases.
Australia
Australia's government AI technical standard gives buyers a detailed vocabulary for the work surrounding retrieval. The 2025 version includes data access and retrieval processes, archival and deletion, quality assessment and contextual information for generative AI. It identifies RAG among the approaches to adapting a model to an intended domain.
FMI projects Australian RAG revenue to reach USD 805.6 million by 2036 from USD 78.0 million in 2026. The market expands at a 26.3% CAGR during 2026 to 2036. Its commercial scale is smaller than the largest national markets, making the reuse of suitable managed services important to implementation economics. In the Retrieval-Augmented generation market, Australia grows 26.3% a year, 0.7 points below the global rate.
The standard's treatment of data removal is particularly relevant to a retrieval service. If information is withdrawn or superseded, the searchable representation must follow the intended information policy. Otherwise, an apparently current assistant can continue returning material that should no longer be used. FMI expects customers with formal information-management requirements to value evidence of this lifecycle behavior during selection.
Suppliers can also differentiate through the way they measure ongoing performance. Response quality, content availability and source attribution need to be considered together. A system may remain technically available while its answers deteriorate after a document change. The resulting demand is for practical monitoring and accountable maintenance, creating a service opportunity around the platform.
Germany
German buyers evaluating RAG face a specific security issue when models read material that can contain hostile instructions. The BSI's guidance on generative AI warns that prompt injection cannot currently be completely prevented. It recommends restricting the rights of integrated applications and considering residual risks. RAG adds external content to a model's working context, so information access and the ability to take actions need separate review.
FMI forecasts a 25.3% CAGR for Germany from 2026 to 2036. Revenue increases from USD 156.0 million to USD 1,487.8 million. A locally operated system still needs sound permissions and a process for identifying obsolete or manipulated content. Revenue in Germany climbs by USD 1,331.8 million, fifth among the ten.
The commercial implication is a demand for explicit evidence at the interface between search and generation. Suppliers should demonstrate which material the retrieval service excludes and how permission changes propagate. A buyer's evaluation should also distinguish finding a relevant document from following instructions embedded in that document. FMI expects integration providers to retain work around these boundaries because responsibility crosses information security, application ownership and business content teams.
Germany's revenue share declines to 5.2% in 2036 from 6.0% in 2026 as other national markets grow faster. The forecast still produces a much larger absolute market for suppliers that can meet demanding implementation and documentation requirements.
France
France provides a documented example of RAG applied to a specific public-service task. The CNIL's March 2025 sandbox recommendations describe France Travail's personalized training advice project using a foundation model with retrieval from training information and the jobseeker's profile. The reviewed arrangement used an on-premises Mixtral model. The project illustrates why infrastructure and data minimization decisions arise together.
French RAG revenue is forecast to increase at a 25.3% CAGR between 2026 and 2036. FMI values the market at USD 104.0 million in 2026 and USD 991.9 million in 2036. National demand includes applications where controlled organizational knowledge matters more than unrestricted access to a large volume of text. France moves from 4.0% of global revenue in 2026 to 3.5% in 2036. France adds USD 887.9 million, ranking eighth for increase.
A second example shows the importance of gradual rollout. In June 2026, the CEA described its Maïa generative AI platform as available to 6,500 staff, with broader access targeted by year-end. Its agreement with Mistral emphasizes protection of scientific and strategic information.
FMI expects suppliers to benefit when they can explain how the proposed retrieval service fits the institution's existing information boundaries. Specificity matters: the permitted material, eligible users and review process should follow the application. Hosting and model choices are then assessed within that operating context, creating work for both platform providers and specialist integrators.
Who are the notable companies in the Retrieval-Augmented Generation (RAG) Market?
Notable companies in the Retrieval-Augmented Generation (RAG) Market include Microsoft, Google, Amazon Web Services, IBM and Oracle.
Competition spans several purchasing decisions. Microsoft, Google and Amazon Web Services connect managed retrieval to cloud AI services. IBM presents an enterprise architecture linking information preparation, retrieval and generation. Oracle places vector search within its database environment. These approaches compete partly through the customer's existing technology commitments.
Data-platform companies pursue another route. Databricks integrates search with its governed data platform, Elastic combines retrieval methods with search security, and MongoDB supports retrieval from document collections. Cohere supplies embedding and reranking models that can operate within a wider application. Glean announced horizontal enterprise agents in February 2025, extending its application proposition beyond search responses.
Pinecone, Weaviate and Zilliz focus on vector-oriented retrieval infrastructure. Vectara packages retrieval, generation and governance within an application platform. LlamaIndex provides frameworks and document-processing tools used to assemble applications. These roles overlap, but they are not identical. The competitive question is which supplier controls the part of the implementation where the customer sees the greatest operating burden.
Key Developments in the Retrieval-Augmented Generation (RAG) Market
- On 30 September 2026, Cohere announced Embed 5. The Pro and Fast models share an embedding space, allowing different model choices for indexing and interactive querying.
Key Players in the Retrieval-Augmented Generation (RAG) Market
- Microsoft
- Amazon Web Services
- IBM
- Oracle
- Databricks
- Elastic
- MongoDB
- Cohere
- Glean
- Pinecone
- Weaviate
- Vectara
- Zilliz
- LlamaIndex
Retrieval-Augmented Generation (RAG) Market Report Scope
Table 6: Retrieval-Augmented Generation (RAG) Market Report Scope
| Coverage field | Report scope |
|---|---|
| Market definition | Software, platforms and services connecting language-model responses to enterprise information through retrieval, embedding, vector search and orchestration |
| Included commercial activity | Managed services, tools and implementation work attributable to RAG |
| Exclusions | Unrelated cloud infrastructure, general AI contracts and total vendor revenue without attributable RAG activity |
| Quantitative Units | USD million |
| Segmentation | Component, Deployment and End Use |
| Country coverage | United States, China, United Kingdom, Germany, Japan, India, Canada, France, Australia and South Korea |
| Company coverage | Fifteen enterprise, data, model, search, vector infrastructure and application-tool suppliers |
| Regions covered | North America, Western Europe, East Asia, South Asia and Pacific and Rest of world aggregate |
Source: Future Market Insights analysis of the Retrieval-Augmented generation (RAG) market, 2026.
Retrieval-Augmented Generation (RAG) Market Research Methodology
The RAG assessment combines FMI's market outlook with secondary review of original product announcements, technical documentation, public-sector guidance and national adoption evidence. Review distinguishes RAG-attributable revenue from broader AI use and total company sales. Segment and country allocations are checked against the stated global scope, while deployment indicators retain their implementation basis. Competitive interpretation uses documented capabilities and event status, and general AI adoption statistics are not read as RAG spending.
Retrieval-Augmented Generation (RAG) Market by Segments
Retrieval-Augmented Generation (RAG) Market segmented by Component:
- Platforms and Tools
- Vector Databases and Search
- Services
Retrieval-Augmented Generation (RAG) Market segmented by Deployment:
- Public Cloud
- Private Cloud
- On-Premises and Hybrid
Retrieval-Augmented Generation (RAG) Market segmented by End Use:
- IT and Telecom
- Banking and Financial Services
- Healthcare and Life Sciences
- Retail and E-commerce
- Legal and Professional Services
- Other
Retrieval-Augmented Generation (RAG) Market by Region
- North America
- United States
- Canada
- Western Europe
- United Kingdom
- Germany
- France
- East Asia
- China
- Japan
- South Korea
- South Asia and Pacific
- India
- Australia
- Rest of world aggregate
Research Sources and Bibliography
- Alibaba Cloud. (2026, August 26). Knowledge Storage Service product overview. https://www.alibabacloud.com/help/en/tablestore/table-store-service/knowledge-storage-introduction
- Amazon Web Services. (2025, March 7). Amazon Bedrock Knowledge Bases supports GraphRAG now generally available. https://aws.amazon.com/about-aws/whats-new/2025/03/amazon-bedrock-knowledge-bases-graphrag-generally-available/
- Bonney, K., Breaux, C., Dinlersoz, E., Foster, L., Haltiwanger, J., and Pande, A. (2026, April). The Microstructure of AI Diffusion: Evidence from Firms, Business Functions, and Worker Tasks. U.S. Census Bureau, CES-26-25. https://www.census.gov/library/working-papers/2026/adrm/CES-WP-26-25.html
- CEA. (2026, June 22). Le CEA et Mistral renouvellent leur accord pour déployer une IA générative souveraine et sécurisée. https://www.cea.fr/Pages/actualites/ntic/accord-cea-mistral.aspx
- Cohere. (2026, September 30 and October 21). Embed 5 and Rerank 5 release notes. https://docs.cohere.com/v2/changelog
- Commission nationale de l'informatique et des libertés. (2025, March). Bac à sable « IA et services publics »: Les recommandations de la CNIL aux lauréats. https://www.cnil.fr/sites/default/files/2025-04/bac_a_sable_recommandations.pdf
- Databricks. (2026, June 25). Databricks AI Search. https://docs.databricks.com/aws/en/ai-search/ai-search
- Digital Agency, Japan. (2025, May 27; English translation updated June 13). The Guideline for Japanese Governments' Procurements and Utilizations of Generative AI for the sake of Evolution and Innovation of Public Administration. https://www.digital.go.jp/news/3579c42d-b11c-4756-b66e-3d3e35175623
- Digital Transformation Agency, Australia. (2025, August). Australian Government AI technical standard, Version 1. https://www.digital.gov.au/sites/default/files/documents/2025-08/Australian%20Government%20AI%20technical%20standard.pdf
- Elastic. (Accessed 2026, November 9). RAG. https://www.elastic.co/docs/solutions/search/rag
- Federal Office for Information Security, Germany. (Accessed 2026, November 9). Generative AI Models: Opportunities and Risks for Industry and Authorities. https://www.bsi.bund.de/SharedDocs/Downloads/EN/BSI/KI/Generative_AI_Models.pdf?__blob=publicationFile&v=6
- Glean. (2025, February 12). Introducing Glean Agents, Expanding the Work AI Platform and Making AI Agents a Reality for Enterprises. https://www.glean.com/press/glean-makes-horizontal-ai-agents-for-enterprises-expands-work-ai-with-glean-agents
- Google Cloud. (2025, January 9). Introducing Vertex AI RAG Engine: Scale your Vertex AI RAG pipeline with confidence. https://cloud.google.com/blog/products/ai-machine-learning/introducing-vertex-ai-rag-engine
- Google Research. (2025, May 14). Deeper insights into retrieval augmented generation: The role of sufficient context. https://research.google/blog/deeper-insights-into-retrieval-augmented-generation-the-role-of-sufficient-context/
- Government Digital Service. (2025, February 10). Artificial Intelligence Playbook for the UK Government. https://www.gov.uk/government/publications/ai-playbook-for-the-uk-government/artificial-intelligence-playbook-for-the-uk-government-html
- IBM. (Accessed 2026, November 9). Retrieval Augmented Generation architecture pattern. https://www.ibm.com/think/architectures/patterns/genai-rag
- IBM. (Accessed 2026, November 9). Setting up retrieval augmented generation with watsonx Code Assistant. https://cloud.ibm.com/docs/watsonx-code-assistant?topic=watsonx-code-assistant-rag-overview
- LlamaIndex. (Accessed 2026, November 9). LlamaIndex Framework developer documentation. https://developers.llamaindex.ai/python/framework/
- Microsoft. (2025, May 19). Introducing agentic retrieval in Azure AI Search. https://techcommunity.microsoft.com/blog/azure-ai-foundry-blog/introducing-agentic-retrieval-in-azure-ai-search/4414677
- Ministry of Science and ICT, Republic of Korea. (2026, January). The AI Basic Act Comes into Force to Lay the Foundation for Korea to Become an AI G3. https://msit.go.kr/eng/bbs/view.do?bbsSeqNo=42&mId=4&mPid=2&nttSeqNo=1214&sCode=eng
- MongoDB. (Accessed 2026, November 9). Retrieval-Augmented Generation with MongoDB Vector Search. https://www.mongodb.com/docs/atlas/atlas-vector-search/rag/
- National Institute of Standards and Technology. (2025). Retrieval-augmented generation glossary entry, citing NIST AI 100-2e2025. https://csrc.nist.gov/glossary/term/retrieval_augmented_generation
- Oracle. (2025, September 12). Oracle Database 23ai: Vector Search, Spatial Graphs, and Grounded Generative AI in Enterprise Data Systems. https://blogs.oracle.com/database/oracle-database-23ai-vector-search-spatial-graphs-and-grounded-generative-ai-in-enterprise-data-systems
- Pinecone. (Accessed 2026, November 9). Pinecone Database overview. https://docs.pinecone.io/guides/get-started/overview
- Press Information Bureau, Government of India. (2025, December 30). Transforming India with AI. https://www.pib.gov.in/PressReleasePage.aspx?PRID=2209737&lang=1®=1
- Statistics Canada. (2026, July 30). Use of generative artificial intelligence tools among Canadian workers, March 2026. https://www150.statcan.gc.ca/n1/daily-quotidien/260730/dq260730b-eng.htm
- Treasury Board of Canada Secretariat. (Accessed 2026, November 9). Guide on the use of generative artificial intelligence. https://www.canada.ca/en/government/system/digital-government/digital-government-innovations/responsible-use-ai/generative-ai/guide-use-generative-ai.html
- Vectara. (Accessed 2026, November 9). About Vectara. https://docs.vectara.com/docs
- Weaviate. (Accessed 2026, November 9). Weaviate Database documentation. https://docs.weaviate.io/weaviate
- Zilliz. (Accessed 2026, November 9). Zilliz Cloud Developer Hub. https://docs.zilliz.com/docs/home
This bibliography is provided for reader reference and is not exhaustive. The full report contains the complete reference list and detailed citations.
Table of Content
- Key Takeaways
- Market Size and CAGR
- Top Growth Driver
- Fastest Growing Segment
- Leading Region
- Key Companies
- Emerging Opportunities
- Executive Summary
- Global Market Outlook
- Demand-side Trends
- Supply-side Trends
- Technology Roadmap Analysis
- Analysis and Recommendations
- Analyst Perspective (What is happening? Why now? What should investors know?)
- Key Questions Answered
- How large is the market?
- What is the CAGR?
- What are key trends?
- Which region dominates?
- Who are the leaders?
Read More...
- Market Overview
- Market Coverage / Taxonomy
- Market Definition / Scope / Limitations
- Research Methodology
- Chapter Orientation
- Analytical Lens and Working Hypotheses
- Market Structure, Signals, and Trend Drivers
- Benchmarking and Cross-market Comparability
- Market Sizing, Forecasting, and Opportunity Mapping
- Research Design and Evidence Framework
- Desk Research Programme (Secondary Evidence)
- Expert Input and Fieldwork (Primary Evidence)
- Tooling, Models, and Reference Databases
- Data Engineering and Model Build
- Quality Assurance and Audit Trail
- Market Background
- Market Dynamics (Drivers, Restraints, Opportunity, Trends)
- Scenario Forecast (Optimistic, Likely, Conservative)
- Impact Analysis
- AI Impact
- Sustainability Impact
- Regulatory Impact
- Technology Impact
- Consumer / Buyer Analysis
- Purchase Drivers
- Adoption Barriers
- Buyer Journey
- Opportunity Map Analysis
- Product Life Cycle Analysis
- Supply Chain Analysis
- Investment Feasibility Matrix
- Value Chain Analysis
- PESTLE and Porter's Analysis
- Regulatory Landscape
- Regional Parent Market Outlook
- Production and Consumption Statistics
- Import and Export Statistics
- Global Market Analysis and Forecast, 2021 to 2036
- Historical Market Size Value (USD Million) Analysis, 2021 to 2025
- Current and Future Market Size Value (USD Million) Projections, 2026 to 2036
- Y-o-Y Growth Trend Analysis
- Absolute $ Opportunity Analysis
- Global Market Pricing Analysis, 2021 to 2036
- Global Market Analysis and Forecast, By Component, 2021 to 2036
- Introduction / Key Findings
- Historical Market Size Value (USD Million) Analysis By Component, 2021 to 2025
- Current and Future Market Size Value (USD Million) Analysis and Forecast By Component, 2026 to 2036
- Platforms and Tools
- Vector Databases and Search
- Services
- Y-o-Y Growth Trend Analysis By Component, 2021 to 2025
- Absolute $ Opportunity Analysis By Component, 2026 to 2036
- Global Market Analysis and Forecast, By Deployment, 2021 to 2036
- Introduction / Key Findings
- Historical Market Size Value (USD Million) Analysis By Deployment, 2021 to 2025
- Current and Future Market Size Value (USD Million) Analysis and Forecast By Deployment, 2026 to 2036
- Public Cloud
- Private Cloud
- On-Premises and Hybrid
- Y-o-Y Growth Trend Analysis By Deployment, 2021 to 2025
- Absolute $ Opportunity Analysis By Deployment, 2026 to 2036
- Global Market Analysis and Forecast, By End Use, 2021 to 2036
- Introduction / Key Findings
- Historical Market Size Value (USD Million) Analysis By End Use, 2021 to 2025
- Current and Future Market Size Value (USD Million) Analysis and Forecast By End Use, 2026 to 2036
- IT and Telecom
- Banking and Financial Services
- Healthcare and Life Sciences
- Retail and E-commerce
- Legal and Professional Services
- Other
- Y-o-Y Growth Trend Analysis By End Use, 2021 to 2025
- Absolute $ Opportunity Analysis By End Use, 2026 to 2036
- Global Market Analysis and Forecast, By Region, 2021 to 2036
- Introduction
- Historical Market Size Value (USD Million) Analysis By Region, 2021 to 2025
- Current Market Size Value (USD Million) Analysis and Forecast By Region, 2026 to 2036
- North America
- Western Europe
- East Asia
- South Asia and Pacific
- Market Attractiveness Analysis By Region
- North America Market Analysis and Forecast, By Country, 2021 to 2036
- Historical Market Size Value (USD Million) Trend Analysis By Market Taxonomy, 2021 to 2025
- Market Size Value (USD Million) Forecast By Market Taxonomy, 2026 to 2036
- By Country
- United States
- Canada
- By Component
- By Deployment
- By End Use
- By Country
- Market Attractiveness Analysis
- By Country
- By Component
- By Deployment
- By End Use
- Key Takeaways
- Western Europe Market Analysis and Forecast, By Country
- Historical Market Size Value (USD Million) Trend Analysis By Market Taxonomy, 2021 to 2025
- Market Size Value (USD Million) Forecast By Market Taxonomy, 2026 to 2036
- By Country
- United Kingdom
- Germany
- France
- By Component
- By Deployment
- By End Use
- By Country
- Market Attractiveness Analysis
- By Country
- By Component
- By Deployment
- By End Use
- Key Takeaways
- East Asia Market Analysis and Forecast, By Country
- Historical Market Size Value (USD Million) Trend Analysis By Market Taxonomy, 2021 to 2025
- Market Size Value (USD Million) Forecast By Market Taxonomy, 2026 to 2036
- By Country
- China
- Japan
- South Korea
- By Component
- By Deployment
- By End Use
- By Country
- Market Attractiveness Analysis
- By Country
- By Component
- By Deployment
- By End Use
- Key Takeaways
- South Asia and Pacific Market Analysis and Forecast, By Country
- Historical Market Size Value (USD Million) Trend Analysis By Market Taxonomy, 2021 to 2025
- Market Size Value (USD Million) Forecast By Market Taxonomy, 2026 to 2036
- By Country
- India
- Australia
- Rest of world aggregate
- By Component
- By Deployment
- By End Use
- By Country
- Market Attractiveness Analysis
- By Country
- By Component
- By Deployment
- By End Use
- Key Takeaways
- Key Countries Market Analysis
- United States
- Pricing Analysis
- Market Share Analysis, 2025
- By Component
- By Deployment
- By End Use
- Canada
- Pricing Analysis
- Market Share Analysis, 2025
- By Component
- By Deployment
- By End Use
- Germany
- Pricing Analysis
- Market Share Analysis, 2025
- By Component
- By Deployment
- By End Use
- United Kingdom
- Pricing Analysis
- Market Share Analysis, 2025
- By Component
- By Deployment
- By End Use
- France
- Pricing Analysis
- Market Share Analysis, 2025
- By Component
- By Deployment
- By End Use
- India
- Pricing Analysis
- Market Share Analysis, 2025
- By Component
- By Deployment
- By End Use
- China
- Pricing Analysis
- Market Share Analysis, 2025
- By Component
- By Deployment
- By End Use
- Japan
- Pricing Analysis
- Market Share Analysis, 2025
- By Component
- By Deployment
- By End Use
- South Korea
- Pricing Analysis
- Market Share Analysis, 2025
- By Component
- By Deployment
- By End Use
- Australia
- Pricing Analysis
- Market Share Analysis, 2025
- By Component
- By Deployment
- By End Use
- United States
- Market Structure Analysis
- Competition Dashboard
- Competition Benchmarking
- Market Share Analysis of Top Players
- By Regional
- By Component
- By Deployment
- By End Use
- Emerging Startups
- Innovation Benchmarking
- Competition Analysis
- Competition Deep Dive
- Microsoft
- Overview
- Product Portfolio
- Profitability by Market Segments
- Sales Footprint
- Strategy Overview
- Marketing Strategy
- Product Strategy
- Channel Strategy
- Amazon Web Services
- IBM
- Oracle
- Databricks
- Elastic
- MongoDB
- Cohere
- Glean
- Pinecone
- Weaviate
- Vectara
- Zilliz
- LlamaIndex
- Microsoft
- Case Studies
- Success Stories
- Recent Developments
- Competition Deep Dive
- Assumptions & Acronyms Used
List of Tables
- Table 1: Global Market Value (USD Million) Forecast by Region, 2021 to 2036
- Table 2: Global Market Value (USD Million) Forecast by Component, 2021 to 2036
- Table 3: Global Market Value (USD Million) Forecast by Deployment, 2021 to 2036
- Table 4: Global Market Value (USD Million) Forecast by End Use, 2021 to 2036
- Table 5: North America Market Value (USD Million) Forecast by Country, 2021 to 2036
- Table 6: North America Market Value (USD Million) Forecast by Component, 2021 to 2036
- Table 7: North America Market Value (USD Million) Forecast by Deployment, 2021 to 2036
- Table 8: North America Market Value (USD Million) Forecast by End Use, 2021 to 2036
- Table 9: Western Europe Market Value (USD Million) Forecast by Country, 2021 to 2036
- Table 10: Western Europe Market Value (USD Million) Forecast by Component, 2021 to 2036
- Table 11: Western Europe Market Value (USD Million) Forecast by Deployment, 2021 to 2036
- Table 12: Western Europe Market Value (USD Million) Forecast by End Use, 2021 to 2036
- Table 13: East Asia Market Value (USD Million) Forecast by Country, 2021 to 2036
- Table 14: East Asia Market Value (USD Million) Forecast by Component, 2021 to 2036
- Table 15: East Asia Market Value (USD Million) Forecast by Deployment, 2021 to 2036
- Table 16: East Asia Market Value (USD Million) Forecast by End Use, 2021 to 2036
- Table 17: South Asia and Pacific Market Value (USD Million) Forecast by Country, 2021 to 2036
- Table 18: South Asia and Pacific Market Value (USD Million) Forecast by Component, 2021 to 2036
- Table 19: South Asia and Pacific Market Value (USD Million) Forecast by Deployment, 2021 to 2036
- Table 20: South Asia and Pacific Market Value (USD Million) Forecast by End Use, 2021 to 2036
List of Figures
- Figure 1: Global Market Pricing Analysis
- Figure 2: Global Market Value (USD Million) Forecast 2021-2036
- Figure 3: Global Market Value Share and BPS Analysis by Component, 2026 and 2036
- Figure 4: Global Market Y-o-Y Growth Comparison by Component, 2026-2036
- Figure 5: Global Market Attractiveness Analysis by Component
- Figure 6: Global Market Value Share and BPS Analysis by Deployment, 2026 and 2036
- Figure 7: Global Market Y-o-Y Growth Comparison by Deployment, 2026-2036
- Figure 8: Global Market Attractiveness Analysis by Deployment
- Figure 9: Global Market Value Share and BPS Analysis by End Use, 2026 and 2036
- Figure 10: Global Market Y-o-Y Growth Comparison by End Use, 2026-2036
- Figure 11: Global Market Attractiveness Analysis by End Use
- Figure 12: Global Market Value (USD Million) Share and BPS Analysis by Region, 2026 and 2036
- Figure 13: Global Market Y-o-Y Growth Comparison by Region, 2026-2036
- Figure 14: Global Market Attractiveness Analysis by Region
- Figure 15: North America Market Incremental Dollar Opportunity, 2026-2036
- Figure 16: Western Europe Market Incremental Dollar Opportunity, 2026-2036
- Figure 17: East Asia Market Incremental Dollar Opportunity, 2026-2036
- Figure 18: South Asia and Pacific Market Incremental Dollar Opportunity, 2026-2036
- Figure 19: North America Market Value Share and BPS Analysis by Country, 2026 and 2036
- Figure 20: North America Market Value Share and BPS Analysis by Component, 2026 and 2036
- Figure 21: North America Market Y-o-Y Growth Comparison by Component, 2026-2036
- Figure 22: North America Market Attractiveness Analysis by Component
- Figure 23: North America Market Value Share and BPS Analysis by Deployment, 2026 and 2036
- Figure 24: North America Market Y-o-Y Growth Comparison by Deployment, 2026-2036
- Figure 25: North America Market Attractiveness Analysis by Deployment
- Figure 26: North America Market Value Share and BPS Analysis by End Use, 2026 and 2036
- Figure 27: North America Market Y-o-Y Growth Comparison by End Use, 2026-2036
- Figure 28: North America Market Attractiveness Analysis by End Use
- Figure 29: Western Europe Market Value Share and BPS Analysis by Country, 2026 and 2036
- Figure 30: Western Europe Market Value Share and BPS Analysis by Component, 2026 and 2036
- Figure 31: Western Europe Market Y-o-Y Growth Comparison by Component, 2026-2036
- Figure 32: Western Europe Market Attractiveness Analysis by Component
- Figure 33: Western Europe Market Value Share and BPS Analysis by Deployment, 2026 and 2036
- Figure 34: Western Europe Market Y-o-Y Growth Comparison by Deployment, 2026-2036
- Figure 35: Western Europe Market Attractiveness Analysis by Deployment
- Figure 36: Western Europe Market Value Share and BPS Analysis by End Use, 2026 and 2036
- Figure 37: Western Europe Market Y-o-Y Growth Comparison by End Use, 2026-2036
- Figure 38: Western Europe Market Attractiveness Analysis by End Use
- Figure 39: East Asia Market Value Share and BPS Analysis by Country, 2026 and 2036
- Figure 40: East Asia Market Value Share and BPS Analysis by Component, 2026 and 2036
- Figure 41: East Asia Market Y-o-Y Growth Comparison by Component, 2026-2036
- Figure 42: East Asia Market Attractiveness Analysis by Component
- Figure 43: East Asia Market Value Share and BPS Analysis by Deployment, 2026 and 2036
- Figure 44: East Asia Market Y-o-Y Growth Comparison by Deployment, 2026-2036
- Figure 45: East Asia Market Attractiveness Analysis by Deployment
- Figure 46: East Asia Market Value Share and BPS Analysis by End Use, 2026 and 2036
- Figure 47: East Asia Market Y-o-Y Growth Comparison by End Use, 2026-2036
- Figure 48: East Asia Market Attractiveness Analysis by End Use
- Figure 49: South Asia and Pacific Market Value Share and BPS Analysis by Country, 2026 and 2036
- Figure 50: South Asia and Pacific Market Value Share and BPS Analysis by Component, 2026 and 2036
- Figure 51: South Asia and Pacific Market Y-o-Y Growth Comparison by Component, 2026-2036
- Figure 52: South Asia and Pacific Market Attractiveness Analysis by Component
- Figure 53: South Asia and Pacific Market Value Share and BPS Analysis by Deployment, 2026 and 2036
- Figure 54: South Asia and Pacific Market Y-o-Y Growth Comparison by Deployment, 2026-2036
- Figure 55: South Asia and Pacific Market Attractiveness Analysis by Deployment
- Figure 56: South Asia and Pacific Market Value Share and BPS Analysis by End Use, 2026 and 2036
- Figure 57: South Asia and Pacific Market Y-o-Y Growth Comparison by End Use, 2026-2036
- Figure 58: South Asia and Pacific Market Attractiveness Analysis by End Use
- Figure 59: Global Market - Tier Structure Analysis
- Figure 60: Global Market - Company Share Analysis
Frequently Asked Questions
How big is the Retrieval-Augmented generation (RAG) market in 2026?
FMI estimates the market at USD 2,600.0 million in 2026, up from USD 2,000.0 million in 2025. It is forecast to reach USD 28,379.9 million by 2036 at a 27.0% CAGR.
Which component leads the Retrieval-Augmented generation (RAG) market in 2026?
Platforms and Tools leads by component with 55.0% in 2026. All other segments together hold 45.0%.
Which deployment and end use lead in 2026?
Public Cloud holds 62.0% by deployment and IT and Telecom holds 22.0% by end use in FMI's 2026 assessment.
Which market is forecast to grow fastest through 2036?
China and India tie for the highest forecast CAGR at 30.3% during 2026 to 2036, followed by South Korea at 27.3%.
Does RAG remove the need to review generated answers?
No. Retrieved context can be incomplete or inappropriate. Google's sufficient-context research and the BSI's security guidance support separate evaluation of answer support and information access.[4][8]
Preview the report firsthand - request a free sample
Get SampleGet the brochure for pricing and purchase details.
Get PDF
