Senior Friendly Packaging Market Size and Share Forecast Outlook 2025 to 2035

Senior friendly packaging market was valued at approximately USD 5.2 billion in 2025 and is anticipated to reach USD 8.7 billion by 2035, registering a CAGR of 5.2% over the forecast period. Sales in 2024 were estimated to reach nearly USD 5,013.6 billion, reflecting a steady rise in demand driven by an aging global population and the increasing need for packaging solutions that offer safety, ease of use, and accessibility.
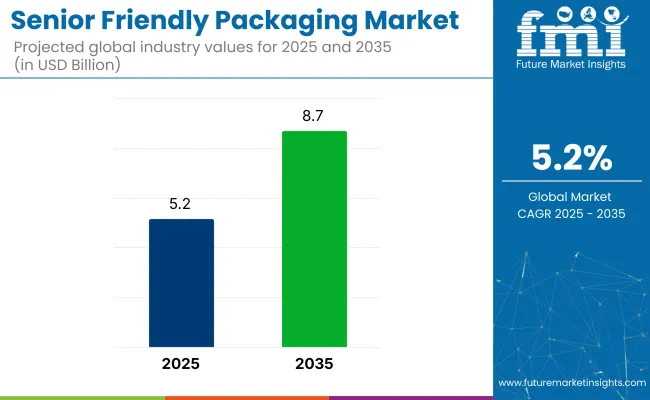
Quick Stats of Senior Friendly Packaging Market

  • Market Value (2025): USD 5.2 billion
  • Forecast Value (2035): USD 8.7 billion
  • Forecast CAGR: 5.2%
  • Product Leader in 2025: Safety Caps and Closures (36.9% market share)
  • Top Application: Healthcare (44.2% share)
  • Key Growth Region: Asia Pacific (China is the fastest‑growing market with 6.0% CAGR)

Senior Friendly Packaging Market

Metric Value
Market Size in 2025 USD 5.2 billion
Projected Market Size in 2035 USD 8.7 billion
CAGR (2025 to 2035) 5.2%

Growth has been further supported by heightened consumer awareness regarding medication adherence and the growing pressure on healthcare systems to reduce administration errors and improve treatment outcomes. Senior friendly packaging has become an integral component in patient-centric design strategies, especially across pharmaceutical and consumer health product categories.

In 2024, Berry Global was recognized with Silver Awards at the FlexPack Voice Sustainability Awards for its 50% recycled-content multi-use e-commerce mailer. “Sustainability is not just something we talk about at Berry, but a principle ingrained in our culture and strategy. We believe that we are leading the industry in terms of the energy and resources we are pointing toward sustainability,” said Jerry Lamarre, Executive Vice President/GM, Engineered Materials Division, Berry Global.

Technological integration has enabled significant progress in delivering smart and adaptive packaging solutions tailored to older consumers. Features such as time-activated reminders, digital dosage trackers, and color-coded compartments have entered the market to support better compliance and caregiver communication.

Advances in material engineering have also facilitated the creation of lighter yet durable structures that simplify handling without compromising protection. Alongside this, emphasis has been placed on minimizing environmental impact by employing recyclable materials, water-based inks, and reduced secondary packaging, all while maintaining senior-friendly functionality.

Technology integration has played a growing role in advancing senior friendly packaging. Smart packaging formats have introduced features such as audible alarms, light indicators, and mobile-linked adherence monitoring systems. These innovations are being explored not only to enhance compliance but also to support caregivers in tracking medication usage.

Simultaneously, rising interest in environmental responsibility has led to efforts toward recyclable, compostable, and bio-based materials within senior-friendly formats. Looking forward, the market is expected to maintain momentum as packaging design continues to evolve in response to demographic shifts and healthcare delivery models prioritizing patient empowerment.

Analyzing Senior Friendly Packaging Market by Top Investment Segment

The market is segmented based on product type, application, end use, and region. By product type, the market includes easy grip bottles and containers, safety caps and closures, single-dose pouches and blister packs, and graphic labels and tags. In terms of application, the market is categorized into consumer products, medicinal tablets, pills and syrups, and body and hair care products.

By end use, the market comprises food and beverages, healthcare, cosmetics and personal care, and other consumer durables. Regionally, the market is analyzed across North America, Latin America, Western Europe, Eastern Europe, East Asia, South Asia & Pacific, and the Middle East & Africa.
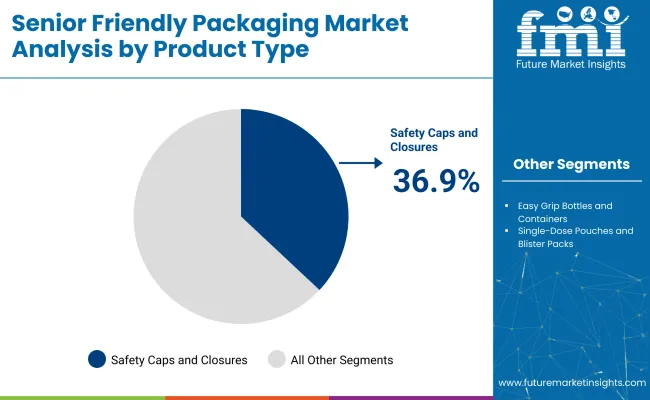
Safety Caps and Closures Selected for Their Ease of Use and Tamper Prevention

Senior Friendly Packaging Analysis By Product Type

Safety caps and closures are expected to hold the largest share of 36.9% in the senior friendly packaging market in 2025, as their adoption has been driven by ergonomic grip, opening simplicity, and tamper-resistance. These components have been widely used in pharmaceutical bottles, OTC medications, and nutraceutical containers.

Grip-enhancing ridges, push-turn mechanisms, and enlarged diameters have been engineered for seniors with reduced dexterity or joint strength. Consistency in sealing and resealing performance has supported use across regulated healthcare packaging lines.

Closures designed for audible clicks and visual alignment indicators have aided users with cognitive and visual impairments. Manufacturing lines have integrated these caps with automated torque testing to ensure compliance. Adjustable torque levels and wide-thread designs have enabled both safety and accessibility in one unit. Market dominance has been retained through standardized closure formats across aging-focused product portfolios.
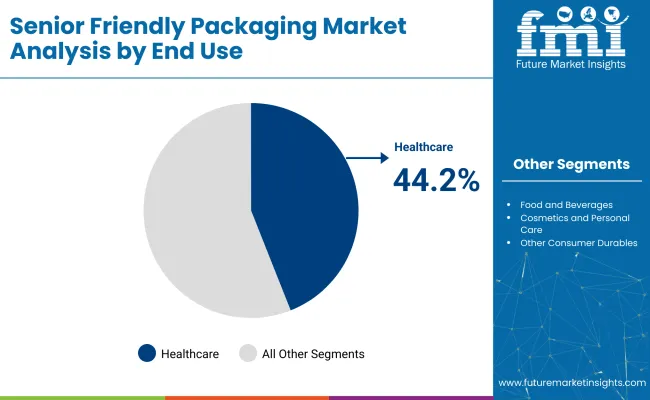
Healthcare Segment Leads with High Demand for Accessible Medication Packaging

Senior Friendly Packaging Analysis By End Use

The healthcare end-use segment is projected to account for 44.2% of the senior friendly packaging market in 2025, as growth has been supported by aging population trends, chronic condition management, and regulatory pressure for accessible dosing.

Blister packs, pill bottles, and dispensing systems have been customized to reduce effort, confusion, and handling errors. Medication adherence tools, including labeled compartments and simplified opening systems, have been widely incorporated. Packaging design has been aligned with guidelines set by health authorities and senior advocacy groups.

Patient-centric packaging with clear fonts, color coding, and audible feedback features has been adopted to improve safety and compliance. Refill packaging and multi-dose containers have been tailored to support daily regimens and pharmacy distribution systems. Use cases in clinics, long-term care, and home-based treatments have driven scale. Continued demand has been forecasted due to the global rise in senior patient populations and elder care services.

Challenges and Opportunities

Challenges

High Production Costs and Regulatory Compliance

Senior-friendly packages require quality materials and design changes, which increases production costs. More onerous regulatory requirements for materials can also raise costs and complications for the manufacturers.

Limited Availability of Eco-Friendly Materials

Although there is a rising request for sustainable packaging solutions, numerous senior-friendly packaging strategies rely on conventional plastics. However, there are not many biodegradable or recyclable materials that can be used in approachable designs for elderly, which makes it difficult for manufacturers to strike a balance between usability and eco-design.

Opportunities

Aging Global Population Driving Demand

One of the major drivers for recycling in the packaging production business is the rising aging population worldwide creating this growing demand for seniors packaging i.e. easy to open and usability, and recycling. The increasing geriatric population provides a significant growth opportunity for the senior-friendly packaging industry.

Technological Integration Enhancing Usability

New technologies provide the opportunity to develop smart packaging, such as blister packs with electronic reminders or QR codes that connect to video instruction. These innovations improve the usability and safety of packaging for aging population, promoting market growth.
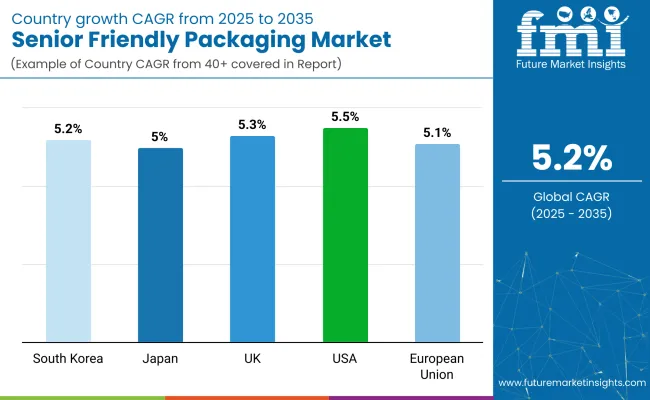
Country-wise outlook- senior friendly packaging market

Country Wise Analysis Of Senior Friendly Packaging

United States

The demand for senior-friendly packaging in the USA is largely being driven by the increasing aging population and subsequent demand for packaging that ensures safety and ease of use for older adults. To address the physical challenges faced by seniors, packaging manufacturers are focusing on creating easy-to-open, tamper-evident, and ergonomically designed packaging.

Such packaging solutions are in great demand in the healthcare and food industry where the elders prefer packaging that require less physical effort. Furthermore, regulatory guidelines promoting the use of user-friendly packaging for healthcare products also propel the growth of the market.

Country CAGR (2025 to 2035)
USA 5.5%

United Kingdom

The senior-friendly packaging market in the UK is making inroads with a better focus on enabling elderly people with packaging approaches that offer convenience and safety enhancements. Several industries heavily depend on easy-to-handle packaging, including pharmaceuticals, food, and personal care products, as the aging demographic increasingly drives demand for such packages.

The UK government’s strong focus on caring for its aging population has spurred businesses to create packaging that offers tactile characteristics, simpler labeling and easy-opening mechanisms. Additionally, eco-friendly sustainable packaging solutions looms Rescue products for elderly needs and also sustainable development for environment.

Country CAGR (2025 to 2035)
UK 5.3%

European Union

The senior-friendly packaging industry in the European Union is growing steadily, propelled by the rising share of elderly citizens across member states. The ageing population in nations such as Germany, France and Italy has led to a growing demand for packaging that aids usage by older people.

Packaging that is lightweight and easy to open or helps seniors with limited dexterity navigate food products is an area of innovation. The regulatory authorities are advocating for a packaging solution that is safer for seniors in the EU, while the new trend for sustainability is driving the development of environmentally sustainable senior-friendly packaging solutions.

Country CAGR (2025 to 2035)
European Union (EU) 5.1%

Japan

Japan has seen incredible growth in the senior-friendly packaging market, as its population continues to age and the demand for products designed for the needs of seniors increases. Japanese packaging manufacturers are increasingly focused on creating accessible and ergonomic solutions, with a strong emphasis on easy-to-open packaging.

User-friendly packaging is not limited to cosmetics; it also applies to food, personal care and pharmaceuticals. As Japan is devoted to improving elderly citizens’ quality of life, innovations such as larger print sizes, tactile surfaces and lower physical effort needed to open packages are becoming standard.

Country CAGR (2025 to 2035)
Japan 5.0%

South Korea

The market for products with senior-friendly packaging in South Korea is on the rise, with a dramatic increase in its elderly population and government efforts to enhance elderly care. Packaging that offers easy access and safe handling is becoming a trend among South Korean consumers.

There is huge demand for innovations like resealable packs, single-serve packaging, and easy-to-navigate labeling. As the government concentrates on elderly care programs and the fast-growing food delivery services in the country, manufacturers are being urged to develop packaging offerings that would cater to the specific needs of senior citizens.

Country CAGR (2025 to 2035)
South Korea 5.2%

Competitive Outlook

The global senior friendly packaging market is witnessing massive growth on account of increasing population aging in developed and emerging regions. More and more elderly consumers are needed specialized packaging solutions, and thus companies are innovating solutions that best fit the customer demand for ease-of-use, accessibility as well as safety.

However, it has led towards user-centric packaging designs which include senior-friendly components like easy-open lids, resealable packs, larger text, and high-contrast labels. Moreover, improved materials and technology made it possible to design more lightweight and ergonomic packaging solutions, a must have feature for those elderly people suffering from arthritis or reduced strength.

Key Players

  • WestRock Company-Specializes in designing user-friendly and sustainable packaging solutions with a focus on senior-friendly features, such as easy-to-open boxes and tear-resistant seals, catering to the health and wellness industry.
  • Mondi Group-Focused on the development of eco-friendly and practical packaging solutions that help seniors manage health-related products more easily, with innovations such as easy-access packaging for medicines and vitamins.
  • ProAmpac-Known for producing flexible packaging solutions with enhanced user interfaces, including convenient packaging designs with larger fonts and simplified opening mechanisms aimed at improving accessibility for older consumers.
  • Sealed Air Corporation-Integrates smart packaging technologies to provide senior-friendly packaging solutions, enhancing product safety and ease of handling with tamper-evident seals and ergonomic designs for better grip.
  • Packaging Corporation of America-Developing sustainable and user-centric packaging solutions, including innovative designs for senior-friendly food packaging and household products to ensure ease of use and safety.

Key Segmentation

By Product Type:

  • Easy Grip Bottles and Containers
  • Safety Caps and Closures
  • Single-Dose Pouches and Blister Packs
  • Graphic Labels and Tags

By Application:

  • Consumer Products
  • Medicinal Tablets, Pills, and Syrups
  • Body and Hair Care Products

By End Use:

  • Food and Beverages
  • Healthcare
  • Cosmetics and Personal Care
  • Other Consumer Durables

By Region:

  • North America
  • Latin America
  • Western Europe
  • Eastern Europe
  • East Asia
  • South Asia and Pacific
  • Middle East and Africa

Table of Content

  1. Executive Summary
    • Global Market Outlook
    • Demand-side Trends
    • Supply-side Trends
    • Technology Roadmap Analysis
    • Analysis and Recommendations
  2. Market Overview
    • Market Coverage/Taxonomy
    • Market Definition/Scope/Limitations
  3. Market Background
    • Market Dynamics
      • Drivers
      • Restraints
      • Opportunity
      • Trends
    • Scenario Forecast
      • Demand in Optimistic Scenario
      • Demand in Likely Scenario
      • Demand in Conservative Scenario
    • Opportunity Map Analysis
    • Product Life Cycle Analysis
    • Supply Chain Analysis
      • Supply Side Participants and their Roles
        • Producers
        • Mid-Level Participants (Traders/ Agents/ Brokers)
        • Wholesalers and Distributors
      • Value Added and Value Created at Node in the Supply Chain
      • List of Raw Material Suppliers
      • List of Existing and Potential Buyer’s
    • Investment Feasibility Matrix
    • Value Chain Analysis
      • Profit Margin Analysis
      • Wholesalers and Distributors
      • Retailers
    • PESTLE and Porter’s Analysis
    • Regulatory Landscape
      • By Key Regions
      • By Key Countries
    • Regional Parent Market Outlook
    • Production and Consumption Statistics
    • Import and Export Statistics
  4. Global Market Analysis 2020 to 2024 and Forecast, 2025 to 2035
    • Historical Market Size Value (USD Million) & Volume (Units) Analysis, 2020 to 2024
    • Current and Future Market Size Value (USD Million) & Volume (Units) Projections, 2025 to 2035
      • Y-o-Y Growth Trend Analysis
      • Absolute $ Opportunity Analysis
  5. Global Market Analysis 2020 to 2024 and Forecast 2025 to 2035, By Product Type
    • Introduction/Key Findings
    • Historical Market Size Value (USD Million) & Volume (Units) Analysis By Product Type, 2020 to 2024
    • Current and Future Market Size Value (USD Million) & Volume (Units) Analysis and Forecast By Product Type, 2025 to 2035
      • Easy Grip Bottles and Containers
      • Safety Caps and Closures
      • Single-Dose Pouches and Blister Packs
      • Graphic Labels and Tags
    • Y-o-Y Growth Trend Analysis By Product Type, 2020 to 2024
    • Absolute $ Opportunity Analysis By Product Type, 2025 to 2035
  6. Global Market Analysis 2020 to 2024 and Forecast 2025 to 2035, By Application
    • Introduction/Key Findings
    • Historical Market Size Value (USD Million) & Volume (Units) Analysis By Application, 2020 to 2024
    • Current and Future Market Size Value (USD Million) & Volume (Units) Analysis and Forecast By Application, 2025 to 2035
      • Consumer Products
      • Medicinal Tablets, Pills, and Syrups
      • Body and Hair Care Products
    • Y-o-Y Growth Trend Analysis By Application, 2020 to 2024
    • Absolute $ Opportunity Analysis By Application, 2025 to 2035
  7. Global Market Analysis 2020 to 2024 and Forecast 2025 to 2035, By End Use
    • Introduction/Key Findings
    • Historical Market Size Value (USD Million) & Volume (Units) Analysis By End Use, 2020 to 2024
    • Current and Future Market Size Value (USD Million) & Volume (Units) Analysis and Forecast By End Use, 2025 to 2035
      • Food and Beverages
      • Healthcare
      • Cosmetics and Personal Care
      • Other Consumer Durables
    • Y-o-Y Growth Trend Analysis By End Use, 2020 to 2024
    • Absolute $ Opportunity Analysis By End Use, 2025 to 2035
  8. Global Market Analysis 2020 to 2024 and Forecast 2025 to 2035, By Region
    • Introduction
    • Historical Market Size Value (USD Million) & Volume (Units) Analysis By Region, 2020 to 2024
    • Current Market Size Value (USD Million) & Volume (Units) Analysis and Forecast By Region, 2025 to 2035
      • North America
      • Latin America
      • Europe
      • East Asia
      • South Asia
      • Oceania
      • MEA
    • Market Attractiveness Analysis By Region
  9. North America Market Analysis 2020 to 2024 and Forecast 2025 to 2035, By Country
    • Historical Market Size Value (USD Million) & Volume (Units) Trend Analysis By Market Taxonomy, 2020 to 2024
    • Market Size Value (USD Million) & Volume (Units) Forecast By Market Taxonomy, 2025 to 2035
      • By Country
        • USA
        • Canada
      • By Product Type
      • By Application
      • By End Use
    • Market Attractiveness Analysis
      • By Country
      • By Product Type
      • By Application
      • By End Use
    • Key Takeaways
  10. Latin America Market Analysis 2020 to 2024 and Forecast 2025 to 2035, By Country
    • Historical Market Size Value (USD Million) & Volume (Units) Trend Analysis By Market Taxonomy, 2020 to 2024
    • Market Size Value (USD Million) & Volume (Units) Forecast By Market Taxonomy, 2025 to 2035
      • By Country
        • Brazil
        • Mexico
        • Argentina
        • Chile
        • Peru
        • Rest of Latin America
      • By Product Type
      • By Application
      • By End Use
    • Market Attractiveness Analysis
      • By Country
      • By Product Type
      • By Application
      • By End Use
    • Key Takeaways
  11. Europe Market Analysis 2020 to 2024 and Forecast 2025 to 2035, By Country
    • Historical Market Size Value (USD Million) & Volume (Units) Trend Analysis By Market Taxonomy, 2020 to 2024
    • Market Size Value (USD Million) & Volume (Units) Forecast By Market Taxonomy, 2025 to 2035
      • By Country
        • Germany
        • Italy
        • France
        • UK
        • Spain
        • Russia
        • BENELUX
        • Rest of Europe
      • By Product Type
      • By Application
      • By End Use
    • Market Attractiveness Analysis
      • By Country
      • By Product Type
      • By Application
      • By End Use
    • Key Takeaways
  12. East Asia Market Analysis 2020 to 2024 and Forecast 2025 to 2035, By Country
    • Historical Market Size Value (USD Million) & Volume (Units) Trend Analysis By Market Taxonomy, 2020 to 2024
    • Market Size Value (USD Million) & Volume (Units) Forecast By Market Taxonomy, 2025 to 2035
      • By Country
        • China
        • Japan
        • South Korea
      • By Product Type
      • By Application
      • By End Use
    • Market Attractiveness Analysis
      • By Country
      • By Product Type
      • By Application
      • By End Use
    • Key Takeaways
  13. South Asia Market Analysis 2020 to 2024 and Forecast 2025 to 2035, By Country
    • Historical Market Size Value (USD Million) & Volume (Units) Trend Analysis By Market Taxonomy, 2020 to 2024
    • Market Size Value (USD Million) & Volume (Units) Forecast By Market Taxonomy, 2025 to 2035
      • By Country
        • India
        • Thailand
        • Malaysia
        • Indonesia
        • Rest of South Asia
      • By Product Type
      • By Application
      • By End Use
    • Market Attractiveness Analysis
      • By Country
      • By Product Type
      • By Application
      • By End Use
    • Key Takeaways
  14. Oceania Market Analysis 2020 to 2024 and Forecast 2025 to 2035, By Country
    • Historical Market Size Value (USD Million) & Volume (Units) Trend Analysis By Market Taxonomy, 2020 to 2024
    • Market Size Value (USD Million) & Volume (Units) Forecast By Market Taxonomy, 2025 to 2035
      • By Country
        • Australia
        • New Zealand
      • By Product Type
      • By Application
      • By End Use
    • Market Attractiveness Analysis
      • By Country
      • By Product Type
      • By Application
      • By End Use
    • Key Takeaways
  15. MEA Market Analysis 2020 to 2024 and Forecast 2025 to 2035, By Country
    • Historical Market Size Value (USD Million) & Volume (Units) Trend Analysis By Market Taxonomy, 2020 to 2024
    • Market Size Value (USD Million) & Volume (Units) Forecast By Market Taxonomy, 2025 to 2035
      • By Country
        • GCC
        • Rest of MEA
      • By Product Type
      • By Application
      • By End Use
    • Market Attractiveness Analysis
      • By Country
      • By Product Type
      • By Application
      • By End Use
    • Key Takeaways
  16. Key Countries Market Analysis
    • USA
      • Pricing Analysis
      • Market Share Analysis, 2024
        • By Product Type
        • By Application
        • By End Use
    • Canada
      • Pricing Analysis
      • Market Share Analysis, 2024
        • By Product Type
        • By Application
        • By End Use
    • Brazil
      • Pricing Analysis
      • Market Share Analysis, 2024
        • By Product Type
        • By Application
        • By End Use
    • Mexico
      • Pricing Analysis
      • Market Share Analysis, 2024
        • By Product Type
        • By Application
        • By End Use
    • Argentina
      • Pricing Analysis
      • Market Share Analysis, 2024
        • By Product Type
        • By Application
        • By End Use
  17. Market Structure Analysis
    • Competition Dashboard
    • Competition Benchmarking
    • Market Share Analysis of Top Players
      • By Regional
      • By Product Type
      • By Application
      • By End Use
  18. Competition Analysis
    • Competition Deep Dive
      • Amcor plc
        • Overview
        • Product Portfolio
        • Profitability by Market Segments (Product/Age /Sales Channel/Region)
        • Sales Footprint
        • Strategy Overview
          • Marketing Strategy
          • Product Strategy
          • Channel Strategy
      • Berry Global Inc.
        • Overview
        • Product Portfolio
        • Profitability by Market Segments (Product/Age /Sales Channel/Region)
        • Sales Footprint
        • Strategy Overview
          • Marketing Strategy
          • Product Strategy
          • Channel Strategy
      • Sonoco Products Company
        • Overview
        • Product Portfolio
        • Profitability by Market Segments (Product/Age /Sales Channel/Region)
        • Sales Footprint
        • Strategy Overview
          • Marketing Strategy
          • Product Strategy
          • Channel Strategy
      • Silgan Holdings Inc.
        • Overview
        • Product Portfolio
        • Profitability by Market Segments (Product/Age /Sales Channel/Region)
        • Sales Footprint
        • Strategy Overview
          • Marketing Strategy
          • Product Strategy
          • Channel Strategy
      • Rieke Packaging Systems
        • Overview
        • Product Portfolio
        • Profitability by Market Segments (Product/Age /Sales Channel/Region)
        • Sales Footprint
        • Strategy Overview
          • Marketing Strategy
          • Product Strategy
          • Channel Strategy
      • WestRock Company
        • Overview
        • Product Portfolio
        • Profitability by Market Segments (Product/Age /Sales Channel/Region)
        • Sales Footprint
        • Strategy Overview
          • Marketing Strategy
          • Product Strategy
          • Channel Strategy
      • Mondi Group
        • Overview
        • Product Portfolio
        • Profitability by Market Segments (Product/Age /Sales Channel/Region)
        • Sales Footprint
        • Strategy Overview
          • Marketing Strategy
          • Product Strategy
          • Channel Strategy
  19. Assumptions & Acronyms Used
  20. Research Methodology

List of Tables

  • Table 1: Global Market Value (USD Million) Forecast by Region, 2020-2035
  • Table 2: Global Market Volume (Units) Forecast by Region, 2020-2035
  • Table 3: Global Market Value (USD Million) Forecast by Product Type, 2020-2035
  • Table 4: Global Market Volume (Units) Forecast by Product Type, 2020-2035
  • Table 5: Global Market Value (USD Million) Forecast by Application, 2020-2035
  • Table 6: Global Market Volume (Units) Forecast by Application, 2020-2035
  • Table 7: Global Market Value (USD Million) Forecast by End Use, 2020-2035
  • Table 8: Global Market Volume (Units) Forecast by End Use, 2020-2035
  • Table 9: North America Market Value (USD Million) Forecast by Country, 2020-2035
  • Table 10: North America Market Volume (Units) Forecast by Country, 2020-2035
  • Table 11: North America Market Value (USD Million) Forecast by Product Type, 2020-2035
  • Table 12: North America Market Volume (Units) Forecast by Product Type, 2020-2035
  • Table 13: North America Market Value (USD Million) Forecast by Application, 2020-2035
  • Table 14: North America Market Volume (Units) Forecast by Application, 2020-2035
  • Table 15: North America Market Value (USD Million) Forecast by End Use, 2020-2035
  • Table 16: North America Market Volume (Units) Forecast by End Use, 2020-2035
  • Table 17: Latin America Market Value (USD Million) Forecast by Country, 2020-2035
  • Table 18: Latin America Market Volume (Units) Forecast by Country, 2020-2035
  • Table 19: Latin America Market Value (USD Million) Forecast by Product Type, 2020-2035
  • Table 20: Latin America Market Volume (Units) Forecast by Product Type, 2020-2035
  • Table 21: Latin America Market Value (USD Million) Forecast by Application, 2020-2035
  • Table 22: Latin America Market Volume (Units) Forecast by Application, 2020-2035
  • Table 23: Latin America Market Value (USD Million) Forecast by End Use, 2020-2035
  • Table 24: Latin America Market Volume (Units) Forecast by End Use, 2020-2035
  • Table 25: Europe Market Value (USD Million) Forecast by Country, 2020-2035
  • Table 26: Europe Market Volume (Units) Forecast by Country, 2020-2035
  • Table 27: Europe Market Value (USD Million) Forecast by Product Type, 2020-2035
  • Table 28: Europe Market Volume (Units) Forecast by Product Type, 2020-2035
  • Table 29: Europe Market Value (USD Million) Forecast by Application, 2020-2035
  • Table 30: Europe Market Volume (Units) Forecast by Application, 2020-2035
  • Table 31: Europe Market Value (USD Million) Forecast by End Use, 2020-2035
  • Table 32: Europe Market Volume (Units) Forecast by End Use, 2020-2035
  • Table 33: East Asia Market Value (USD Million) Forecast by Country, 2020-2035
  • Table 34: East Asia Market Volume (Units) Forecast by Country, 2020-2035
  • Table 35: East Asia Market Value (USD Million) Forecast by Product Type, 2020-2035
  • Table 36: East Asia Market Volume (Units) Forecast by Product Type, 2020-2035
  • Table 37: East Asia Market Value (USD Million) Forecast by Application, 2020-2035
  • Table 38: East Asia Market Volume (Units) Forecast by Application, 2020-2035
  • Table 39: East Asia Market Value (USD Million) Forecast by End Use, 2020-2035
  • Table 40: East Asia Market Volume (Units) Forecast by End Use, 2020-2035
  • Table 41: South Asia Market Value (USD Million) Forecast by Country, 2020-2035
  • Table 42: South Asia Market Volume (Units) Forecast by Country, 2020-2035
  • Table 43: South Asia Market Value (USD Million) Forecast by Product Type, 2020-2035
  • Table 44: South Asia Market Volume (Units) Forecast by Product Type, 2020-2035
  • Table 45: South Asia Market Value (USD Million) Forecast by Application, 2020-2035
  • Table 46: South Asia Market Volume (Units) Forecast by Application, 2020-2035
  • Table 47: South Asia Market Value (USD Million) Forecast by End Use, 2020-2035
  • Table 48: South Asia Market Volume (Units) Forecast by End Use, 2020-2035
  • Table 49: Oceania Market Value (USD Million) Forecast by Country, 2020-2035
  • Table 50: Oceania Market Volume (Units) Forecast by Country, 2020-2035
  • Table 51: Oceania Market Value (USD Million) Forecast by Product Type, 2020-2035
  • Table 52: Oceania Market Volume (Units) Forecast by Product Type, 2020-2035
  • Table 53: Oceania Market Value (USD Million) Forecast by Application, 2020-2035
  • Table 54: Oceania Market Volume (Units) Forecast by Application, 2020-2035
  • Table 55: Oceania Market Value (USD Million) Forecast by End Use, 2020-2035
  • Table 56: Oceania Market Volume (Units) Forecast by End Use, 2020-2035
  • Table 57: MEA Market Value (USD Million) Forecast by Country, 2020-2035
  • Table 58: MEA Market Volume (Units) Forecast by Country, 2020-2035
  • Table 59: MEA Market Value (USD Million) Forecast by Product Type, 2020-2035
  • Table 60: MEA Market Volume (Units) Forecast by Product Type, 2020-2035
  • Table 61: MEA Market Value (USD Million) Forecast by Application, 2020-2035
  • Table 62: MEA Market Volume (Units) Forecast by Application, 2020-2035
  • Table 63: MEA Market Value (USD Million) Forecast by End Use, 2020-2035
  • Table 64: MEA Market Volume (Units) Forecast by End Use, 2020-2035

List of Figures

  • Figure 1: Global Market Value (USD Million) by Product Type, 2025-2035
  • Figure 2: Global Market Value (USD Million) by Application, 2025-2035
  • Figure 3: Global Market Value (USD Million) by End Use, 2025-2035
  • Figure 4: Global Market Value (USD Million) by Region, 2025-2035
  • Figure 5: Global Market Value (USD Million) Analysis by Region, 2020-2035
  • Figure 6: Global Market Volume (Units) Analysis by Region, 2020-2035
  • Figure 7: Global Market Value Share (%) and BPS Analysis by Region, 2025-2035
  • Figure 8: Global Market Y-o-Y Growth (%) Projections by Region, 2025-2035
  • Figure 9: Global Market Value (USD Million) Analysis by Product Type, 2020-2035
  • Figure 10: Global Market Volume (Units) Analysis by Product Type, 2020-2035
  • Figure 11: Global Market Value Share (%) and BPS Analysis by Product Type, 2025-2035
  • Figure 12: Global Market Y-o-Y Growth (%) Projections by Product Type, 2025-2035
  • Figure 13: Global Market Value (USD Million) Analysis by Application, 2020-2035
  • Figure 14: Global Market Volume (Units) Analysis by Application, 2020-2035
  • Figure 15: Global Market Value Share (%) and BPS Analysis by Application, 2025-2035
  • Figure 16: Global Market Y-o-Y Growth (%) Projections by Application, 2025-2035
  • Figure 17: Global Market Value (USD Million) Analysis by End Use, 2020-2035
  • Figure 18: Global Market Volume (Units) Analysis by End Use, 2020-2035
  • Figure 19: Global Market Value Share (%) and BPS Analysis by End Use, 2025-2035
  • Figure 20: Global Market Y-o-Y Growth (%) Projections by End Use, 2025-2035
  • Figure 21: Global Market Attractiveness by Product Type, 2025-2035
  • Figure 22: Global Market Attractiveness by Application, 2025-2035
  • Figure 23: Global Market Attractiveness by End Use, 2025-2035
  • Figure 24: Global Market Attractiveness by Region, 2025-2035
  • Figure 25: North America Market Value (USD Million) by Product Type, 2025-2035
  • Figure 26: North America Market Value (USD Million) by Application, 2025-2035
  • Figure 27: North America Market Value (USD Million) by End Use, 2025-2035
  • Figure 28: North America Market Value (USD Million) by Country, 2025-2035
  • Figure 29: North America Market Value (USD Million) Analysis by Country, 2020-2035
  • Figure 30: North America Market Volume (Units) Analysis by Country, 2020-2035
  • Figure 31: North America Market Value Share (%) and BPS Analysis by Country, 2025-2035
  • Figure 32: North America Market Y-o-Y Growth (%) Projections by Country, 2025-2035
  • Figure 33: North America Market Value (USD Million) Analysis by Product Type, 2020-2035
  • Figure 34: North America Market Volume (Units) Analysis by Product Type, 2020-2035
  • Figure 35: North America Market Value Share (%) and BPS Analysis by Product Type, 2025-2035
  • Figure 36: North America Market Y-o-Y Growth (%) Projections by Product Type, 2025-2035
  • Figure 37: North America Market Value (USD Million) Analysis by Application, 2020-2035
  • Figure 38: North America Market Volume (Units) Analysis by Application, 2020-2035
  • Figure 39: North America Market Value Share (%) and BPS Analysis by Application, 2025-2035
  • Figure 40: North America Market Y-o-Y Growth (%) Projections by Application, 2025-2035
  • Figure 41: North America Market Value (USD Million) Analysis by End Use, 2020-2035
  • Figure 42: North America Market Volume (Units) Analysis by End Use, 2020-2035
  • Figure 43: North America Market Value Share (%) and BPS Analysis by End Use, 2025-2035
  • Figure 44: North America Market Y-o-Y Growth (%) Projections by End Use, 2025-2035
  • Figure 45: North America Market Attractiveness by Product Type, 2025-2035
  • Figure 46: North America Market Attractiveness by Application, 2025-2035
  • Figure 47: North America Market Attractiveness by End Use, 2025-2035
  • Figure 48: North America Market Attractiveness by Country, 2025-2035
  • Figure 49: Latin America Market Value (USD Million) by Product Type, 2025-2035
  • Figure 50: Latin America Market Value (USD Million) by Application, 2025-2035
  • Figure 51: Latin America Market Value (USD Million) by End Use, 2025-2035
  • Figure 52: Latin America Market Value (USD Million) by Country, 2025-2035
  • Figure 53: Latin America Market Value (USD Million) Analysis by Country, 2020-2035
  • Figure 54: Latin America Market Volume (Units) Analysis by Country, 2020-2035
  • Figure 55: Latin America Market Value Share (%) and BPS Analysis by Country, 2025-2035
  • Figure 56: Latin America Market Y-o-Y Growth (%) Projections by Country, 2025-2035
  • Figure 57: Latin America Market Value (USD Million) Analysis by Product Type, 2020-2035
  • Figure 58: Latin America Market Volume (Units) Analysis by Product Type, 2020-2035
  • Figure 59: Latin America Market Value Share (%) and BPS Analysis by Product Type, 2025-2035
  • Figure 60: Latin America Market Y-o-Y Growth (%) Projections by Product Type, 2025-2035
  • Figure 61: Latin America Market Value (USD Million) Analysis by Application, 2020-2035
  • Figure 62: Latin America Market Volume (Units) Analysis by Application, 2020-2035
  • Figure 63: Latin America Market Value Share (%) and BPS Analysis by Application, 2025-2035
  • Figure 64: Latin America Market Y-o-Y Growth (%) Projections by Application, 2025-2035
  • Figure 65: Latin America Market Value (USD Million) Analysis by End Use, 2020-2035
  • Figure 66: Latin America Market Volume (Units) Analysis by End Use, 2020-2035
  • Figure 67: Latin America Market Value Share (%) and BPS Analysis by End Use, 2025-2035
  • Figure 68: Latin America Market Y-o-Y Growth (%) Projections by End Use, 2025-2035
  • Figure 69: Latin America Market Attractiveness by Product Type, 2025-2035
  • Figure 70: Latin America Market Attractiveness by Application, 2025-2035
  • Figure 71: Latin America Market Attractiveness by End Use, 2025-2035
  • Figure 72: Latin America Market Attractiveness by Country, 2025-2035
  • Figure 73: Europe Market Value (USD Million) by Product Type, 2025-2035
  • Figure 74: Europe Market Value (USD Million) by Application, 2025-2035
  • Figure 75: Europe Market Value (USD Million) by End Use, 2025-2035
  • Figure 76: Europe Market Value (USD Million) by Country, 2025-2035
  • Figure 77: Europe Market Value (USD Million) Analysis by Country, 2020-2035
  • Figure 78: Europe Market Volume (Units) Analysis by Country, 2020-2035
  • Figure 79: Europe Market Value Share (%) and BPS Analysis by Country, 2025-2035
  • Figure 80: Europe Market Y-o-Y Growth (%) Projections by Country, 2025-2035
  • Figure 81: Europe Market Value (USD Million) Analysis by Product Type, 2020-2035
  • Figure 82: Europe Market Volume (Units) Analysis by Product Type, 2020-2035
  • Figure 83: Europe Market Value Share (%) and BPS Analysis by Product Type, 2025-2035
  • Figure 84: Europe Market Y-o-Y Growth (%) Projections by Product Type, 2025-2035
  • Figure 85: Europe Market Value (USD Million) Analysis by Application, 2020-2035
  • Figure 86: Europe Market Volume (Units) Analysis by Application, 2020-2035
  • Figure 87: Europe Market Value Share (%) and BPS Analysis by Application, 2025-2035
  • Figure 88: Europe Market Y-o-Y Growth (%) Projections by Application, 2025-2035
  • Figure 89: Europe Market Value (USD Million) Analysis by End Use, 2020-2035
  • Figure 90: Europe Market Volume (Units) Analysis by End Use, 2020-2035
  • Figure 91: Europe Market Value Share (%) and BPS Analysis by End Use, 2025-2035
  • Figure 92: Europe Market Y-o-Y Growth (%) Projections by End Use, 2025-2035
  • Figure 93: Europe Market Attractiveness by Product Type, 2025-2035
  • Figure 94: Europe Market Attractiveness by Application, 2025-2035
  • Figure 95: Europe Market Attractiveness by End Use, 2025-2035
  • Figure 96: Europe Market Attractiveness by Country, 2025-2035
  • Figure 97: East Asia Market Value (USD Million) by Product Type, 2025-2035
  • Figure 98: East Asia Market Value (USD Million) by Application, 2025-2035
  • Figure 99: East Asia Market Value (USD Million) by End Use, 2025-2035
  • Figure 100: East Asia Market Value (USD Million) by Country, 2025-2035
  • Figure 101: East Asia Market Value (USD Million) Analysis by Country, 2020-2035
  • Figure 102: East Asia Market Volume (Units) Analysis by Country, 2020-2035
  • Figure 103: East Asia Market Value Share (%) and BPS Analysis by Country, 2025-2035
  • Figure 104: East Asia Market Y-o-Y Growth (%) Projections by Country, 2025-2035
  • Figure 105: East Asia Market Value (USD Million) Analysis by Product Type, 2020-2035
  • Figure 106: East Asia Market Volume (Units) Analysis by Product Type, 2020-2035
  • Figure 107: East Asia Market Value Share (%) and BPS Analysis by Product Type, 2025-2035
  • Figure 108: East Asia Market Y-o-Y Growth (%) Projections by Product Type, 2025-2035
  • Figure 109: East Asia Market Value (USD Million) Analysis by Application, 2020-2035
  • Figure 110: East Asia Market Volume (Units) Analysis by Application, 2020-2035
  • Figure 111: East Asia Market Value Share (%) and BPS Analysis by Application, 2025-2035
  • Figure 112: East Asia Market Y-o-Y Growth (%) Projections by Application, 2025-2035
  • Figure 113: East Asia Market Value (USD Million) Analysis by End Use, 2020-2035
  • Figure 114: East Asia Market Volume (Units) Analysis by End Use, 2020-2035
  • Figure 115: East Asia Market Value Share (%) and BPS Analysis by End Use, 2025-2035
  • Figure 116: East Asia Market Y-o-Y Growth (%) Projections by End Use, 2025-2035
  • Figure 117: East Asia Market Attractiveness by Product Type, 2025-2035
  • Figure 118: East Asia Market Attractiveness by Application, 2025-2035
  • Figure 119: East Asia Market Attractiveness by End Use, 2025-2035
  • Figure 120: East Asia Market Attractiveness by Country, 2025-2035
  • Figure 121: South Asia Market Value (USD Million) by Product Type, 2025-2035
  • Figure 122: South Asia Market Value (USD Million) by Application, 2025-2035
  • Figure 123: South Asia Market Value (USD Million) by End Use, 2025-2035
  • Figure 124: South Asia Market Value (USD Million) by Country, 2025-2035
  • Figure 125: South Asia Market Value (USD Million) Analysis by Country, 2020-2035
  • Figure 126: South Asia Market Volume (Units) Analysis by Country, 2020-2035
  • Figure 127: South Asia Market Value Share (%) and BPS Analysis by Country, 2025-2035
  • Figure 128: South Asia Market Y-o-Y Growth (%) Projections by Country, 2025-2035
  • Figure 129: South Asia Market Value (USD Million) Analysis by Product Type, 2020-2035
  • Figure 130: South Asia Market Volume (Units) Analysis by Product Type, 2020-2035
  • Figure 131: South Asia Market Value Share (%) and BPS Analysis by Product Type, 2025-2035
  • Figure 132: South Asia Market Y-o-Y Growth (%) Projections by Product Type, 2025-2035
  • Figure 133: South Asia Market Value (USD Million) Analysis by Application, 2020-2035
  • Figure 134: South Asia Market Volume (Units) Analysis by Application, 2020-2035
  • Figure 135: South Asia Market Value Share (%) and BPS Analysis by Application, 2025-2035
  • Figure 136: South Asia Market Y-o-Y Growth (%) Projections by Application, 2025-2035
  • Figure 137: South Asia Market Value (USD Million) Analysis by End Use, 2020-2035
  • Figure 138: South Asia Market Volume (Units) Analysis by End Use, 2020-2035
  • Figure 139: South Asia Market Value Share (%) and BPS Analysis by End Use, 2025-2035
  • Figure 140: South Asia Market Y-o-Y Growth (%) Projections by End Use, 2025-2035
  • Figure 141: South Asia Market Attractiveness by Product Type, 2025-2035
  • Figure 142: South Asia Market Attractiveness by Application, 2025-2035
  • Figure 143: South Asia Market Attractiveness by End Use, 2025-2035
  • Figure 144: South Asia Market Attractiveness by Country, 2025-2035
  • Figure 145: Oceania Market Value (USD Million) by Product Type, 2025-2035
  • Figure 146: Oceania Market Value (USD Million) by Application, 2025-2035
  • Figure 147: Oceania Market Value (USD Million) by End Use, 2025-2035
  • Figure 148: Oceania Market Value (USD Million) by Country, 2025-2035
  • Figure 149: Oceania Market Value (USD Million) Analysis by Country, 2020-2035
  • Figure 150: Oceania Market Volume (Units) Analysis by Country, 2020-2035
  • Figure 151: Oceania Market Value Share (%) and BPS Analysis by Country, 2025-2035
  • Figure 152: Oceania Market Y-o-Y Growth (%) Projections by Country, 2025-2035
  • Figure 153: Oceania Market Value (USD Million) Analysis by Product Type, 2020-2035
  • Figure 154: Oceania Market Volume (Units) Analysis by Product Type, 2020-2035
  • Figure 155: Oceania Market Value Share (%) and BPS Analysis by Product Type, 2025-2035
  • Figure 156: Oceania Market Y-o-Y Growth (%) Projections by Product Type, 2025-2035
  • Figure 157: Oceania Market Value (USD Million) Analysis by Application, 2020-2035
  • Figure 158: Oceania Market Volume (Units) Analysis by Application, 2020-2035
  • Figure 159: Oceania Market Value Share (%) and BPS Analysis by Application, 2025-2035
  • Figure 160: Oceania Market Y-o-Y Growth (%) Projections by Application, 2025-2035
  • Figure 161: Oceania Market Value (USD Million) Analysis by End Use, 2020-2035
  • Figure 162: Oceania Market Volume (Units) Analysis by End Use, 2020-2035
  • Figure 163: Oceania Market Value Share (%) and BPS Analysis by End Use, 2025-2035
  • Figure 164: Oceania Market Y-o-Y Growth (%) Projections by End Use, 2025-2035
  • Figure 165: Oceania Market Attractiveness by Product Type, 2025-2035
  • Figure 166: Oceania Market Attractiveness by Application, 2025-2035
  • Figure 167: Oceania Market Attractiveness by End Use, 2025-2035
  • Figure 168: Oceania Market Attractiveness by Country, 2025-2035
  • Figure 169: MEA Market Value (USD Million) by Product Type, 2025-2035
  • Figure 170: MEA Market Value (USD Million) by Application, 2025-2035
  • Figure 171: MEA Market Value (USD Million) by End Use, 2025-2035
  • Figure 172: MEA Market Value (USD Million) by Country, 2025-2035
  • Figure 173: MEA Market Value (USD Million) Analysis by Country, 2020-2035
  • Figure 174: MEA Market Volume (Units) Analysis by Country, 2020-2035
  • Figure 175: MEA Market Value Share (%) and BPS Analysis by Country, 2025-2035
  • Figure 176: MEA Market Y-o-Y Growth (%) Projections by Country, 2025-2035
  • Figure 177: MEA Market Value (USD Million) Analysis by Product Type, 2020-2035
  • Figure 178: MEA Market Volume (Units) Analysis by Product Type, 2020-2035
  • Figure 179: MEA Market Value Share (%) and BPS Analysis by Product Type, 2025-2035
  • Figure 180: MEA Market Y-o-Y Growth (%) Projections by Product Type, 2025-2035
  • Figure 181: MEA Market Value (USD Million) Analysis by Application, 2020-2035
  • Figure 182: MEA Market Volume (Units) Analysis by Application, 2020-2035
  • Figure 183: MEA Market Value Share (%) and BPS Analysis by Application, 2025-2035
  • Figure 184: MEA Market Y-o-Y Growth (%) Projections by Application, 2025-2035
  • Figure 185: MEA Market Value (USD Million) Analysis by End Use, 2020-2035
  • Figure 186: MEA Market Volume (Units) Analysis by End Use, 2020-2035
  • Figure 187: MEA Market Value Share (%) and BPS Analysis by End Use, 2025-2035
  • Figure 188: MEA Market Y-o-Y Growth (%) Projections by End Use, 2025-2035
  • Figure 189: MEA Market Attractiveness by Product Type, 2025-2035
  • Figure 190: MEA Market Attractiveness by Application, 2025-2035
  • Figure 191: MEA Market Attractiveness by End Use, 2025-2035
  • Figure 192: MEA Market Attractiveness by Country, 2025-2035

Frequently Asked Questions

What was the overall size of the senior friendly packaging market in 2025?

The overall market size for senior friendly packaging market was USD 5.2 billion in 2025.

How big the senior friendly packaging market is expected in 2035?

The senior friendly packaging market expected to reach USD 8.7 billion in 2035.

What will drive the demand for senior friendly packaging market during the forecast period?

The demand for senior-friendly packaging will be driven by the growing aging population and the increasing need for convenient, accessible packaging solutions. Regulatory guidelines and consumer preferences for health and safety will further fuel market growth.

List the top 5 countries contributing senior friendly packaging market?

The top 5 countries which drives the development of senior friendly packaging market are USA, UK, Europe Union, Japan and South Korea.

Which segment in type is expected to senior friendly packaging market?

Medicinal tablets, pills, and syrups driving market growth to command significant share over the assessment period.

Explore Similar Insights

Future Market Insights

Senior Friendly Packaging Market

Chat With

MaRIA

Hi There, I am MaRIA, Your Market Research Intelligence Assistant. How may I help you?