

- Market Size (2026)
- USD 202.1 Mn
- Forecast (2036)
- USD 256.7 Mn
- CAGR (2026 to 2036)
- 2.4%
How big is the Sertraline HCl Market?
The Sertraline HCl Market is projected to grow from USD 202.1 million in 2026 to USD 256.7 million by 2036, at a CAGR of 2.4%.
The Sertraline HCl Market was valued at USD 197.3 million in 2025 and is expected to reach USD 202.1 million in 2026. The market is forecast to reach USD 256.7 million by 2036 at a CAGR of 2.4% from 2026 to 2036. Powder is projected to account for a 62.0% share by form in 2026. The ≥99.5% purity grade is estimated to represent a 57.0% share in 2026.
France’s medicines agency reported sertraline 25 mg and 50 mg supply pressure in 2025 before noting gradual recovery across the supply chain.
FDA listed Zenara Pharma’s sertraline hydrochloride capsule as a first generic approval in July 2025, which shows how formulation changes can create new API qualification work.
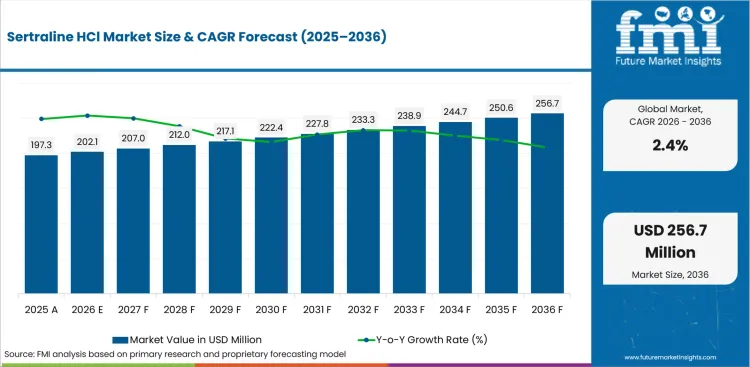
| Metric | Value |
|---|---|
| 2025 Market Size | USD 197.3 million |
| 2026 Market Size | USD 202.1 million |
| 2036 Market Size | USD 256.7 million |
| Forecast CAGR (2026-2036) | 2.4% |
| Leading Form | Powder |
| Powder Share (2026) | 62.0% |
| Leading Purity Grade | ≥99.5% |
| ≥99.5% Share (2026) | 57.0% |
| Fastest-growing Country | India |
| India CAGR by 2036 | 3.3% |
Summary of the Sertraline HCl Market
| Market Signal | Commercial Impact |
|---|---|
| Demand and Growth Drivers | Demand for Sertraline HCl API remains stable as pharmaceutical manufacturers continue supplying generic antidepressant formulations while strengthening regulatory compliance and supply-chain resilience.
|
| Product and Segment View | High-purity powder APIs and major depressive disorder applications continue to represent the leading commercial opportunities across the market.
|
| Geography and Growth Outlook | Asia continues to dominate manufacturing growth while regulated pharmaceutical markets maintain stable API demand through generic drug production.
|
| Competitive Landscape | Competition increasingly focuses on regulatory compliance, manufacturing quality, supply reliability, and documentation support.
|
| Analyst Perspective | Sertraline HCl API continues to evolve as a quality-driven generic pharmaceutical market where regulatory compliance and dependable supply remain more important than pricing alone.
- Anurag Sharma, Principal Consultant at Future Market Insights |
Why is the Sertraline HCl Market growing?
Sertraline stays widely used across depression and anxiety care as labels support multiple psychiatric indications. Generic formulation demand sustains API orders as tablets, capsules, and oral concentrates need qualified input supply.
- Sertraline stays widely used across depression and anxiety care as labels support multiple psychiatric indications.
- Generic formulation demand sustains API orders as tablets, capsules, and oral concentrates need qualified input supply.
- Regulatory pressure favors documented suppliers since impurity control and post-approval change handling affect buyers.
Major depressive disorder remains the primary demand anchor for sertraline HCl API across regulated markets. CDC’s April 2025 data brief reported prescription medication use for depression among USA adults based on 2023 survey data. This supports API demand by confirming a large treated population that depends on ongoing antidepressant access. Suppliers benefit when formulators maintain repeat production for established SSRI products. The practical result is a low-volatility market with modest growth, where supplier reliability shapes order retention more than product novelty. Supply assurance is becoming a stronger commercial filter for sertraline HCl buyers after recent psychotropic medicine shortages.
How is the Sertraline HCl Market segmented?
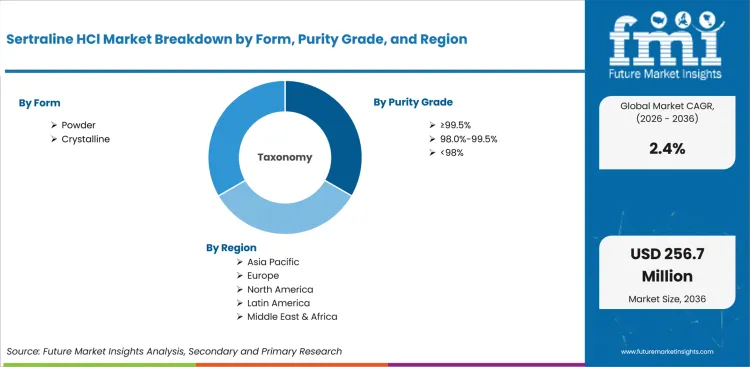
The Sertraline HCl Market is segmented by form, purity grade, application, sales channel, and region.
- Powder is projected to account for a 62.0% share by form in 2026 as formulators favor easier blending and granulation behavior.
- With an estimated 57.0% share in 2026, ≥99.5% purity grade is expected to lead the purity-grade category because stricter impurity review.
- Major Depressive Disorder applications are anticipated to represent a 43.0% share in 2026 with broad adult treatment use.
How does Powder contribute to the form category?
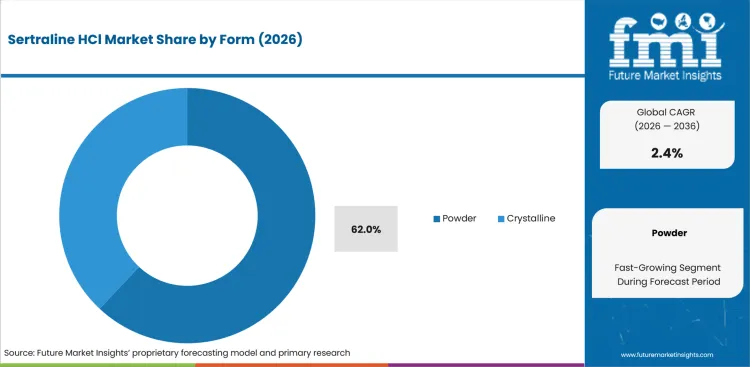
- Powder is projected to account for a 62.0% share in 2026 as oral solid dose manufacturers need blend uniformity across 25 mg, 50 mg, and 100 mg strengths.
- Powder buyers often request particle-size consistency before large supply awards since tablet compression and dissolution behavior can change after a source transfer.
What supports demand for ≥99.5%?
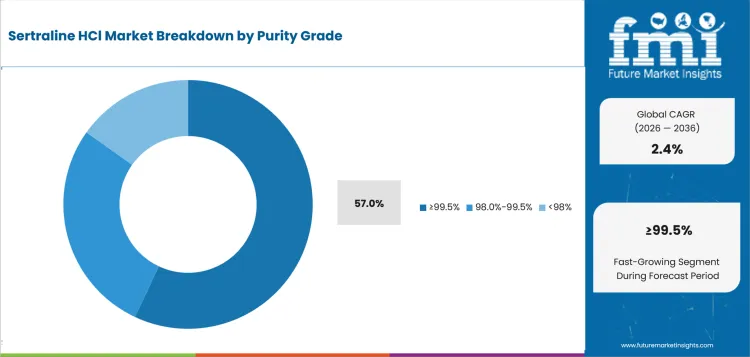
- The ≥99.5% grade is expected to represent a 57.0% share in 2026 as regulated buyers prioritize impurity limits and smoother dossier review.
- FDA’s September 2024 nitrosamine guidance keeps impurity risk visible for API sourcing teams, even when sertraline itself is not under a new approval cycle.
How do buyers evaluate Major Depressive Disorder within the application category?
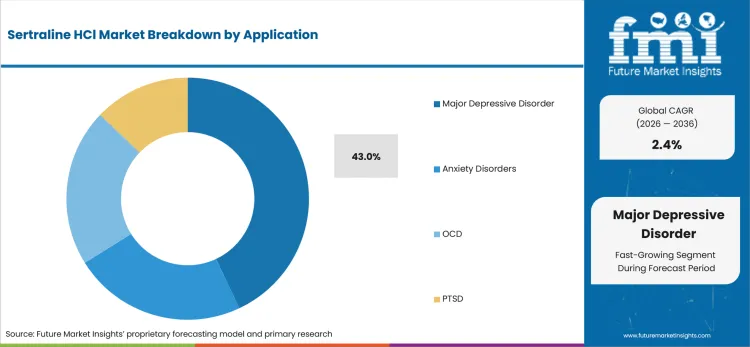
- Major Depressive Disorder is anticipated to account for a 43.0% share in 2026 as adult depression treatment remains the broadest label-supported use.
- Application demand is sticky because MDD therapy often involves repeat prescriptions, which gives formulation buyers a reason to protect API continuity.
What market factors influence demand for Direct?
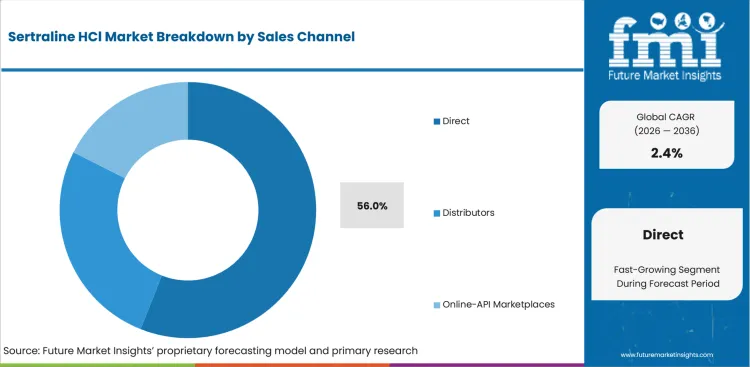
- Direct sales are projected to account for a 56.0% share in 2026 as regulated customers prefer supplier audits and direct technical file access.
- Distributor use stays relevant for smaller buyers, but direct contracts dominate when customers need change notifications and batch documentation.
How does North America affect the regional outlook?
- North America is expected to represent a 34.0% share in 2026 as generic approvals and broad pharmacy coverage support repeat API demand.
- FDA listed Zenara Pharma’s sertraline hydrochloride capsule as a first generic approval in July 2025, which widened capsule-linked API qualification work.
What drives and restrains the market?
Driver: Multi-indication labeling supports repeat API demand across depression, anxiety, OCD, and PTSD formulations; restraint: Shortage exposure creates an opportunity for suppliers that can prove backup capacity and stable regulatory support; opportunity: shortage exposure creates an opportunity for suppliers that can prove backup capacity and stable regulatory support.
The market reflects a balance between the identified demand driver, adoption constraints, and the supplier opportunity outlined below.
- Driver: Multi-indication labeling supports repeat API demand across depression, anxiety, OCD, and PTSD formulations.
- Restraint: Shortage exposure creates an opportunity for suppliers that can prove backup capacity and stable regulatory support.
- Opportunity: shortage exposure creates an opportunity for suppliers that can prove backup capacity and stable regulatory support.
Multi-Indication API Pull Sertraline HCl demand is supported by its use across several psychiatric conditions rather than one narrow label. The USA DailyMed label for Zoloft lists MDD, OCD, panic disorder, PTSD, social anxiety disorder, and PMDD indications in the prescribing information. This breadth creates repeat API demand across several finished dosage portfolios. Formulators value sertraline because one qualified API source can support several product presentations. The implication is stable demand, but suppliers must keep documentation ready for different label and market requirements.
This type of shortage does not always create higher long-term volume. It changes how buyers qualify sources and how much backup supply they want. API manufacturers with second-site options and fast documentation support gain leverage when formulation customers revisit risk plans. Impurity File Discipline: Quality oversight is a central restraint and a competitive opening in sertraline HCl. FDA’s final nitrosamine guidance in September 2024 kept impurity control high on the agenda for human drug manufacturers. This affects API buyers by forcing more detailed questions on route chemistry, solvent management, and change control. Smaller suppliers can lose bids if they cannot support these questions quickly.
Which factors support expansion?
Commercial expansion is reinforced by the value, workflow, and recurring-demand factors below.
- Value is rising as generic antidepressant producers qualify stable API sources for oral tablets and newer capsule formats.
- Mature pricing keeps CAGR at 2.42% because sertraline is established and competition limits price expansion.
- The USD 54.64 million incremental opportunity will concentrate around audited suppliers with strong impurity control records.
Which country markets are included in the CAGR comparison?
The selected CAGR comparison covers India (3.3%), China (2.9%), South Korea (2.6%), France (2.3%), and United Kingdom (2.2%) through 2036.
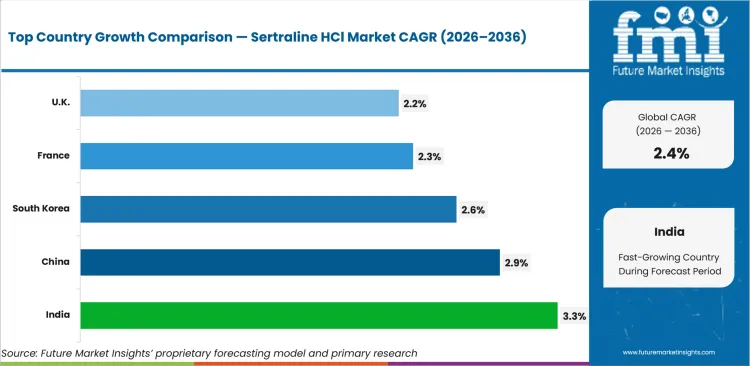
| Country | CAGR |
|---|---|
| India | 3.3% |
| China | 2.9% |
| South Korea | 2.6% |
| France | 2.3% |
| United Kingdom | 2.2% |
Source: Future Market Insights analysis.
How do country-level CAGRs compare?
- India (CAGR: 3.3%): India is projected to record a CAGR of 3.3% through 2036 due to export-ready API capacity and buyer diversification.
- China (CAGR: 2.9%): China is forecast to grow at a CAGR of 2.9% through 2036 due to manufacturing scale and domestic generic medicine demand.
- South Korea (CAGR: 2.6%): National health insurance supports access to generic mental health medicines.
- France (CAGR: 2.3%): Sertraline 25 mg and 50 mg supply tension raised API continuity attention.
- United Kingdom (CAGR: 2.2%): NHS antidepressant prescribing supports repeat finished-dose demand.
The global Sertraline HCl Market is forecast to record a CAGR of 2.42% from 2026 to 2036. The study covers 30+ countries across the report regions.
How is the Sertraline HCl Market developing in India?
India is projected to record a CAGR of 3.3% through 2036. The country outlook identifies this demand signal: CDSCO written confirmations support EU-facing API export qualification.
Country Market Snapshot
| Country | India |
|---|---|
| Forecast CAGR | 3.3% |
| Supply base | India has multiple written confirmations listing sertraline hydrochloride API. |
| Regulatory route | CDSCO written confirmations support EU-facing active substance exports. |
| Channel signal | Export customers prioritize documentation, inspection history, and pharmacopoeial compliance. |
| Application mix | Domestic and export finished-dose customers support API demand. |
| Restraint | Bulk-drug competition keeps margins under pressure. |
| Competitive context | Andhra Pradesh, Telangana, and Maharashtra suppliers support API manufacturing depth. |
| Company context | Companies active in or serving this market include Hetero Drugs, Dr. Reddy’s Laboratories, Aurobindo Pharma, RPG Life Sciences, and Viyash Scientific. |
Market Outlook
India is projected to record a CAGR of 3.3% through 2036 due to export-ready API capacity and buyer diversification. CDSCO issued a written confirmation for RPG Life Sciences in November 2025 that listed sertraline hydrochloride Ph.Eur. manufacturing and packing. This gives export buyers evidence for regulated active substance sourcing. India’s advantage is notable when suppliers combine documentation with reliable batch release. Indian demand behaves as both a domestic and export supply story.
Key Growth Drivers
- CDSCO written confirmations support EU-facing API export qualification.
- Large bulk-drug exports keep Indian suppliers visible to global buyers.
- Domestic generic formulation capacity creates steady local API demand.
- Export customers prioritize documentation, inspection history, and pharmacopoeial compliance.
Key Restraints
- Multiple qualified suppliers keep pricing pressure high.
- Smaller suppliers may struggle with fast technical documentation requests.
- Bulk-drug competition keeps margins under pressure.
Country Market FAQs
What should C-suite teams prioritize in India?
C-suite teams should prioritize qualification requirements, procurement routes, local service coverage, and implementation economics before committing capital or supplier volume.
How should suppliers approach the India market?
Suppliers should align technical evidence, local channel support, and account-specific commercial terms with the buying process used by major customers in India.
What can weaken the business case in India?
Bulk-drug competition keeps margins under pressure. Executives should test this exposure during supplier, investment, and rollout reviews.
How is the Sertraline HCl Market developing in China?
China is projected to record a CAGR of 2.9% through 2036. The country outlook identifies this demand signal: Zhejiang and coastal manufacturing clusters support API and intermediate scale.
Country Market Snapshot
| Country | China |
|---|---|
| Forecast CAGR | 2.9% |
| Supply base | Zhejiang and Shanghai chemical clusters support API and intermediate capacity. |
| Regulatory route | NMPA oversight shapes domestic registration and manufacturing control. |
| Channel signal | Export buyers watch FDA and EU inspection history closely. |
| Application mix | Domestic psychiatric treatment demand supports finished-dose use. |
| Restraint | International compliance findings can reduce export buyer confidence. |
| Competitive context | Scale advantage is balanced by quality-system scrutiny. |
| Company context | Companies active in or serving this market include Zhejiang Huahai Pharmaceutical, Zhejiang Hisun Pharmaceutical, Jiangsu Hengrui Pharmaceuticals, CSPC Pharmaceutical, and Sinopharm. |
Market Outlook
China is forecast to grow at a CAGR of 2.9% through 2036 due to manufacturing scale and domestic generic medicine demand. Zhejiang Huahai’s official profile shows broad chemical drug, API, and finished pharmaceutical operations. This supports China’s role as a supply-side market for regulated and semi-regulated customers. Buyers still separate low-cost capacity from approved API sourcing. The China market has strong manufacturing depth, but export acceptance depends on inspection outcomes and dossier confidence.
Key Growth Drivers
- Zhejiang and coastal manufacturing clusters support API and intermediate scale.
- Domestic generic demand provides a local volume foundation.
- Export buyers continue to compare China with India for cost and capacity.
- Export buyers watch FDA and EU inspection history closely.
Key Restraints
- FDA inspection findings can weaken buyer confidence for affected sites.
- International customers require stronger evidence before approving new sources.
- International compliance findings can reduce export buyer confidence.
Country Market FAQs
What should C-suite teams prioritize in China?
C-suite teams should prioritize qualification requirements, procurement routes, local service coverage, and implementation economics before committing capital or supplier volume.
How should suppliers approach the China market?
Suppliers should align technical evidence, local channel support, and account-specific commercial terms with the buying process used by major customers in China.
What can weaken the business case in China?
International compliance findings can reduce export buyer confidence. Executives should test this exposure during supplier, investment, and rollout reviews.
How is the Sertraline HCl Market developing in South Korea?
South Korea is projected to record a CAGR of 2.6% through 2036. The country outlook identifies this demand signal: National health insurance supports access to generic mental health medicines.
Country Market Snapshot
| Country | South Korea |
|---|---|
| Forecast CAGR | 2.6% |
| Demand anchor | National health insurance supports access to generic mental health medicines. |
| Regulatory route | MFDS and HIRA systems shape reimbursement and drug review. |
| Channel signal | Buyers value documentation and price fit for reimbursed generics. |
| Application mix | Depression and anxiety treatment support SSRI use. |
| Restraint | Market size limits large-volume API switching. |
| Supply context | Imported API suppliers need Korea-ready documentation. |
| Company context | Companies active in or serving this market include Hanmi Pharmaceutical, Chong Kun Dang, Yuhan Corporation, Daewoong Pharmaceutical, and Celltrion Pharm. |
Market Outlook
South Korea is expected to record a CAGR of 2.6% through 2036 as mental health treatment access supports generic antidepressant demand. Health Insurance Review and Assessment Service systems make medicine use visible through reimbursement and drug utilization review. This gives buyers a structured setting for finished-dose supply. API demand depends on regulated formulation customers rather than open spot buying. South Korean buyers tend to prefer suppliers that can support local documentation and stable supply.
Key Growth Drivers
- National reimbursement supports continued access to generic antidepressants.
- Drug utilization review systems increase attention to prescription safety.
- Local formulation capability supports API qualification demand.
- National health insurance supports access to generic mental health medicines.
Key Restraints
- Smaller volume limits price leverage for standalone API suppliers.
- Documentation requirements can slow onboarding of new sources.
- Market size limits large-volume API switching.
Country Market FAQs
What should C-suite teams prioritize in South Korea?
C-suite teams should prioritize qualification requirements, procurement routes, local service coverage, and implementation economics before committing capital or supplier volume.
How should suppliers approach the South Korea market?
Suppliers should align technical evidence, local channel support, and account-specific commercial terms with the buying process used by major customers in South Korea.
What can weaken the business case in South Korea?
Market size limits large-volume API switching. Executives should test this exposure during supplier, investment, and rollout reviews.
How is the Sertraline HCl Market developing in France?
France is projected to record a CAGR of 2.3% through 2036. The country outlook identifies this demand signal: Sertraline 25 mg and 50 mg supply tension raised API continuity attention.
Country Market Snapshot
| Country | France |
|---|---|
| Forecast CAGR | 2.3% |
| Demand anchor | Sertraline 25 mg and 50 mg supply tension raised API continuity attention. |
| Policy context | ANSM monitors psychotropic availability and shortage actions. |
| Channel signal | Community pharmacies felt local availability pressure during 2025. |
| Application mix | Depression and OCD use support generic prescription continuity. |
| Restraint | Shortage recovery can be uneven across local pharmacy channels. |
| Competitive context | Buyers value suppliers with backup capacity and fast documentation. |
| Company context | Companies active in or serving this market include Viatris, Teva Santé, Biogaran, Sanofi, and Arrow Génériques. |
Market Outlook
France is expected to grow at a CAGR of 2.3% through 2036 with shortage experience changing buying behavior. ANSM reported in September 2025 that sertraline 25 mg and 50 mg availability was improving nationally. This shows recovery across the chain, but it also shows why buyers care about supplier resilience. API suppliers with backup capacity gain attention when finished-dose availability becomes a public issue. French demand is not just about prescription volume.
Key Growth Drivers
- ANSM shortage monitoring increases attention to psychotropic supply continuity.
- Pharmacy-level availability pressure supports dual-source planning by formulation buyers.
- Established SSRI prescribing keeps sertraline relevant in depression treatment.
- Sertraline 25 mg and 50 mg supply tension raised API continuity attention.
Key Restraints
- Local pharmacy shortages can expose weak finished-dose allocation.
- Price-sensitive reimbursement limits rapid supplier cost pass-through.
- Shortage recovery can be uneven across local pharmacy channels.
Country Market FAQs
What should C-suite teams prioritize in France?
C-suite teams should prioritize qualification requirements, procurement routes, local service coverage, and implementation economics before committing capital or supplier volume.
How should suppliers approach the France market?
Suppliers should align technical evidence, local channel support, and account-specific commercial terms with the buying process used by major customers in France.
What can weaken the business case in France?
Shortage recovery can be uneven across local pharmacy channels. Executives should test this exposure during supplier, investment, and rollout reviews.
How is the Sertraline HCl Market developing in the United Kingdom?
The United Kingdom is projected to record a CAGR of 2.2% through 2036. The country outlook identifies this demand signal: NHS antidepressant prescribing supports repeat finished-dose demand.
Country Market Snapshot
| Country | United Kingdom |
|---|---|
| Forecast CAGR | 2.2% |
| Demand anchor | NHS antidepressant prescribing supports repeat finished-dose demand. |
| Procurement route | Community pharmacy supply connects to NHS reimbursement and Drug Tariff pricing. |
| Channel signal | Formulators and suppliers watch tender and pharmacy reimbursement pressure. |
| Application mix | NHS guidance lists sertraline for depression and mental health conditions. |
| Restraint | Low reimbursed tablet prices limit API price recovery. |
| Pricing behavior | Drug Tariff updates keep buyers focused on low-cost supply. |
| Company context | Companies active in or serving this market include Teva UK, Accord Healthcare, Viatris, Zentiva UK, and Aurobindo Pharma. |
Market Outlook
The United Kingdom is expected to grow at a CAGR of 2.2% through 2036 with stable antidepressant item volume. NHS Business Services Authority reported 92.6 million antidepressant items prescribed in England during 2024/25. That scale supports repeat API demand through finished-dose supply. The market still rewards low-cost and reliable suppliers because pharmacy reimbursement compresses margins. UK buyers typically value supply predictability over switching gains when medicine prices are already low. Sertraline demand moves through community pharmacy channels and NHS prescribing pathways.
Key Growth Drivers
- NHS prescribing volume supports repeat finished-dose production planning.
- Community pharmacy dispensing sustains predictable replenishment cycles.
- Official NHS medicine guidance keeps sertraline visible in patient care.
- Formulators and suppliers watch tender and pharmacy reimbursement pressure.
Key Restraints
- Drug Tariff pricing limits room for API price increases.
- Buyers avoid supplier switches that create avoidable variation risk.
- Low reimbursed tablet prices limit API price recovery.
Country Market FAQs
What should C-suite teams prioritize in the United Kingdom?
C-suite teams should prioritize qualification requirements, procurement routes, local service coverage, and implementation economics before committing capital or supplier volume.
How should suppliers approach the United Kingdom market?
Suppliers should align technical evidence, local channel support, and account-specific commercial terms with the buying process used by major customers in the United Kingdom.
What can weaken the business case in the United Kingdom?
Low reimbursed tablet prices limit API price recovery. Executives should test this exposure during supplier, investment, and rollout reviews.
Which companies are discussed in the Sertraline HCl Market?
The preview discusses Hetero Drugs, Dr. Reddy’s Laboratories, Aurobindo Pharma, RPG Life Sciences, and Viyash Scientific among the companies active in this market.
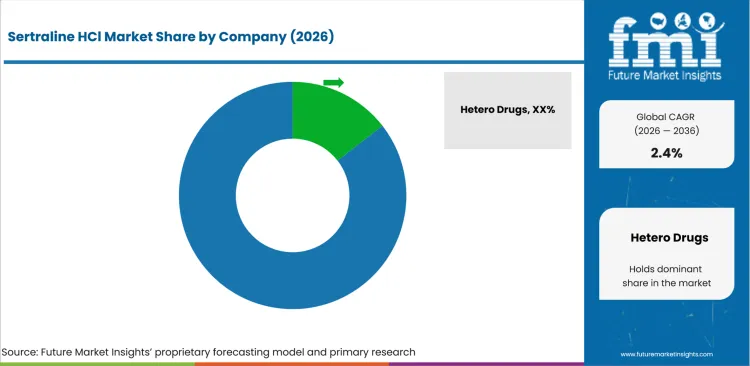
The market is moderately fragmented as several India and China suppliers can produce mature sertraline HCl API. established companies stand out with pharmacopoeial coverage, written confirmations, and long regulated-market relationships. Specialist suppliers win smaller orders by supporting documentation gaps and flexible lot sizes.
Entry barriers come from impurity control, audited manufacturing, solvent handling, and dossier support. Competitive positioning is shaped by regulatory trust more than chemistry difficulty alone. Sertraline HCl is an established small molecule API, but buyers still need confidence in route control and batch consistency.
How is competition structured?
Competition reflects differences in specialization, portfolio scope, geographic reach, evidence, and customer access.
The competitive structure is led by regulated API suppliers and formulation-linked manufacturers with documented sertraline exposure.
- Regulated API Suppliers: Hetero Drugs, Dr. Reddy’s Laboratories, Aurobindo Pharma, RPG Life Sciences, and Viyash Scientific compete through API portfolios, written confirmations, and regulated-market documentation.
- Formulation-Linked Suppliers: Lupin, Zydus Lifesciences, Aurobindo Pharma, and Zenara Pharma show finished-dose relevance through official USA labels or FDA approval records.
- China-Based Manufacturers: Zhejiang Huahai and other China-based suppliers compete through scale and synthesis experience. International buyers assess these suppliers with stronger site-level review because FDA inspection outcomes and quality-system records directly affect sourcing confidence for regulated markets.
How do selected companies compare?
The selected companies differ in portfolio focus, geographic reach, evidence depth, and channel strength.
| Company | Competitive position |
|---|---|
| Hetero Drugs | Hetero Drugs is assessed for API or finished-dose relevance, regulated-market documentation, supply reliability, and access to pharmaceutical buyers. |
| Dr. Reddy’s Laboratories | Dr. Reddy’s Laboratories is assessed for API or finished-dose relevance, regulated-market documentation, supply reliability, and access to pharmaceutical buyers. |
| Aurobindo Pharma | Aurobindo Pharma is assessed for API or finished-dose relevance, regulated-market documentation, supply reliability, and access to pharmaceutical buyers. |
| RPG Life Sciences | RPG Life Sciences is assessed for API or finished-dose relevance, regulated-market documentation, supply reliability, and access to pharmaceutical buyers. |
| Viyash Scientific | Viyash Scientific is assessed for API or finished-dose relevance, regulated-market documentation, supply reliability, and access to pharmaceutical buyers. |
What are the key developments in the Sertraline HCl Market?
- In September 2024, the USA FDA finalized guidance on nitrosamine impurity control for human drugs. The guidance increased buyer focus on route chemistry, acceptable intake limits, and supplier change control.
- In April 2025, France’s ANSM issued measures to maintain sertraline treatment continuity during supply tension. The action reinforced the commercial value of dependable API and finished-dose supply.
- In July 2025, Lupin issued a notification covering changes to its sertraline products. The update shows the continuing regulatory maintenance required for mature generic portfolios.
Selected Companies in the Sertraline HCl Market
Companies referenced in this preview
- Hetero Drugs.
- Dr. Reddy’s Laboratories.
- Aurobindo Pharma.
- RPG Life Sciences.
- Viyash Scientific.
- Teva.
- Viatris.
- Lupin.
Market Scope & Definition
| Metric | Value |
|---|---|
| Market definition | The Sertraline HCl Market covers commercially traded sertraline hydrochloride active pharmaceutical ingredient used in human prescription medicines. The scope includes powder and crystalline API supplied for major depressive disorder, anxiety disorders, OCD, and PTSD formulations. |
| Functions covered | Powder, Crystalline |
| Applications covered | Major Depressive Disorder, Anxiety Disorders, OCD, PTSD |
| End-use industries | Major Depressive Disorder, Anxiety Disorders, OCD, PTSD |
| Inclusions | Market scope covers powder and crystalline sertraline hydrochloride API across ≥99.5%, 98.0%-99.5%, and <98% purity grades. It includes direct sales, distributors, and online/API marketplaces across North America, Latin America, Europe, East Asia, South Asia & Pacific, and Middle East & Africa. |
| Exclusions | The market excludes finished sertraline tablets, finished capsules, branded Zoloft revenue, hospital dispensing margins, pharmacy retail margins, other SSRI APIs, antidepressant services, and clinical trial service fees. |
Research Methodology
| Metric | Value |
|---|---|
| Primary Research | FMI analysts reviewed inputs from API buyers, generic formulation companies, regulatory affairs teams, quality managers, and pharmaceutical sourcing specialists. Interviews focused on supplier qualification, impurity control, batch release timing, and channel selection. |
| Desk Research | reviewed regulator databases, drug labels, written confirmations, drug approval records, pharmacopoeial requirements, and official product information. The evidence pool helped define the addressable API scope and separate API revenue from finished dosage revenue. |
| Market Sizing and Forecasting | The model combined API volume, average selling prices, formulation demand, country-level sourcing behavior, and channel use rates. Forecasts were adjusted for mature generic pricing and stricter quality oversight. |
| Data Validation | Forecasts were checked against antidepressant prescribing signals, regulatory approvals, shortage reports, and verified company portfolios. Final estimates were validated through consistency checks across purity grade demand and regional sourcing patterns. |
What does the report cover?
The report covers form, purity grade, application, sales channel, and region across the 2026-2036 forecast period in 30+ countries.
| Metric | Value |
|---|---|
| Periods | Base year 2025; estimated year 2026; forecast period 2026-2036 |
| Segment axes | form, purity grade, application, sales channel, and region |
| Regions | North America, Latin America, Europe, East Asia, South Asia and Pacific, Middle East and Africa |
| Countries | United States, United Kingdom, Germany, France, Japan, China, South Korea, India and 30+ countries |
| Companies | Hetero Drugs, Dr. Reddy’s Laboratories, Aurobindo Pharma, RPG Life Sciences, Viyash Scientific, Teva, Viatris, Lupin, and others |
| Approach | Hybrid bottom-up and top-down methodology using verified product evidence, API supplier documentation, formulation demand, and country-level sourcing behavior. |
Market Segmentation Analysis
Segmented by Form
- Powder.
- Crystalline.
Segmented by Purity Grade
- ≥99.5%.
- 98.0%-99.5%.
- <98%.
Segmented by Application
- Major Depressive Disorder.
- Anxiety Disorders.
- OCD.
- PTSD.
Segmented by Sales Channel
- Direct.
- Distributors.
- Online/API Marketplaces.
By Region
- North America
- United States
- Latin America
- East Asia
- China
- Japan
- South Korea
- South Asia and Pacific
- India
- Middle East & Africa
- Western Europe
- United Kingdom
- Germany
- France
Research Sources and Bibliography
- 1. USA Food and Drug Administration. (2025). First generic drug approvals. USA Food and Drug Administration.
- 2. National Library of Medicine. (2024, February 9). Sertraline hydrochloride tablet, film coated. DailyMed.
- 3. National Library of Medicine. (2025). Sertraline hydrochloride capsule. DailyMed.
- 4. Centers for Disease Control and Prevention. (2025, April). Use of prescription medication for depression among USA adults: United States, 2023. National Center for Health Statistics.
- 5. NHS Business Services Authority. (2025, July 24). Medicines used in mental health: England 2015/16 to 2024/25. NHSBSA.
- 6. Agence nationale de sécurité du médicament et des produits de santé. (2025, April 1). Tensions d’approvisionnement en sertraline: mesures et recommandations pour assurer la continuité des traitements. ANSM.
- 7. World Health Organization. (2025, September 5). The selection and use of essential medicines, 2025. World Health Organization.
- 8. USA Food and Drug Administration. (2024, September). Control of nitrosamine impurities in human drugs. USA Food and Drug Administration.
- 9. Central Drugs Standard Control Organization. (2025, November 6). Written confirmation for active substances imported into the European Union: RPG Life Sciences. Government of India.
- 10. Central Drugs Standard Control Organization. (2026, March 17). Written confirmation for active substances imported into the European Union: Symed Labs. Government of India.
- 11. Pharmaceuticals Export Promotion Council of India. (2025). Hand book 2025. Pharmexcil.
- 12. USA Food and Drug Administration. (2025, June 17). Zhejiang Huahai Pharmaceutical Co., Ltd. warning letter. USA Food and Drug Administration.
- 13. Pharmaceuticals and Medical Devices Agency. (2024, January 10). Summary of investigation results. PMDA.
- 14. Lupin Limited. (2025, July 25). Notification for sertraline changes. Lupin.
- 15. Lupin Pharmaceuticals. (2024, March 1). Lupin product catalog. Lupin.
- 16. This bibliography is provided for reader reference and uses primary government, regulatory, official company, or official trade body publications.
The bibliography is provided for reader reference and uses primary regulatory, official company, academic, or recognized institutional sources.
This Report Answers
- What is the projected value of the Sertraline HCl Market in 2026?
- What value is forecast for the Sertraline HCl Market by 2036?
- What CAGR is forecast for the Sertraline HCl Market from 2026 to 2036?
- What 2026 share is projected for Powder within the form category?
- What 2026 share is projected for ≥99.5% within the purity grade category?
- Which demand factors support the Sertraline HCl Market outlook?
- Which restraints and opportunities affect adoption in the Sertraline HCl Market?
- How are country CAGR outlooks, including India at 3.3%, compared?
- Which companies and product developments are covered in the competitive analysis?
- What is included in the market scope, and how is the forecast validated?
Frequently Asked Questions
Why should executives track the Sertraline HCl Market?
Executives should track this market because it can affect capital allocation, supplier strategy, operating risk, and competitive positioning across commercial planning cycles.
What business problem does the Sertraline HCl Market address?
It helps executive teams judge where customer pain, supplier capability, compliance exposure, and implementation economics justify investment, procurement, or portfolio action.
What should procurement leaders evaluate before selecting suppliers?
Procurement leaders should assess evidence quality, integration fit, service coverage, compliance readiness, total cost of ownership, and supplier execution capability.
What can limit return on investment for buyers?
Return on investment can be limited by low utilization, integration delays, training gaps, unclear ownership, pricing pressure, or weak fit with existing workflows.
How can suppliers build executive confidence?
Suppliers can build confidence by proving implementation speed, risk reduction, support depth, reference use cases, and measurable outcomes for budget owners.
Preview the report firsthand - request a free sample
Get SampleGet the brochure for pricing and purchase details.
Get PDFTable of Content
- Key Takeaways
- Market Size and CAGR
- Top Growth Driver
- Fastest Growing Segment
- Leading Region
- Key Companies
- Emerging Opportunities
- Executive Summary
- Global Market Outlook
- Demand-side Trends
- Supply-side Trends
- Technology Roadmap Analysis
- Analysis and Recommendations
- Analyst Perspective (What is happening? Why now? What should investors know?)
- Key Questions Answered
- How large is the market?
- What is the CAGR?
- What are key trends?
- Which region dominates?
- Who are the leaders?
- Market Overview
- Market Coverage / Taxonomy
- Market Definition / Scope / Limitations
- Research Methodology
- Chapter Orientation
- Analytical Lens and Working Hypotheses
- Market Structure, Signals, and Trend Drivers
- Benchmarking and Cross-market Comparability
- Market Sizing, Forecasting, and Opportunity Mapping
- Research Design and Evidence Framework
- Desk Research Programme (Secondary Evidence)
- Expert Input and Fieldwork (Primary Evidence)
- Tooling, Models, and Reference Databases
- Data Engineering and Model Build
- Quality Assurance and Audit Trail
- Market Background
- Market Dynamics (Drivers, Restraints, Opportunity, Trends)
- Scenario Forecast (Optimistic, Likely, Conservative)
- Impact Analysis
- AI Impact
- Sustainability Impact
- Regulatory Impact
- Technology Impact
- Consumer / Buyer Analysis
- Purchase Drivers
- Adoption Barriers
- Buyer Journey
- Opportunity Map Analysis
- Product Life Cycle Analysis
- Supply Chain Analysis
- Investment Feasibility Matrix
- Value Chain Analysis
- PESTLE and Porter's Analysis
- Regulatory Landscape
- Regional Parent Market Outlook
- Production and Consumption Statistics
- Import and Export Statistics
- Global Market Analysis and Forecast, 2021 to 2036
- Historical Market Size Value (USD Million) & Volume (Unit) Analysis, 2021 to 2025
- Current and Future Market Size Value (USD Million) & Volume (Unit) Projections, 2026 to 2036
- Y-o-Y Growth Trend Analysis
- Absolute $ Opportunity Analysis
- Global Market Pricing Analysis, 2021 to 2036
- Global Market Analysis and Forecast, By Form, 2021 to 2036
- Introduction / Key Findings
- Historical Market Size Value (USD Million) & Volume (Unit) Analysis By Form, 2021 to 2025
- Current and Future Market Size Value (USD Million) & Volume (Unit) Analysis and Forecast By Form, 2026 to 2036
- Powder
- Crystalline
- Powder
- Y-o-Y Growth Trend Analysis By Form, 2021 to 2025
- Absolute $ Opportunity Analysis By Form, 2026 to 2036
- Global Market Analysis and Forecast, By Purity Grade, 2021 to 2036
- Introduction / Key Findings
- Historical Market Size Value (USD Million) & Volume (Unit) Analysis By Purity Grade, 2021 to 2025
- Current and Future Market Size Value (USD Million) & Volume (Unit) Analysis and Forecast By Purity Grade, 2026 to 2036
- ≥99.5%
- 98.0%-99.5%
- <98%
- ≥99.5%
- Y-o-Y Growth Trend Analysis By Purity Grade, 2021 to 2025
- Absolute $ Opportunity Analysis By Purity Grade, 2026 to 2036
- Global Market Analysis and Forecast, By Application, 2021 to 2036
- Introduction / Key Findings
- Historical Market Size Value (USD Million) & Volume (Unit) Analysis By Application, 2021 to 2025
- Current and Future Market Size Value (USD Million) & Volume (Unit) Analysis and Forecast By Application, 2026 to 2036
- Major Depressive Disorder
- Anxiety Disorders
- OCD
- PTSD
- Major Depressive Disorder
- Y-o-Y Growth Trend Analysis By Application, 2021 to 2025
- Absolute $ Opportunity Analysis By Application, 2026 to 2036
- Global Market Analysis and Forecast, By Sales Channel, 2021 to 2036
- Introduction / Key Findings
- Historical Market Size Value (USD Million) & Volume (Unit) Analysis By Sales Channel, 2021 to 2025
- Current and Future Market Size Value (USD Million) & Volume (Unit) Analysis and Forecast By Sales Channel, 2026 to 2036
- Direct
- Distributors
- Online-API Marketplaces
- Direct
- Y-o-Y Growth Trend Analysis By Sales Channel, 2021 to 2025
- Absolute $ Opportunity Analysis By Sales Channel, 2026 to 2036
- Global Market Analysis and Forecast, By Region, 2021 to 2036
- Introduction
- Historical Market Size Value (USD Million) & Volume (Unit) Analysis By Region, 2021 to 2025
- Current Market Size Value (USD Million) & Volume (Unit) Analysis and Forecast By Region, 2026 to 2036
- North America
- Latin America
- Western Europe
- Eastern Europe
- East Asia
- South Asia and Pacific
- Middle East & Africa
- Market Attractiveness Analysis By Region
- North America Market Analysis and Forecast, By Country, 2021 to 2036
- Historical Market Size Value (USD Million) & Volume (Unit) Trend Analysis By Market Taxonomy, 2021 to 2025
- Market Size Value (USD Million) & Volume (Unit) Forecast By Market Taxonomy, 2026 to 2036
- By Country
- USA
- Canada
- Mexico
- By Form
- By Purity Grade
- By Application
- By Sales Channel
- By Country
- Market Attractiveness Analysis
- By Country
- By Form
- By Purity Grade
- By Application
- By Sales Channel
- Key Takeaways
- Latin America Market Analysis and Forecast, By Country
- Historical Market Size Value (USD Million) & Volume (Unit) Trend Analysis By Market Taxonomy, 2021 to 2025
- Market Size Value (USD Million) & Volume (Unit) Forecast By Market Taxonomy, 2026 to 2036
- By Country
- Brazil
- Chile
- Rest of Latin America
- By Form
- By Purity Grade
- By Application
- By Sales Channel
- By Country
- Market Attractiveness Analysis
- By Country
- By Form
- By Purity Grade
- By Application
- By Sales Channel
- Key Takeaways
- Western Europe Market Analysis and Forecast, By Country
- Historical Market Size Value (USD Million) & Volume (Unit) Trend Analysis By Market Taxonomy, 2021 to 2025
- Market Size Value (USD Million) & Volume (Unit) Forecast By Market Taxonomy, 2026 to 2036
- By Country
- Germany
- UK
- Italy
- Spain
- France
- Nordic
- BENELUX
- Rest of Western Europe
- By Form
- By Purity Grade
- By Application
- By Sales Channel
- By Country
- Market Attractiveness Analysis
- By Country
- By Form
- By Purity Grade
- By Application
- By Sales Channel
- Key Takeaways
- Eastern Europe Market Analysis and Forecast, By Country
- Historical Market Size Value (USD Million) & Volume (Unit) Trend Analysis By Market Taxonomy, 2021 to 2025
- Market Size Value (USD Million) & Volume (Unit) Forecast By Market Taxonomy, 2026 to 2036
- By Country
- Russia
- Poland
- Hungary
- Balkan & Baltic
- Rest of Eastern Europe
- By Form
- By Purity Grade
- By Application
- By Sales Channel
- By Country
- Market Attractiveness Analysis
- By Country
- By Form
- By Purity Grade
- By Application
- By Sales Channel
- Key Takeaways
- East Asia Market Analysis and Forecast, By Country
- Historical Market Size Value (USD Million) & Volume (Unit) Trend Analysis By Market Taxonomy, 2021 to 2025
- Market Size Value (USD Million) & Volume (Unit) Forecast By Market Taxonomy, 2026 to 2036
- By Country
- China
- Japan
- South Korea
- By Form
- By Purity Grade
- By Application
- By Sales Channel
- By Country
- Market Attractiveness Analysis
- By Country
- By Form
- By Purity Grade
- By Application
- By Sales Channel
- Key Takeaways
- South Asia and Pacific Market Analysis and Forecast, By Country
- Historical Market Size Value (USD Million) & Volume (Unit) Trend Analysis By Market Taxonomy, 2021 to 2025
- Market Size Value (USD Million) & Volume (Unit) Forecast By Market Taxonomy, 2026 to 2036
- By Country
- India
- ASEAN
- Australia & New Zealand
- Rest of South Asia and Pacific
- By Form
- By Purity Grade
- By Application
- By Sales Channel
- By Country
- Market Attractiveness Analysis
- By Country
- By Form
- By Purity Grade
- By Application
- By Sales Channel
- Key Takeaways
- Middle East & Africa Market Analysis and Forecast, By Country
- Historical Market Size Value (USD Million) & Volume (Unit) Trend Analysis By Market Taxonomy, 2021 to 2025
- Market Size Value (USD Million) & Volume (Unit) Forecast By Market Taxonomy, 2026 to 2036
- By Country
- Kingdom of Saudi Arabia
- Other GCC Countries
- Türkiye
- South Africa
- Other African Union
- Rest of Middle East & Africa
- By Form
- By Purity Grade
- By Application
- By Sales Channel
- By Country
- Market Attractiveness Analysis
- By Country
- By Form
- By Purity Grade
- By Application
- By Sales Channel
- Key Takeaways
- Key Countries Market Analysis
- USA
- Pricing Analysis
- Market Share Analysis, 2025
- By Form
- By Purity Grade
- By Application
- By Sales Channel
- Canada
- Pricing Analysis
- Market Share Analysis, 2025
- By Form
- By Purity Grade
- By Application
- By Sales Channel
- Mexico
- Pricing Analysis
- Market Share Analysis, 2025
- By Form
- By Purity Grade
- By Application
- By Sales Channel
- Brazil
- Pricing Analysis
- Market Share Analysis, 2025
- By Form
- By Purity Grade
- By Application
- By Sales Channel
- Chile
- Pricing Analysis
- Market Share Analysis, 2025
- By Form
- By Purity Grade
- By Application
- By Sales Channel
- Germany
- Pricing Analysis
- Market Share Analysis, 2025
- By Form
- By Purity Grade
- By Application
- By Sales Channel
- UK
- Pricing Analysis
- Market Share Analysis, 2025
- By Form
- By Purity Grade
- By Application
- By Sales Channel
- Italy
- Pricing Analysis
- Market Share Analysis, 2025
- By Form
- By Purity Grade
- By Application
- By Sales Channel
- Spain
- Pricing Analysis
- Market Share Analysis, 2025
- By Form
- By Purity Grade
- By Application
- By Sales Channel
- France
- Pricing Analysis
- Market Share Analysis, 2025
- By Form
- By Purity Grade
- By Application
- By Sales Channel
- India
- Pricing Analysis
- Market Share Analysis, 2025
- By Form
- By Purity Grade
- By Application
- By Sales Channel
- ASEAN
- Pricing Analysis
- Market Share Analysis, 2025
- By Form
- By Purity Grade
- By Application
- By Sales Channel
- Australia & New Zealand
- Pricing Analysis
- Market Share Analysis, 2025
- By Form
- By Purity Grade
- By Application
- By Sales Channel
- China
- Pricing Analysis
- Market Share Analysis, 2025
- By Form
- By Purity Grade
- By Application
- By Sales Channel
- Japan
- Pricing Analysis
- Market Share Analysis, 2025
- By Form
- By Purity Grade
- By Application
- By Sales Channel
- South Korea
- Pricing Analysis
- Market Share Analysis, 2025
- By Form
- By Purity Grade
- By Application
- By Sales Channel
- Russia
- Pricing Analysis
- Market Share Analysis, 2025
- By Form
- By Purity Grade
- By Application
- By Sales Channel
- Poland
- Pricing Analysis
- Market Share Analysis, 2025
- By Form
- By Purity Grade
- By Application
- By Sales Channel
- Hungary
- Pricing Analysis
- Market Share Analysis, 2025
- By Form
- By Purity Grade
- By Application
- By Sales Channel
- Kingdom of Saudi Arabia
- Pricing Analysis
- Market Share Analysis, 2025
- By Form
- By Purity Grade
- By Application
- By Sales Channel
- Türkiye
- Pricing Analysis
- Market Share Analysis, 2025
- By Form
- By Purity Grade
- By Application
- By Sales Channel
- South Africa
- Pricing Analysis
- Market Share Analysis, 2025
- By Form
- By Purity Grade
- By Application
- By Sales Channel
- USA
- Market Structure Analysis
- Competition Dashboard
- Competition Benchmarking
- Market Share Analysis of Top Players
- By Regional
- By Form
- By Purity Grade
- By Application
- By Sales Channel
- Emerging Startups
- Innovation Benchmarking
- Competition Analysis
- Competition Deep Dive
- Hetero Drugs
- Overview
- Product Portfolio
- Profitability by Market Segments (Product/Region/Sales Channel)
- Sales Footprint
- Strategy Overview
- Marketing Strategy
- Product Strategy
- Channel Strategy
- Dr. Reddy's Laboratories
- Aurobindo Pharma
- RPG Life Sciences
- Viyash Scientific
- Teva
- Viatris
- Lupin
- Hetero Drugs
- Case Studies
- Success Stories
- Recent Developments
- Competition Deep Dive
- Assumptions & Acronyms Used


