

- Market Size (2026)
- USD 1.5 billion
- Forecast (2036)
- USD 2.3 billion
- CAGR (2026 to 2036)
- 4.6%
How big is the Shifter Cable Assemblies Market in 2026?
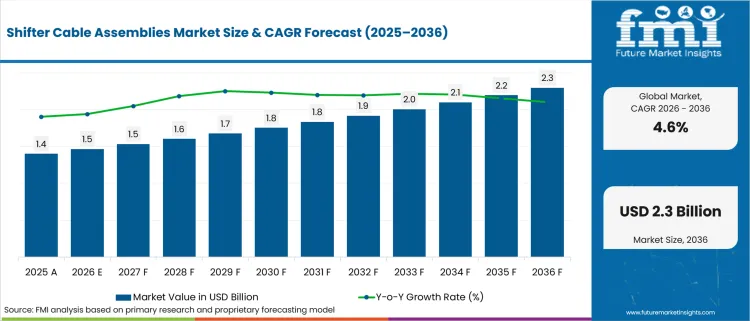
USD 1.5 billion in 2026 and USD 2.3 billion by 2036 at a 4.6% CAGR.
The shifter cable assemblies industry is witnessing expansion due to rising vehicle program needs for a low‑risk link between the cabin selector and the transmission. For instance, OICA reported in April 2026 that global vehicle production reached 96.4 million units in 2025. This gives cable suppliers a steady base of new model and service-part opportunities. OEM buyers mainly care about lever feel and end-fitting strength because these details affect shift quality after assembly.
Replacement demand is supported by older vehicles that stay on the road longer. S&P Global Mobility reported in May 2025 that the average USA vehicle age reached 12.8 years. This matters because cables, bushings, and shift-linkage parts face wear during long vehicle life. Repair buyers prefer suppliers with clear catalog coverage and parts that reduce installation time.
Supplier selection depends on how much vehicle coverage a brand can support. Standard Motor Products said in April 2026 that it released more than 500 new part numbers in Q1 2026. The release covered late-model import and domestic vehicles. This matters because distributors want fewer sourcing gaps and better repair-channel availability across mixed vehicle fleets.
| Metric | Value |
|---|---|
| 2025 Market Size | USD 1.4 billion |
| 2026 Market Size | USD 1.5 billion |
| 2036 Market Size | USD 2.3 billion |
| Forecast CAGR (2026-2036) | 4.6% |
| Leading Cable Type | Push-pull Cables |
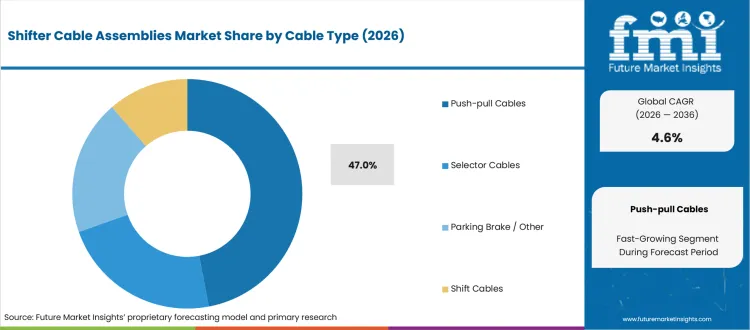
| Push-pull Cables Share (2026) | 47.0% |
| Leading Transmission Type | Automatic Transmission |
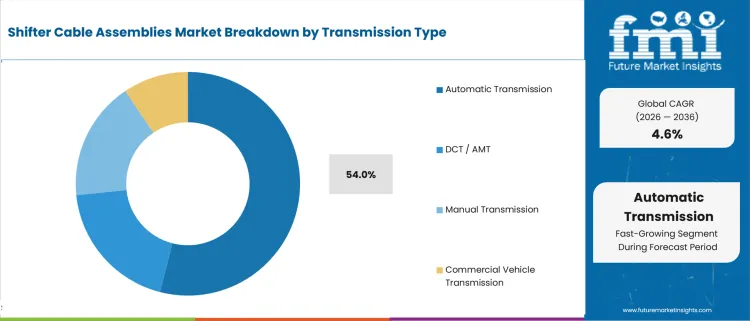
| Automatic Transmission Share (2026) | 54.0% |
| Leading Vehicle Type | Passenger Cars |
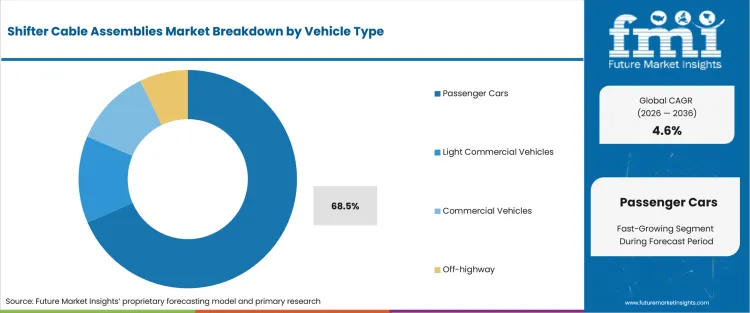
| Passenger Cars Share (2026) | 68.5% |
| Fastest-growing Country | India |
| India CAGR by 2036 | 5.6% |
Summary of the Shifter Cable Assemblies Market
| Market Signal | Commercial Impact |
|---|---|
| Demand and Growth Drivers | Demand for automotive shifter cable assemblies is increasing as OEMs and aftermarket buyers prioritize reliable gear selection, durable cable routing, and validated transmission control systems.
|
| Product and Segment View | Push-pull cables, automatic transmission applications, and passenger vehicles continue to represent the leading commercial opportunities across the market.
|
| Geography and Growth Outlook | Asia and Europe continue to support market expansion through vehicle production growth, electrification, and ongoing transmission system development.
|
| Competitive Landscape | Competition increasingly focuses on product durability, cable routing performance, validation capabilities, and OEM application engineering.
|
| Analyst Perspective | Automotive shifter cable assemblies are evolving from mechanical linkage components into durability-focused transmission control solutions that support vehicle performance and long-term reliability.
- Nikhil Kaitwade, Principal Consultant at Future Market Insights |
How is the shifter cable assemblies market segmented?
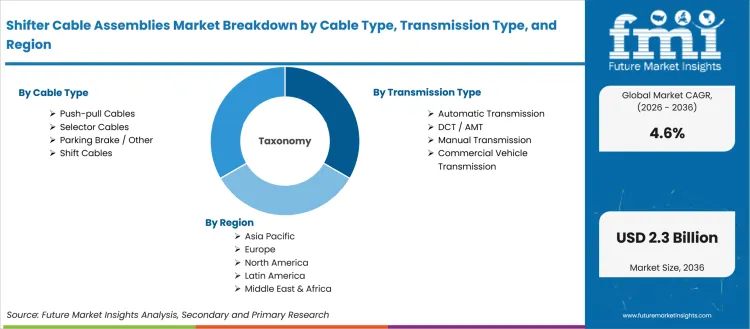
The shifter cable assemblies industry is segmented by cable type, transmission type, vehicle type, sales channel, cable end type, and region.
The Shifter Cable Assemblies Market is segmented by cable type, transmission type, vehicle type, sales channel, cable end type, and region. Cable type covers push-pull cables, selector cables, shift cables, and parking brake or other assemblies. Transmission type includes manual transmission, automatic transmission, DCT or AMT, and commercial vehicle transmission. Vehicle type spans passenger cars, light commercial vehicles, commercial vehicles, and off-highway vehicles. Sales channel includes OEM and aftermarket supply. Cable end type covers ball joint ends, clevis ends, eyelet ends, and custom ends. Regional coverage extends across North America, Latin America, Europe, East Asia, South Asia and Pacific, and the Middle East and Africa.
Why do Push-pull Cables matter within the cable type category?
Compact vehicle layouts create routing problems that rigid linkage systems cannot always solve. Buyers need motion transfer that can move across bends and still preserve selector feel. Push-pull designs are relevant due to force transfer and installation flexibility. Packaging support adds value in compact vehicle programs that leave little room for rigid linkages. The segment also fits replacement channels due to technician need for restored selector travel without gearbox repair.
- In 2026, Push-pull Cables are anticipated to hold 47.0% of cable type demand. The position is driven by two-way motion transfer between lever and transmission interfaces. Cablecraft states that push-pull cables transmit forces in both operating directions. That evidence supports their use in cable assemblies that need compact routing instead of rigid linkage options.
- OEM buyers using push-pull cables are able to reduce linkage complexity, supported by routing flexibility across platform variants. Cable length and bend radius can be validated before production starts. End-fitting position can also be checked during launch work before the design reaches full-volume assembly.
What makes Automatic Transmission the notable transmission segment?
Automatic selector systems create a different cable requirement from manual gear movement. The cable has to translate a cabin selector position into a transmission-side stroke that feels consistent to the driver. Hybrid and combustion vehicles keep this selector requirement in many platforms. The same selector logic can appear in dual clutch transmission layouts that need accurate gear request movement. That keeps cable suppliers involved even as some electrified models reduce traditional mechanical content.
- Automatic Transmission represents an expected 54.0% of transmission type demand in 2026, supported by PRND selector layouts across hybrid and combustion vehicles. Suprajit lists automatic transmission cable requirements covering sliding friction and end-fitting load. The same specification pressure appears in continuously variable transmission programs that need smooth selector movement.
- The executive case for automatic selector cables is warranty control. Buyers need the cable to align lever movement and transmission-side stroke, reinforced by service-channel pressure for parts that restore shift position without repeated adjustment or disputed fitment claims.
How do Passenger Cars shape the vehicle type category?
Passenger car platforms give cable suppliers the volume base for dedicated tooling and standardized geometry. The business problem is repeatability, not one-time fit. A cable that performs well in a prototype can still create warranty risk if friction changes during production variation. This makes passenger cars an important segment for suppliers that can support design reviews and launch validation.
- Passenger Cars are set to account for 68.5% of vehicle type demand in 2026, attributable to platform scale and repeatable cabin shift feel. JAMA reported that Japan produced 7.14 million passenger cars in 2024. This supports the link between passenger platforms and cable tooling decisions.
- Vehicle makers in passenger programs benefit from validated cable geometry due to the need for consistent lever travel across trim levels. The commercial value is lower launch risk and fewer fitment disputes. It also supports better replacement catalogs after the platform enters service.
How is OEM supply positioned within the sales channel category?
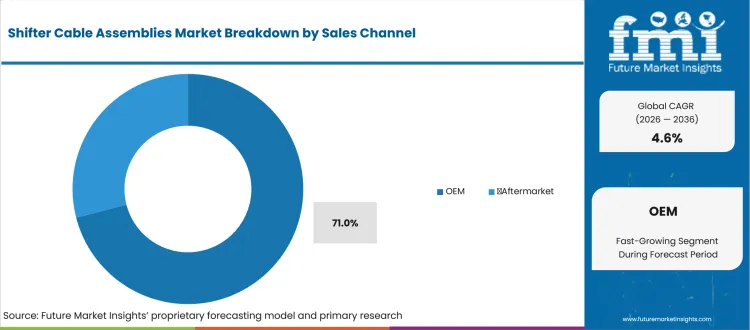
OEM supply is shaped by platform approval before vehicle launch. Cable assemblies must match firewall routing and bracket position. Lever travel and transmission-side geometry must also align before production approval. A replacement part can be cataloged later, but the original fitment decision is made during engineering sign-off. Suppliers that support launch testing gain earlier access to program decisions.
- OEM supply is likely to hold 71.0% share in 2026, led by qualification requirements during platform development. Kongsberg Automotive reported in April 2025 that its Faridabad plant manufactures cable gear shifters. This reinforces the importance of local assembly support for OEM programs.
- For sourcing teams, OEM-channel value comes from accountability during launch and production changes. Suppliers that can support drawings and validation reports reduce the risk of cable adjustment problems. Plant feedback can be addressed earlier before a fitment issue turns into a delayed vehicle program.
What supports demand for Ball Joint Ends in cable end type?
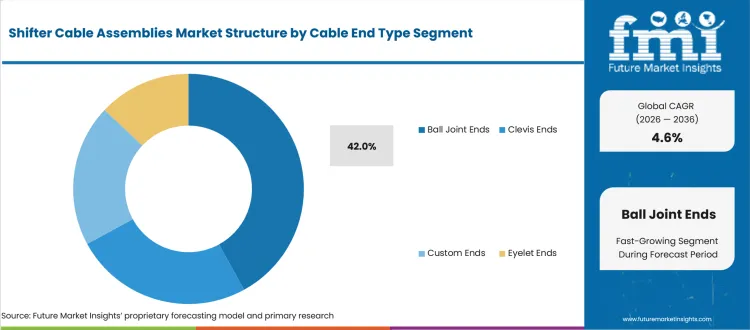
Cable end geometry affects shift feel and joint movement. Assembly tolerance is also part of the fitment decision. Ball joint ends are relevant for selector linkages that need angular movement instead of straight-line connection. The component can look small in the bill of materials. Poor retention or weak articulation can still become a service problem that buyers notice quickly.
- Ball Joint Ends are expected to hold 42.0% share by cable end type in 2026, shaped by selector linkage points that need angular movement. Suprajit notes that shifter and selector cable applications use ball end fittings. This makes end-fitting design part of shift performance.
- Service buyers benefit from ball joint ends owing to easier fitment at lever and transmission connection points. The operating value is a more predictable replacement path, especially for vehicles that need restored selector movement without broader gearbox repair work.
What are the drivers, restraints, and opportunities in the shifter cable assemblies market?
Near-term purchases are being shaped by durability validation, EV substitution risk, and regional service access outlined below.
- Driver: OEM spending is driven by selector feel validation and the need to reduce warranty risk during vehicle launch.
- Restraint: Single-speed EV layouts restrain traditional cable content due to lower mechanical gear-selection needs.
- Opportunity: Local assembly gains traction from regional OEM sourcing and faster aftermarket service-part availability.
Vehicle makers now treat shifter cables like shift-feel parts instead of simple mechanical links. Buying activity is influenced by routing reviews and supplier drawings. Kongsberg Automotive announced in June 2024 a contract worth over EUR 55 million for its Dog Clutch Actuator. The adjacent gear-shifting work shows buyers are funding validated motion interfaces across hybrid and electric driveline programs. Shifter cable suppliers benefit from the same qualification mindset if they can prove friction control and end-fitting reliability before production release. That proof supports pricing where launch risk is material.
Electrified platforms reduce cable content in some single-speed vehicle layouts, but the restraint does not remove the market. IEA reported in May 2026 that almost 22 million electric cars were produced globally in 2025. The figure signals how quickly simple mechanical gear-selection content can be displaced in some passenger-car programs. Hybrid transmissions and commercial vehicles still need reliable selector movement. Suppliers therefore convert the restraint into a selective opportunity by serving platforms that retain multi-position or auxiliary driveline control. This keeps cable engineering relevant beyond traditional manual transmission use.
Regional service access is the supplier opportunity for companies that can combine cable engineering and local response. Suprajit reported in May 2025 that the second tranche of its Stahlschmidt Cable Systems acquisition was concluded for China and Canada. That action gives buyers a clearer example of why regional cable capacity matters. Local assembly and program support reduce timing risk for OEM launches. They also improve aftermarket availability for replacement parts that must match the original routing path. This route is useful for suppliers that need credibility near vehicle assembly clusters.
Which country CAGRs are profiled in the shifter cable assemblies market?
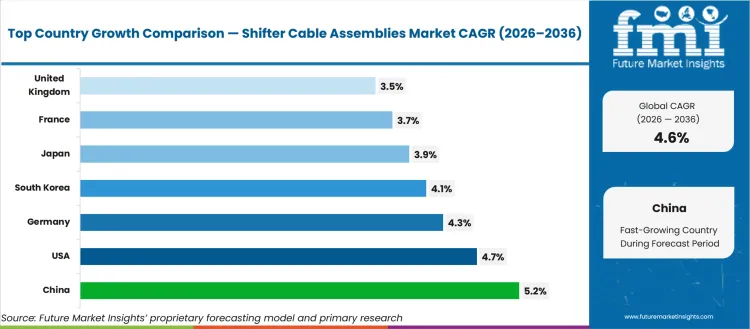
| Country | CAGR |
|---|---|
| United States | 4.7% |
| United Kingdom | 3.5% |
| Germany | 4.3% |
| France | 3.7% |
| Japan | 3.9% |
| China | 5.2% |
| South Korea | 4.1% |
| India | 5.6% |
How do country-level CAGRs compare in the shifter cable assemblies market?
Country CAGR profiles in shifter cable assemblies should be read by platform mix and sourcing logic instead of one universal adoption trigger. In established automotive markets, the case is tied to replacement demand and hybrid selector content. In higher-CAGR markets, the product sits closer to local production growth and supplier localization near assembly plants. China and India gain support from scale and nearby sourcing. The United States and Japan gain support from service demand and quality expectations. Europe shows steadier movement due to electrified program engineering and selective replacement demand. Buyers can use the country spread to decide where local supply and validation support matter first.
- By 2036, the United States is projected to record 4.7% CAGR. The profile is driven by replacement demand and a large light-vehicle service base. NADA reported that conventional hybrid sales reached 2.05 million units in 2025. This supports continued selector cable relevance due to mechanical interface needs in many hybrid platforms.
- The United Kingdom is expected to grow at 3.5% CAGR during the forecast period, attributable to a smaller production base and selective program opportunities. SMMT reported in January 2026 that UK vehicle production reached 764,715 units in 2025. The country therefore shows a steadier profile than larger production centers.
- Over the assessment period, Germany is forecast to advance at 4.3% CAGR. The profile is supported by electrified passenger-car production and engineering depth. VDA reported in February 2026 that Germany produced 1.22 million battery-electric passenger cars in 2025. This supports shifter suppliers serving hybrid and multi-speed interface programs.
- Through 2036, France is anticipated to post 3.7% CAGR. The profile is reinforced by hybrid vehicle uptake and regional supplier qualification. ACEA reported in January 2026 that French hybrid-electric registrations grew 21.6% in 2025. This supports cable demand in programs that still use selector interfaces instead of pure electronic selection.
- Japan is likely to expand at 3.9% CAGR by 2036, shaped by quality expectations and stable passenger-car production discipline. JAMA reported in 2025 that Japan produced 8.23 million motor vehicles in 2024. This supports a steady cable qualification profile instead of a sharply expansion-led profile.
- China is estimated to rise at 5.2% CAGR between 2026 and 2036, propelled by vehicle output and electrified platform variety. The State Council of China reported in January 2026 that NEV production reached 16.626 million units in 2025. This supports selector-interface needs in hybrid and multi-speed applications.
- Demand in South Korea is projected to grow at 4.1% CAGR by 2036, influenced by export-oriented production and hybrid vehicle shipments. MOTIR reported in April 2026 that March automobile exports reached USD 6.4 billion. This export base supports cable suppliers tied to vehicle programs for overseas markets.
- India is expected to grow at 5.6% CAGR during the forecast period, led by local vehicle output and OEM supplier development. SIAM reported in April 2026 that passenger vehicle sales reached 46.43 lakh units in FY2025-26. This gives cable suppliers a broader base for fitment validation and localization.
Who are the notable companies in the shifter cable assemblies market?
Kongsberg Automotive, Suprajit Engineering, HI-LEX, Orscheln Products, Cablecraft Motion Controls, Dura-Shiloh, Chattarpati Automotive Systems, and Jaydee Auto Cables are the notable companies shaping this market.
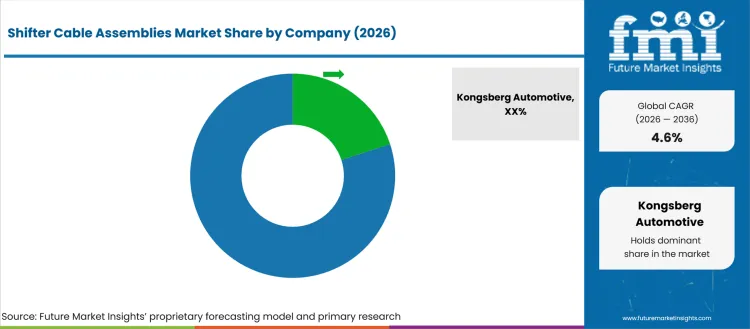
Supplier selection in shifter cable assemblies is structured by the problem the buyer wants solved. Kongsberg Automotive and Suprajit Engineering are more relevant for global OEM programs that need validation depth and regional supply. HI-LEX becomes important for customer-specific cable engineering in passenger vehicles. Orscheln Products and Cablecraft Motion Controls gain relevance for commercial and specialty applications. Dura-Shiloh adds heavy-duty remote cable reach. Local suppliers matter if buyers need country-specific aftermarket access.
- Kongsberg Automotive and Suprajit Engineering are relevant for OEM buyers that need validated drive-control products and regional assembly support. Their role is practical due to qualification data and end-fitting reliability. Local support during platform launch is another buyer requirement.
- Buyers choosing HI-LEX are typically looking for customer-specific mechanical control cable engineering, supported by the company's vehicle-control heritage. The company is relevant to passenger and light commercial programs that need coordinated cable geometry across multiple platforms.
- Orscheln Products and Cablecraft Motion Controls gain preference in specialty vehicle and manual shifter applications, driven by design support and test capability. Their buyer fit is clearest in programs that need motion-control engineering instead of a simple catalog replacement part.
- Dura-Shiloh and regional cable suppliers are suited to heavy-duty and aftermarket needs, reinforced by demand for service access and application-specific replacement parts. Their role matters in channels that value fitment availability and shorter lead times. Support for older vehicle models adds another use case.
Competitive Benchmarking: Shifter Cable Assemblies Market
| Company | Validation Depth | End-Fitting Range | Assembly Reach | Application Fit |
|---|---|---|---|---|
| Kongsberg Automotive | High | Strong | Global | OEM and commercial vehicles |
| Suprajit Engineering | High | Strong | Global | OEM and aftermarket |
| HI-LEX | High | Strong | Global | Passenger and vehicle controls |
| Orscheln Products | Strong | Medium | Global | Commercial and specialty vehicles |
| Cablecraft Motion Controls | Strong | Medium | Regional | Manual shifter and actuation |
| Dura-Shiloh | Medium | Strong | Global | Heavy-duty remote controls |
| Chattarpati Automotive Systems | Medium | Medium | Country-specific | Aftermarket and local OEMs |
| Jaydee Auto Cables | Medium | Medium | Country-specific | Aftermarket cable supply |
Source: Future Market Insights competitive analysis, 2026. Ratings reflect relative portfolio relevance, workflow or project fit, service capability, and geographic reach.
Key Developments in the Shifter Cable Assemblies Market
- In June 2024, Suprajit Engineering announced that it would acquire the business of Stahlschmidt Cable Systems from insolvency proceedings in Germany. The action matters due to expanded cable system depth in Europe. It points to continued consolidation around validated cable engineering.
- In April 2025, Kongsberg Automotive inaugurated its relocated Faridabad facility in India. The company said the plant manufactures drive control products including cable gear shifters. This matters due to local production support for OEM sourcing and service continuity. Regional qualification is another implication.
- In May 2025, Kongsberg Automotive won a four-year contract worth about EUR 20 million for its Dog Clutch Actuator. The product supports gear-shifting and decoupling applications in electric and hybrid vehicles. The development points to adjacent value in the EV transmission system space.
- In May 2026, Orscheln Europe expanded design and manufacturing support for push-button shift selectors. The move matters due to regional engineering access for European OEMs. It reflects a move toward local technical support for driver-control systems and selector-related components.
Key Players in the Shifter Cable Assemblies Market
Global OEM Cable Suppliers
- Kongsberg Automotive
- Suprajit Engineering
- HI-LEX
Specialty and Commercial Vehicle Controls
- Orscheln Products
- Cablecraft Motion Controls
- Dura-Shiloh
Regional Aftermarket Suppliers
- Chattarpati Automotive Systems
- Jaydee Auto Cables
Shifter Cable Assemblies Market - Report Scope
| Coverage field | Report scope |
|---|---|
| Market breakdown | Cable type, transmission type, vehicle type, sales channel, cable end type, and region. |
| Market Definition | Shifter cable assemblies are mechanical cable systems that transfer driver gear selection from a lever or selector to a transmission interface. |
| Regions Covered | North America, Latin America, Western Europe, Eastern Europe, East Asia, South Asia and Pacific, Middle East and Africa. |
| Countries Covered | United States, United Kingdom, Germany, France, Japan, China, South Korea, India, and broader regional coverage. |
| Key Companies Profiled | Kongsberg Automotive, Suprajit Engineering, HI-LEX, Orscheln Products, Cablecraft Motion Controls, Dura-Shiloh, Chattarpati Automotive Systems, Jaydee Auto Cables. |
| Forecast Period | 2026 to 2036. |
| Approach | Hybrid bottom-up and top-down methodology using vehicle output, transmission mix, cable content, replacement behavior, and country-level program exposure. |
Shifter Cable Assemblies Market - Research Methodology
| Method | Approach |
|---|---|
| Primary Research | FMI analysts reviewed inputs from Tier-1 cable suppliers, aftermarket distributors, vehicle sourcing teams, and service channel participants. The review focused on routing constraints, validation needs, replacement triggers, and qualification practices across passenger and commercial vehicle programs. |
| Desk Research | Desk research covered official vehicle production sources, automotive trade associations, regulator publications, company product pages, and supplier press releases. Sources were used only where they supported the exact article point and cable assembly demand logic. |
| Market Sizing and Forecasting | The model combined vehicle production, transmission mix, cable content per vehicle, aftermarket replacement cycles, and average cable value by channel. Country forecasts were checked against platform exposure, local production trends, and supplier assembly presence. |
| Data Validation | Forecasts were validated against supplier portfolios, official production data, and country-level automotive indicators. Duplicate public evidence statistics were removed during review so each external figure supports one section only. |
Shifter Cable Assemblies Market by Segments
Shifter Cable Assemblies Market segmented by Cable Type:
- Push-pull Cables
- Selector Cables
- Shift Cables
- Parking Brake / Other
Shifter Cable Assemblies Market segmented by Transmission Type:
- Manual Transmission
- Automatic Transmission
- DCT / AMT
- Commercial Vehicle Transmission
Shifter Cable Assemblies Market segmented by Vehicle Type:
- Passenger Cars
- Light Commercial Vehicles
- Commercial Vehicles
- Off-highway
Shifter Cable Assemblies Market segmented by Sales Channel:
- OEM
- Aftermarket
Shifter Cable Assemblies Market segmented by Cable End Type:
- Ball Joint Ends
- Clevis Ends
- Eyelet Ends
- Custom Ends
Shifter Cable Assemblies Market by Region:
- North America
- United States
- Canada
- Europe
- Germany
- United Kingdom
- France
- Italy
- Spain
- Asia Pacific
- China
- Japan
- South Korea
- Taiwan
- Singapore
- Latin America
- Brazil
- Mexico
- Argentina
- Middle East & Africa
- GCC Countries
- South Africa
- Israel
Research Sources and Bibliography
- International Organization of Motor Vehicle Manufacturers. (2026, April 23). Auto industry growth shifted east in 2025 amid global repositioning. OICA.
- National Automobile Dealers Association. (2025, December 31). December 2025 Market Beat: New Light-Vehicle Sales Totaled 16.2 Million Units in 2025. NADA.
- Society of Indian Automobile Manufacturers. (2026, April 14). Auto Industry Performance of Q4 (Jan-March 2026) & FY 2025-26. SIAM.
- The State Council of the People's Republic of China. (2026, January 14). China's auto output, sales reach new highs in 2025. The State Council.
- European Automobile Manufacturers' Association. (2026, January 21). New car registrations: +1.8% in 2025; battery-electric 17.4% market share. ACEA.
- Japan Automobile Manufacturers Association. (2025). The Motor Industry of Japan 2025. JAMA.
- German Association of the Automotive Industry. (2026, February 3). 40% electric share of passenger car production in 2025. VDA.
- Society of Motor Manufacturers and Traders. (2026, January 29). Tough year for Auto but new models and Industrial Strategy can deliver growth. SMMT.
- International Energy Agency. (2026, May). Manufacturing and trade: Global EV Outlook 2026. IEA.
- Ministry of Trade, Industry and Resources. (2026, April 15). March 2026 Automobile Exports Reach $6.4 Billion. MOTIR.
- Suprajit Engineering Limited. (2024, June 9). Press Release | Suprajit to acquire the business of Stahlschmidt Cable Systems (SCS), out of insolvency proceedings in Germany. Suprajit Group.
- Kongsberg Automotive. (2025, April 16). Kongsberg Automotive strengthens its presence in India by relocating its operations to a state-of-the-art plant. Kongsberg Automotive.
- Kongsberg Automotive. (2025, May 7). Kongsberg Automotive wins a new contract worth approximately EUR 20 million in estimated lifetime revenue in fast-growing EV segment. Kongsberg Automotive.
- Orscheln Products. (2026, May 19). Orscheln Europe Now Offers Push-Button Shift Selectors. Orscheln Products.
- Kongsberg Automotive. (2024, June 10). Kongsberg Automotive wins a new contract worth over EUR 55 million in estimated lifetime revenue. Kongsberg Automotive.
- Suprajit Engineering Limited. (2025, May 31). Second Tranche of Stahlschmidt Cable Systems (SCS) Acquisition May 31 2025. Suprajit Group.
This bibliography is provided for reader reference and uses primary government, standards-body, official trade body, and company sources.
This Report Answers
- What is the expected global value of the Shifter Cable Assemblies Market in 2026 and 2036?
- What CAGR is forecast for shifter cable assemblies during the 2026 to 2036 period?
- Which cable type category is used to assess push-pull cable demand in 2026?
- Why do OEMs and aftermarket distributors buy shifter cable assemblies for vehicle programs?
- How does automatic transmission fitment shape supplier qualification and cable design?
- Which countries are compared in the shifter cable assemblies forecast?
- Which companies compete across OEM and aftermarket cable supply?
- What components are included within the shifter cable assemblies definition?
- How does FMI size and forecast shifter cable assembly demand across segments and countries?
- What buyer factors should executives assess before selecting shifter cable suppliers?
Frequently Asked Questions
Why should executives track the Shifter Cable Assemblies Market?
Executives should track this market because shifter cable reliability directly affects shift feel warranty exposure and service downtime across passenger and light commercial vehicles.
What business problem does the Shifter Cable Assemblies Market address?
It provides a stable mechanical link between the cabin gear selector and the transmission which prevents mis shift complaints and adjustment failures.
What should procurement leaders evaluate before selecting suppliers?
Procurement leaders should evaluate routing flexibility end fitting durability friction performance validation history and local manufacturing support.
What can limit return on investment for buyers?
Return on investment can be limited by poor fitment inconsistent cable routing and limited aftermarket availability during the vehicle lifecycle.
How can suppliers build executive confidence?
Suppliers build confidence by proving durability under heat and vibration providing validated end fittings supporting launch testing and ensuring long term service continuity.
Preview the report firsthand - request a free sample
Get SampleGet the brochure for pricing and purchase details.
Get PDFTable of Content
- Key Takeaways
- Market Size and CAGR
- Top Growth Driver
- Fastest Growing Segment
- Leading Region
- Key Companies
- Emerging Opportunities
- Executive Summary
- Global Market Outlook
- Demand-side Trends
- Supply-side Trends
- Technology Roadmap Analysis
- Analysis and Recommendations
- Analyst Perspective (What is happening? Why now? What should investors know?)
- Key Questions Answered
- How large is the market?
- What is the CAGR?
- What are key trends?
- Which region dominates?
- Who are the leaders?
- Market Overview
- Market Coverage / Taxonomy
- Market Definition / Scope / Limitations
- Research Methodology
- Chapter Orientation
- Analytical Lens and Working Hypotheses
- Market Structure, Signals, and Trend Drivers
- Benchmarking and Cross-market Comparability
- Market Sizing, Forecasting, and Opportunity Mapping
- Research Design and Evidence Framework
- Desk Research Programme (Secondary Evidence)
- Expert Input and Fieldwork (Primary Evidence)
- Tooling, Models, and Reference Databases
- Data Engineering and Model Build
- Quality Assurance and Audit Trail
- Market Background
- Market Dynamics (Drivers, Restraints, Opportunity, Trends)
- Scenario Forecast (Optimistic, Likely, Conservative)
- Impact Analysis
- AI Impact
- Sustainability Impact
- Regulatory Impact
- Technology Impact
- Consumer / Buyer Analysis
- Purchase Drivers
- Adoption Barriers
- Buyer Journey
- Opportunity Map Analysis
- Product Life Cycle Analysis
- Supply Chain Analysis
- Investment Feasibility Matrix
- Value Chain Analysis
- PESTLE and Porter's Analysis
- Regulatory Landscape
- Regional Parent Market Outlook
- Production and Consumption Statistics
- Import and Export Statistics
- Global Market Analysis and Forecast, 2021 to 2036
- Historical Market Size Value (USD Billion) & Volume (Unit) Analysis, 2021 to 2025
- Current and Future Market Size Value (USD Billion) & Volume (Unit) Projections, 2026 to 2036
- Y-o-Y Growth Trend Analysis
- Absolute $ Opportunity Analysis
- Global Market Pricing Analysis, 2021 to 2036
- Global Market Analysis and Forecast, By Cable Type, 2021 to 2036
- Introduction / Key Findings
- Historical Market Size Value (USD Billion) & Volume (Unit) Analysis By Cable Type, 2021 to 2025
- Current and Future Market Size Value (USD Billion) & Volume (Unit) Analysis and Forecast By Cable Type, 2026 to 2036
- Push-pull Cables
- Selector Cables
- Parking Brake / Other
- Shift Cables
- Push-pull Cables
- Y-o-Y Growth Trend Analysis By Cable Type, 2021 to 2025
- Absolute $ Opportunity Analysis By Cable Type, 2026 to 2036
- Global Market Analysis and Forecast, By Transmission Type, 2021 to 2036
- Introduction / Key Findings
- Historical Market Size Value (USD Billion) & Volume (Unit) Analysis By Transmission Type, 2021 to 2025
- Current and Future Market Size Value (USD Billion) & Volume (Unit) Analysis and Forecast By Transmission Type, 2026 to 2036
- Automatic Transmission
- DCT / AMT
- Manual Transmission
- Commercial Vehicle Transmission
- Automatic Transmission
- Y-o-Y Growth Trend Analysis By Transmission Type, 2021 to 2025
- Absolute $ Opportunity Analysis By Transmission Type, 2026 to 2036
- Global Market Analysis and Forecast, By Vehicle Type, 2021 to 2036
- Introduction / Key Findings
- Historical Market Size Value (USD Billion) & Volume (Unit) Analysis By Vehicle Type, 2021 to 2025
- Current and Future Market Size Value (USD Billion) & Volume (Unit) Analysis and Forecast By Vehicle Type, 2026 to 2036
- Passenger Cars
- Light Commercial Vehicles
- Commercial Vehicles
- Off-highway
- Passenger Cars
- Y-o-Y Growth Trend Analysis By Vehicle Type, 2021 to 2025
- Absolute $ Opportunity Analysis By Vehicle Type, 2026 to 2036
- Global Market Analysis and Forecast, By Sales Channel, 2021 to 2036
- Introduction / Key Findings
- Historical Market Size Value (USD Billion) & Volume (Unit) Analysis By Sales Channel, 2021 to 2025
- Current and Future Market Size Value (USD Billion) & Volume (Unit) Analysis and Forecast By Sales Channel, 2026 to 2036
- OEM
- Aftermarket
- OEM
- Y-o-Y Growth Trend Analysis By Sales Channel, 2021 to 2025
- Absolute $ Opportunity Analysis By Sales Channel, 2026 to 2036
- Global Market Analysis and Forecast, By Cable End Type, 2021 to 2036
- Introduction / Key Findings
- Historical Market Size Value (USD Billion) & Volume (Unit) Analysis By Cable End Type, 2021 to 2025
- Current and Future Market Size Value (USD Billion) & Volume (Unit) Analysis and Forecast By Cable End Type, 2026 to 2036
- Ball Joint Ends
- Clevis Ends
- Custom Ends
- Eyelet Ends
- Ball Joint Ends
- Y-o-Y Growth Trend Analysis By Cable End Type, 2021 to 2025
- Absolute $ Opportunity Analysis By Cable End Type, 2026 to 2036
- Global Market Analysis and Forecast, By Region, 2021 to 2036
- Introduction
- Historical Market Size Value (USD Billion) & Volume (Unit) Analysis By Region, 2021 to 2025
- Current Market Size Value (USD Billion) & Volume (Unit) Analysis and Forecast By Region, 2026 to 2036
- North America
- Latin America
- Western Europe
- Eastern Europe
- East Asia
- South Asia and Pacific
- Middle East & Africa
- Market Attractiveness Analysis By Region
- North America Market Analysis and Forecast, By Country, 2021 to 2036
- Historical Market Size Value (USD Billion) & Volume (Unit) Trend Analysis By Market Taxonomy, 2021 to 2025
- Market Size Value (USD Billion) & Volume (Unit) Forecast By Market Taxonomy, 2026 to 2036
- By Country
- USA
- Canada
- Mexico
- By Cable Type
- By Transmission Type
- By Vehicle Type
- By Sales Channel
- By Cable End Type
- By Country
- Market Attractiveness Analysis
- By Country
- By Cable Type
- By Transmission Type
- By Vehicle Type
- By Sales Channel
- By Cable End Type
- Key Takeaways
- Latin America Market Analysis and Forecast, By Country
- Historical Market Size Value (USD Billion) & Volume (Unit) Trend Analysis By Market Taxonomy, 2021 to 2025
- Market Size Value (USD Billion) & Volume (Unit) Forecast By Market Taxonomy, 2026 to 2036
- By Country
- Brazil
- Chile
- Rest of Latin America
- By Cable Type
- By Transmission Type
- By Vehicle Type
- By Sales Channel
- By Cable End Type
- By Country
- Market Attractiveness Analysis
- By Country
- By Cable Type
- By Transmission Type
- By Vehicle Type
- By Sales Channel
- By Cable End Type
- Key Takeaways
- Western Europe Market Analysis and Forecast, By Country
- Historical Market Size Value (USD Billion) & Volume (Unit) Trend Analysis By Market Taxonomy, 2021 to 2025
- Market Size Value (USD Billion) & Volume (Unit) Forecast By Market Taxonomy, 2026 to 2036
- By Country
- Germany
- UK
- Italy
- Spain
- France
- Nordic
- BENELUX
- Rest of Western Europe
- By Cable Type
- By Transmission Type
- By Vehicle Type
- By Sales Channel
- By Cable End Type
- By Country
- Market Attractiveness Analysis
- By Country
- By Cable Type
- By Transmission Type
- By Vehicle Type
- By Sales Channel
- By Cable End Type
- Key Takeaways
- Eastern Europe Market Analysis and Forecast, By Country
- Historical Market Size Value (USD Billion) & Volume (Unit) Trend Analysis By Market Taxonomy, 2021 to 2025
- Market Size Value (USD Billion) & Volume (Unit) Forecast By Market Taxonomy, 2026 to 2036
- By Country
- Russia
- Poland
- Hungary
- Balkan & Baltic
- Rest of Eastern Europe
- By Cable Type
- By Transmission Type
- By Vehicle Type
- By Sales Channel
- By Cable End Type
- By Country
- Market Attractiveness Analysis
- By Country
- By Cable Type
- By Transmission Type
- By Vehicle Type
- By Sales Channel
- By Cable End Type
- Key Takeaways
- East Asia Market Analysis and Forecast, By Country
- Historical Market Size Value (USD Billion) & Volume (Unit) Trend Analysis By Market Taxonomy, 2021 to 2025
- Market Size Value (USD Billion) & Volume (Unit) Forecast By Market Taxonomy, 2026 to 2036
- By Country
- China
- Japan
- South Korea
- By Cable Type
- By Transmission Type
- By Vehicle Type
- By Sales Channel
- By Cable End Type
- By Country
- Market Attractiveness Analysis
- By Country
- By Cable Type
- By Transmission Type
- By Vehicle Type
- By Sales Channel
- By Cable End Type
- Key Takeaways
- South Asia and Pacific Market Analysis and Forecast, By Country
- Historical Market Size Value (USD Billion) & Volume (Unit) Trend Analysis By Market Taxonomy, 2021 to 2025
- Market Size Value (USD Billion) & Volume (Unit) Forecast By Market Taxonomy, 2026 to 2036
- By Country
- India
- ASEAN
- Australia & New Zealand
- Rest of South Asia and Pacific
- By Cable Type
- By Transmission Type
- By Vehicle Type
- By Sales Channel
- By Cable End Type
- By Country
- Market Attractiveness Analysis
- By Country
- By Cable Type
- By Transmission Type
- By Vehicle Type
- By Sales Channel
- By Cable End Type
- Key Takeaways
- Middle East & Africa Market Analysis and Forecast, By Country
- Historical Market Size Value (USD Billion) & Volume (Unit) Trend Analysis By Market Taxonomy, 2021 to 2025
- Market Size Value (USD Billion) & Volume (Unit) Forecast By Market Taxonomy, 2026 to 2036
- By Country
- Kingdom of Saudi Arabia
- Other GCC Countries
- Türkiye
- South Africa
- Other African Union
- Rest of Middle East & Africa
- By Cable Type
- By Transmission Type
- By Vehicle Type
- By Sales Channel
- By Cable End Type
- By Country
- Market Attractiveness Analysis
- By Country
- By Cable Type
- By Transmission Type
- By Vehicle Type
- By Sales Channel
- By Cable End Type
- Key Takeaways
- Key Countries Market Analysis
- USA
- Pricing Analysis
- Market Share Analysis, 2025
- By Cable Type
- By Transmission Type
- By Vehicle Type
- By Sales Channel
- By Cable End Type
- Canada
- Pricing Analysis
- Market Share Analysis, 2025
- By Cable Type
- By Transmission Type
- By Vehicle Type
- By Sales Channel
- By Cable End Type
- Mexico
- Pricing Analysis
- Market Share Analysis, 2025
- By Cable Type
- By Transmission Type
- By Vehicle Type
- By Sales Channel
- By Cable End Type
- Brazil
- Pricing Analysis
- Market Share Analysis, 2025
- By Cable Type
- By Transmission Type
- By Vehicle Type
- By Sales Channel
- By Cable End Type
- Chile
- Pricing Analysis
- Market Share Analysis, 2025
- By Cable Type
- By Transmission Type
- By Vehicle Type
- By Sales Channel
- By Cable End Type
- Germany
- Pricing Analysis
- Market Share Analysis, 2025
- By Cable Type
- By Transmission Type
- By Vehicle Type
- By Sales Channel
- By Cable End Type
- UK
- Pricing Analysis
- Market Share Analysis, 2025
- By Cable Type
- By Transmission Type
- By Vehicle Type
- By Sales Channel
- By Cable End Type
- Italy
- Pricing Analysis
- Market Share Analysis, 2025
- By Cable Type
- By Transmission Type
- By Vehicle Type
- By Sales Channel
- By Cable End Type
- Spain
- Pricing Analysis
- Market Share Analysis, 2025
- By Cable Type
- By Transmission Type
- By Vehicle Type
- By Sales Channel
- By Cable End Type
- France
- Pricing Analysis
- Market Share Analysis, 2025
- By Cable Type
- By Transmission Type
- By Vehicle Type
- By Sales Channel
- By Cable End Type
- India
- Pricing Analysis
- Market Share Analysis, 2025
- By Cable Type
- By Transmission Type
- By Vehicle Type
- By Sales Channel
- By Cable End Type
- ASEAN
- Pricing Analysis
- Market Share Analysis, 2025
- By Cable Type
- By Transmission Type
- By Vehicle Type
- By Sales Channel
- By Cable End Type
- Australia & New Zealand
- Pricing Analysis
- Market Share Analysis, 2025
- By Cable Type
- By Transmission Type
- By Vehicle Type
- By Sales Channel
- By Cable End Type
- China
- Pricing Analysis
- Market Share Analysis, 2025
- By Cable Type
- By Transmission Type
- By Vehicle Type
- By Sales Channel
- By Cable End Type
- Japan
- Pricing Analysis
- Market Share Analysis, 2025
- By Cable Type
- By Transmission Type
- By Vehicle Type
- By Sales Channel
- By Cable End Type
- South Korea
- Pricing Analysis
- Market Share Analysis, 2025
- By Cable Type
- By Transmission Type
- By Vehicle Type
- By Sales Channel
- By Cable End Type
- Russia
- Pricing Analysis
- Market Share Analysis, 2025
- By Cable Type
- By Transmission Type
- By Vehicle Type
- By Sales Channel
- By Cable End Type
- Poland
- Pricing Analysis
- Market Share Analysis, 2025
- By Cable Type
- By Transmission Type
- By Vehicle Type
- By Sales Channel
- By Cable End Type
- Hungary
- Pricing Analysis
- Market Share Analysis, 2025
- By Cable Type
- By Transmission Type
- By Vehicle Type
- By Sales Channel
- By Cable End Type
- Kingdom of Saudi Arabia
- Pricing Analysis
- Market Share Analysis, 2025
- By Cable Type
- By Transmission Type
- By Vehicle Type
- By Sales Channel
- By Cable End Type
- Türkiye
- Pricing Analysis
- Market Share Analysis, 2025
- By Cable Type
- By Transmission Type
- By Vehicle Type
- By Sales Channel
- By Cable End Type
- South Africa
- Pricing Analysis
- Market Share Analysis, 2025
- By Cable Type
- By Transmission Type
- By Vehicle Type
- By Sales Channel
- By Cable End Type
- USA
- Market Structure Analysis
- Competition Dashboard
- Competition Benchmarking
- Market Share Analysis of Top Players
- By Regional
- By Cable Type
- By Transmission Type
- By Vehicle Type
- By Sales Channel
- By Cable End Type
- Emerging Startups
- Innovation Benchmarking
- Competition Analysis
- Competition Deep Dive
- Kongsberg Automotive
- Overview
- Product Portfolio
- Profitability by Market Segments (Product/Region/Sales Channel)
- Sales Footprint
- Strategy Overview
- Marketing Strategy
- Product Strategy
- Channel Strategy
- Suprajit Engineering
- HI-LEX
- Orscheln Products
- Cablecraft Motion Controls
- Kongsberg Automotive
- Case Studies
- Success Stories
- Recent Developments
- Competition Deep Dive
- Assumptions & Acronyms Used


