Shoe Insoles Market Outlook for 2024 to 2034

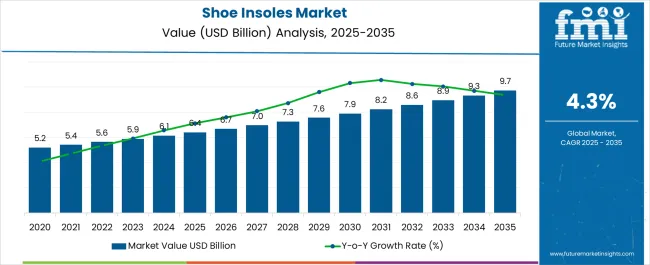
The shoe insoles market valuation is estimated to reach US$ 6,122.8 million in 2024. In 2023, the market was valued at US$ 5,836.8 million. The market is predicted to grow at a healthy CAGR of 4.50% from 2024 to 2034. The valuation of the shoe insoles market is expected to reach US$ 9,508.5 million by 2034.

Attributes Key Statistics
Shoe Insoles Market Value (2024) US$ 6,122.8 million
Anticipated Market Value (2034) US$ 9,508.5 million
Value-based CAGR (2024 to 2034) 4.50% CAGR

Don't pay for what you don't need

Customize your report by selecting specific countries or regions and save 30%!

Key Market Trends

There have been a lot of modifications and improvisations in the field of footwear, especially shoes. Trends and innovations driving the market are listed below.

  • There is a growing demand for customized insoles tailored to individual foot shapes and preferences. Personalized insoles with brands offering options like heat-moldable or 3D-printed insoles are extensively contributing to the overall market growth.
  • Integration of technology, such as smart insoles with sensors and connectivity features, is also in vogue as the general population all over the world is focusing increasingly on track foot movement, pressure points, and activity data for performance optimization.
  • As the world pushes toward sustainability, consumers are increasingly emphasizing the use of eco-friendly materials and manufacturing processes in insole production. To respond to these demands, brands all over the world are utilizing used insoles for recycling.
  • In the past few years, it has been observed that shoe insole manufacturers and footwear brands often collaborate with each other to create stylish and aesthetically pleasing insoles. This is done to meet the demand for functional support and fashionable footwear.
  • Insoles featuring anti-microbial properties and odor control technologies are some of the newest innovations in this industry. These insoles perfectly match the preferences of consumers seeking products that promote foot health and freshness.

Consumption Analysis in the Shoe Insoles Market

  • Individuals engaged in sports and physical activities form one of the largest consumer groups in the shoe insoles market. These consumers seek insoles to enhance performance and comfort and prevent injury.
  • Individuals with foot conditions like plantar fasciitis, flat feet, or arch problems also use podiatrist-recommended insoles for additional support and relief. In these scenarios, insole manufacturers generally collaborate with these clinics.
  • The rising significance of running as an exercise due to lifestyle-related diseases like diabetes, hypertension, etc., has forced runners to invest in specialized insoles designed for shock absorption, stability, and improved running biomechanics.
  • Hikers, campers, and outdoor enthusiasts also are one of the most significant contributors to this market. They use insoles to improve comfort and performance during extended periods of walking or outdoor activities.
  • Individuals with one foot slightly larger than the other or those dealing with shoe size discrepancies use insoles to get a better fit and comfort in their footwear. Besides this, the aging population also seeks insoles for foot support and pain relief.
Sudip Saha
Sudip Saha

Principal Consultant

Talk to Analyst

Find your sweet spots for generating winning opportunities in this market.

Historical Analysis of the Shoe Insoles Market

The shoe insoles market across the world heavily relies on the overall trends in the footwear industry. The market is also influenced by increasing awareness of foot health, with consumers seeking insoles that offer comfort, support, and solutions for specific foot conditions. Economic conditions, like disposable income, inflation, or supply chain stability, also have a significant impact on the global shoe insoles market. In the last few years, the market for shoe insoles has experienced a series of ups and downs.

In the pandemic, as the world faced sudden shutdowns, the shoe insoles market, in the initial phases, saw a plunge in demand as people refrained from spending on non-essential items. The market also suffered decreased distribution due to the disrupted supply chains. However, with time, as people got accustomed to the new normal, individuals focused on home workouts and outdoor activities. This drove the demand for athletic and performance-oriented insoles in the international marketplace.

Post-pandemic, as the markets opened again, the shoe insoles industry experienced a stabilized revenue growth. The emphasis on health and comfort by the general population all over the world is continuously influencing the demand for high-performance, comfort-giving insoles. In the future, innovations and technological advancements may play a significant role in the market, especially with the growing interest in smart and tech-infused footwear accessories.

Attributes Key Statistics
Historical Market Value (2019) US$ 4,970.2 million
Shoe Insoles Market Value (2023) US$ 5,836.8 million
HCAGR (2019 to 2023) 4.10%

Factors Adversely Affecting the Shoe Insoles Market

The shoe insoles market is a US$ 6 billion industry and is anticipated to grow at a CAGR of 4.50%. Despite the massive size, several factors are slowing down the growth rate for this market.

  • Lack of awareness about the benefits of using insoles, particularly among certain demographic groups, is contributing negatively to the market.
  • The perception that insoles are not universally effective for all foot issues in the minds of the general population, deter potential consumers from opting for shoe insoles.
  • Discomfort during the initial adjustment period when using insoles also deters potential consumers from actively adopting insoles.
  • Alternative solutions, such as specialty footwear or shoes with built-in comfort features, also are affecting the market adversely.
  • Economic downturns or uncertainties, such as pandemics or war-like situations in the region, also harm the overall market.

Get the data you need at a Fraction of the cost

Personalize your report by choosing insights you need
and save 40%!

Category-wise Insights

Global Orthotic Industry Drive Demand for Shoe Insoles

Attributes Details
Top Application Orthotic
Market share in 2024 61.30%

Over the years, shoe insoles have dominated the global orthotic industry, playing a pivotal role in providing personalized comfort, support, and therapeutic solutions for individuals with various foot conditions. They are in great demand in this industry due to the integration of advanced materials and technologies into insoles, which has transformed them from simple cushioning elements to sophisticated orthotic devices.

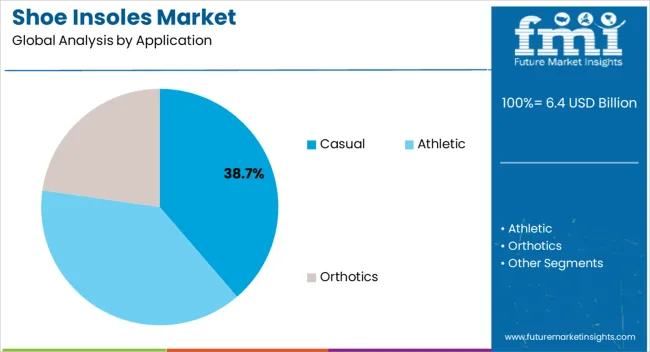
On the basis of application, the orthotic industry dominates the global shoe insoles market with a share of 61.30%. These insoles are designed to address a wide range of orthopedic issues, including arch support, plantar fasciitis, and pronation-related concerns. The market is also experiencing considerable growth as podiatrists often recommend orthotic insoles as part of treatment plans for various musculoskeletal conditions.

Consumer Preference for Foam-based Insoles to Skyrocket over the Coming Years

Attributes Details
Top Material Foam-based
Market share 32.50%

Consumers all over the world, especially those seeking comfort in everyday shoes, have been actively looking for footwear solutions that not only offer a unique combination of comfort and support but also are adaptable to the user’s preferences and activities. Foam-based insoles, such as memory foam, provide a customized and cushioned feel, ensuring optimal support for various foot arch types.

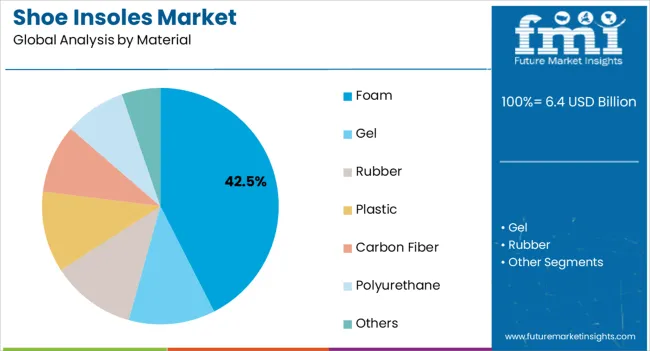
On the basis of material, foam-based shoe insoles dominate the global market with a share of 32.50%. Foam-based insoles are in great demand not just among the day-to-day users but also athletes seeking enhanced performance. These insoles excel in distributing pressure evenly across the foot, reducing impact during daily activities and providing a soft yet supportive foundation.
Country-wise Insights

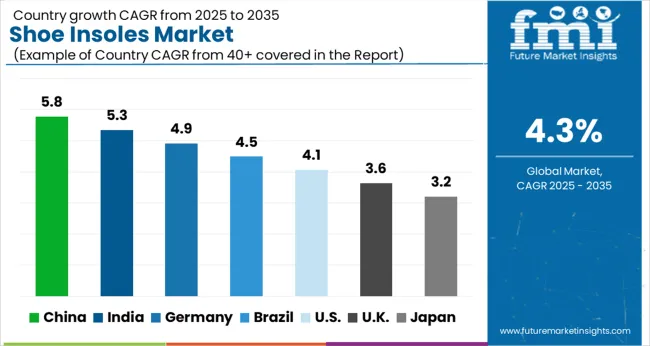
The section provides an analysis of the shoe insoles market by countries, including China, India, Australia, the United States, and Germany. The table presents the CAGR for each country, indicating the expected growth of the market in that country through 2034.

Countries CAGR (2024 to 2034)
India 6.50%
China 6.10%
Australia 4.00%
Germany 3.80%
United States 2.50%

Shoe Insoles Market in India

The Indian shoe insoles market is anticipated to retain its dominance by progressing at a CAGR of 6.50% till 2034.

India is blessed with a significant portion of its population in its youth stage. Increasing disposable incomes, in this demographic, are driving the demand for better quality footwear and accessories, including insoles. The country has also been going through a phase of transition, where the general population is increasingly adopting Western lifestyles, further fueling the growth of the insole market.

Shoe Insoles Market in China

China is another Asian country that is driving market growth. Over the next ten years, the demand for shoe insoles in China is projected to rise at a 6.10% CAGR.

China is home to one of the largest populations in the world. The country’s rapid urbanization has led to lifestyle changes, including increased awareness of health and wellness. Sedentary habits, due to corporatization of jobs, are driving the demand for insoles to enhance foot comfort and address various health issues. The influx of international brands in the country is also one of the main contributors to this exponential growth.

Shoe Insoles Market in Australia

The market in Australia for shoe insoles is poised to showcase a CAGR of 4.00% from 2024 to 2034.

Australia is known for its outdoor culture. Activities like hiking, running, and sports, have driven the demand for specialized insoles that cater to the needs of outdoor enthusiasts. Besides this, the awareness of the impact of footwear on overall health has led to an increased demand for insoles, especially among individuals looking for solutions to common foot problems related to physical activity.
Shoe Insoles Market in Germany

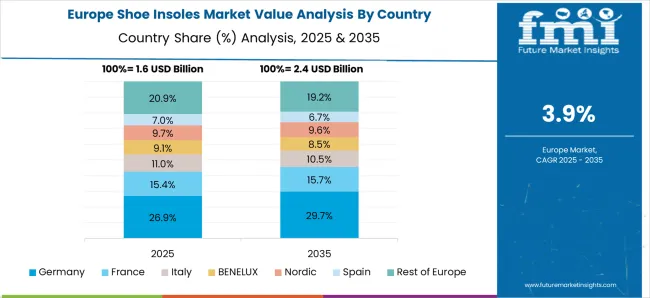
In the European region, Germany is leading the shoe insoles market. The German market is anticipated to register a CAGR of 3.80% through 2034.

The growth in the market in Germany is attributed to consumers seeking high-quality, technologically advanced insoles that provide superior comfort and support. Apart from this, Germany is also home to one of the largest geriatric populations in the world. As individuals age, they become more susceptible to foot-related issues, leading to an increased demand for therapeutic shoe insoles.
Shoe Insoles Market in the United States

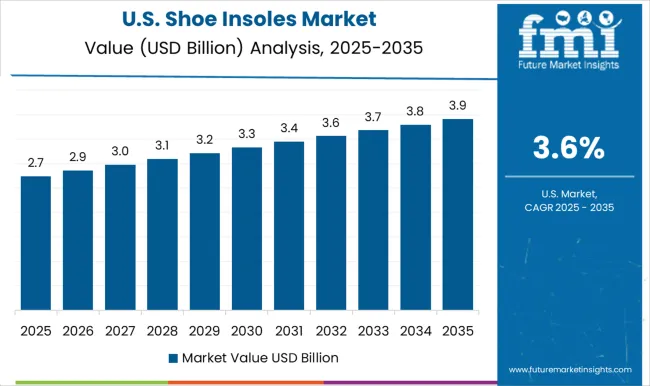
In the North American region, the United States shoe insoles market is anticipated to register a CAGR of 2.50% through 2034.

The rising cases of fatal cardiovascular diseases like hypertension, obesity, and diabetes in the United States has pushed the general population to adopt to an active lifestyle, which includes regular exercises, especially running. As more Americans engage in physical activities, there is a growing demand for insoles that provide comfort and support during exercise, contributing to the overall market growth.
Competitive Landscape in the Shoe Insoles Market

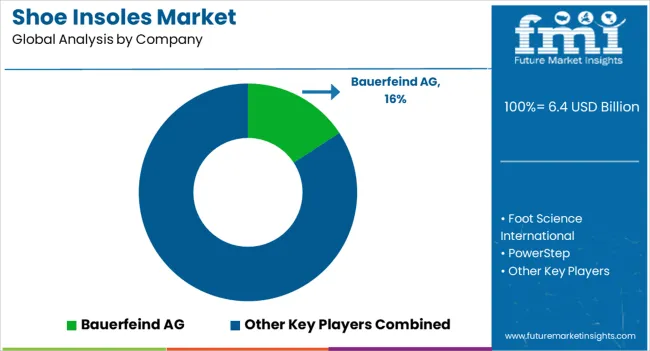
The market for shoe insoles is heavily dominated by a few international brands, such as FootBalance System, PowerStep, Foot Science International, Bauerfeind AG, etc., who have their reach spread across all the major countries in the world. These companies, over a period of time, have built a substantial consumer base.

There is a presence of small companies in the market, too. These companies cater to the demands of regional consumers. Small companies have to face challenges, like lower profit margins, limited financial resources for research and development, and restricted marketing capabilities.

Recent Developments

  • Top of FormIn June 2021, Superfeet, the global insole industry leader and innovator, announced a partnership with private equity firm Westward Partners, as the Seattle-based company assumed majority ownership in the fast-growing industry stalwart.
  • At At Medica 2023, dBio unveiled gMOT Cloud, the AIoT Smart Insole. This innovative device offered accurate and hands-free monitoring for activities like gait analysis and sports, ensuring comfortable wear and uninterrupted training.
  • Baffin recently launched the YELLOWKNIFE CUFF, a new winter boot for women made in Canada. The boot emphasizes functionality with a removable anti-fatigue insole, providing reliable comfort across various climates and landscapes.

Key Companies in the Shoe Insoles Market

  • Bauerfeind AG
  • Foot Science International
  • PowerStep
  • SOLO Laboratories, Inc.
  • Spenco Medical Corporation
  • Superfeet Worldwide, Inc.
  • Texon International Group
  • FootBalance System Ltd.
  • CURREX
  • Sidas
  • ENERTOR
  • PROFOOT Inc.
  • Rehband
  • YONEX Co., Ltd.
  • Asics Corporation
  • Aetrex Inc.
  • Decathlon (Aptonia)
  • Li Ning (China) Sports Goods Co., Ltd.
  • Scholl’s Wellness Co.
  • New Balance Athletics, Inc.

Market Segmentation

By Application:

  • Casual
  • Athletic
  • Orthotics

By Material:

  • Foam
  • Gel
  • Rubber
  • Plastic
  • Carbon Fiber
  • Polyurethane
  • Others

By Gender:

  • Men
  • Women

By Price Outlook :

  • Economy
  • Medium
  • Premium

By Region:

  • North America
  • Europe
  • Latin America
  • Asia Pacific
  • Middle East and Africa

Frequently Asked Questions

How Big is the Shoe Insoles Market?

The global shoe insoles market size was estimated at US$ 6122.8 million in 2024.

What is the Market Outlook over the Forecast Period?

The global market is expected to grow at a CAGR of 4.5% from 2024 to 2034.

Who are the Key Players in the Market?

Key market players are Bauerfeind AG, Foot Science International, PowerStep, SOLO Laboratories, Inc., etc.

Which is the Highly Preferred Material in the Market?

Foam-based soles dominate the market with a share of 32.50%.

How Big will the Market Be by 2034?

The market is anticipated to reach a valuation of US$ 9,508.5 million by 2034.

Table of Content
1. Executive Summary
    1.1. Global Market Outlook
    1.2. Demand-side Trends
    1.3. Supply-side Trends
    1.4. Technology Roadmap Analysis
    1.5. Analysis and Recommendations
2. Market Overview
    2.1. Market Coverage / Taxonomy
    2.2. Market Definition / Scope / Limitations
3. Market Background
    3.1. Market Dynamics
        3.1.1. Drivers
        3.1.2. Restraints
        3.1.3. Opportunity
        3.1.4. Trends
    3.2. Scenario Forecast
        3.2.1. Demand in Optimistic Scenario
        3.2.2. Demand in Likely Scenario
        3.2.3. Demand in Conservative Scenario
    3.3. Opportunity Map Analysis
    3.4. Product Life Cycle Analysis
    3.5. Supply Chain Analysis
        3.5.1. Supply Side Participants and their Roles
            3.5.1.1. Producers
            3.5.1.2. Mid-Level Participants (Traders/ Agents/ Brokers)
            3.5.1.3. Wholesalers and Distributors
        3.5.2. Value Added and Value Created at Node in the Supply Chain
        3.5.3. List of Raw Material Suppliers
        3.5.4. List of Existing and Potential Buyer’s
    3.6. Investment Feasibility Matrix
    3.7. Value Chain Analysis
        3.7.1. Profit Margin Analysis
        3.7.2. Wholesalers and Distributors
        3.7.3. Retailers
    3.8. PESTLE and Porter’s Analysis
    3.9. Regulatory Landscape
        3.9.1. By Key Regions
        3.9.2. By Key Countries
    3.10. Regional Parent Market Outlook
    3.11. Production and Consumption Statistics
    3.12. Import and Export Statistics
4. Global Market Analysis 2019 to 2023 and Forecast, 2024 to 2034
    4.1. Historical Market Size Value (US$ Million) & Volume (Pairs) Analysis, 2019 to 2023
    4.2. Current and Future Market Size Value (US$ Million) & Volume (Pairs) Projections, 2024 to 2034
        4.2.1. Y-o-Y Growth Trend Analysis
        4.2.2. Absolute $ Opportunity Analysis
5. Global Market Analysis 2019 to 2023 and Forecast 2024 to 2034, By Application
    5.1. Introduction / Key Findings
    5.2. Historical Market Size Value (US$ Million) & Volume (Pairs) Analysis By Application, 2019 to 2023
    5.3. Current and Future Market Size Value (US$ Million) & Volume (Pairs) Analysis and Forecast By Application, 2024 to 2034
        5.3.1. Casual
        5.3.2. Athletic
        5.3.3. Orthotics
    5.4. Y-o-Y Growth Trend Analysis By Application, 2019 to 2023
    5.5. Absolute $ Opportunity Analysis By Application, 2024 to 2034
6. Global Market Analysis 2019 to 2023 and Forecast 2024 to 2034, By Material
    6.1. Introduction / Key Findings
    6.2. Historical Market Size Value (US$ Million) & Volume (Pairs) Analysis By Material, 2019 to 2023
    6.3. Current and Future Market Size Value (US$ Million) & Volume (Pairs) Analysis and Forecast By Material, 2024 to 2034
        6.3.1. Foam
        6.3.2. Gel
        6.3.3. Rubber
        6.3.4. Plastic
        6.3.5. Carbon Fibre
        6.3.6. Polyurethane
        6.3.7. Others
    6.4. Y-o-Y Growth Trend Analysis By Material, 2019 to 2023
    6.5. Absolute $ Opportunity Analysis By Material, 2024 to 2034
7. Global Market Analysis 2019 to 2023 and Forecast 2024 to 2034, By End-use
    7.1. Introduction / Key Findings
    7.2. Historical Market Size Value (US$ Million) & Volume (Pairs) Analysis By End-use, 2019 to 2023
    7.3. Current and Future Market Size Value (US$ Million) & Volume (Pairs) Analysis and Forecast By End-use, 2024 to 2034
        7.3.1. Men
        7.3.2. Women
    7.4. Y-o-Y Growth Trend Analysis By End-use, 2019 to 2023
    7.5. Absolute $ Opportunity Analysis By End-use, 2024 to 2034
8. Global Market Analysis 2019 to 2023 and Forecast 2024 to 2034, By Price
    8.1. Introduction / Key Findings
    8.2. Historical Market Size Value (US$ Million) & Volume (Pairs) Analysis By Price, 2019 to 2023
    8.3. Current and Future Market Size Value (US$ Million) & Volume (Pairs) Analysis and Forecast By Price, 2024 to 2034
        8.3.1. Economy
        8.3.2. Medium
        8.3.3. Premium
    8.4. Y-o-Y Growth Trend Analysis By Price, 2019 to 2023
    8.5. Absolute $ Opportunity Analysis By Price, 2024 to 2034
9. Global Market Analysis 2019 to 2023 and Forecast 2024 to 2034, By Region
    9.1. Introduction
    9.2. Historical Market Size Value (US$ Million) & Volume (Pairs) Analysis By Region, 2019 to 2023
    9.3. Current Market Size Value (US$ Million) & Volume (Pairs) Analysis and Forecast By Region, 2024 to 2034
        9.3.1. North America
        9.3.2. Latin America
        9.3.3. Europe
        9.3.4. East Asia
        9.3.5. South Asia
        9.3.6. Oceania
        9.3.7. MEA
    9.4. Market Attractiveness Analysis By Region
10. North America Market Analysis 2019 to 2023 and Forecast 2024 to 2034, By Country
    10.1. Historical Market Size Value (US$ Million) & Volume (Pairs) Trend Analysis By Market Taxonomy, 2019 to 2023
    10.2. Market Size Value (US$ Million) & Volume (Pairs) Forecast By Market Taxonomy, 2024 to 2034
        10.2.1. By Country
            10.2.1.1. USA
            10.2.1.2. Canada
        10.2.2. By Application
        10.2.3. By Material
        10.2.4. By End-use
        10.2.5. By Price
    10.3. Market Attractiveness Analysis
        10.3.1. By Country
        10.3.2. By Application
        10.3.3. By Material
        10.3.4. By End-use
        10.3.5. By Price
    10.4. Key Takeaways
11. Latin America Market Analysis 2019 to 2023 and Forecast 2024 to 2034, By Country
    11.1. Historical Market Size Value (US$ Million) & Volume (Pairs) Trend Analysis By Market Taxonomy, 2019 to 2023
    11.2. Market Size Value (US$ Million) & Volume (Pairs) Forecast By Market Taxonomy, 2024 to 2034
        11.2.1. By Country
            11.2.1.1. Brazil
            11.2.1.2. Mexico
            11.2.1.3. Argentina
            11.2.1.4. Rest of Latin America
        11.2.2. By Application
        11.2.3. By Material
        11.2.4. By End-use
        11.2.5. By Price
    11.3. Market Attractiveness Analysis
        11.3.1. By Country
        11.3.2. By Application
        11.3.3. By Material
        11.3.4. By End-use
        11.3.5. By Price
    11.4. Key Takeaways
12. Europe Market Analysis 2019 to 2023 and Forecast 2024 to 2034, By Country
    12.1. Historical Market Size Value (US$ Million) & Volume (Pairs) Trend Analysis By Market Taxonomy, 2019 to 2023
    12.2. Market Size Value (US$ Million) & Volume (Pairs) Forecast By Market Taxonomy, 2024 to 2034
        12.2.1. By Country
            12.2.1.1. Germany
            12.2.1.2. Italy
            12.2.1.3. France
            12.2.1.4. UK
            12.2.1.5. Spain
            12.2.1.6. Russia
            12.2.1.7. BENELUX
            12.2.1.8. Rest of Europe
        12.2.2. By Application
        12.2.3. By Material
        12.2.4. By End-use
        12.2.5. By Price
    12.3. Market Attractiveness Analysis
        12.3.1. By Country
        12.3.2. By Application
        12.3.3. By Material
        12.3.4. By End-use
        12.3.5. By Price
    12.4. Key Takeaways
13. East Asia Market Analysis 2019 to 2023 and Forecast 2024 to 2034, By Country
    13.1. Historical Market Size Value (US$ Million) & Volume (Pairs) Trend Analysis By Market Taxonomy, 2019 to 2023
    13.2. Market Size Value (US$ Million) & Volume (Pairs) Forecast By Market Taxonomy, 2024 to 2034
        13.2.1. By Country
            13.2.1.1. China
            13.2.1.2. Japan
            13.2.1.3. South Korea
        13.2.2. By Application
        13.2.3. By Material
        13.2.4. By End-use
        13.2.5. By Price
    13.3. Market Attractiveness Analysis
        13.3.1. By Country
        13.3.2. By Application
        13.3.3. By Material
        13.3.4. By End-use
        13.3.5. By Price
    13.4. Key Takeaways
14. South Asia Market Analysis 2019 to 2023 and Forecast 2024 to 2034, By Country
    14.1. Historical Market Size Value (US$ Million) & Volume (Pairs) Trend Analysis By Market Taxonomy, 2019 to 2023
    14.2. Market Size Value (US$ Million) & Volume (Pairs) Forecast By Market Taxonomy, 2024 to 2034
        14.2.1. By Country
            14.2.1.1. India
            14.2.1.2. Thailand
            14.2.1.3. Malaysia
            14.2.1.4. Indonesia
            14.2.1.5. Rest of South Asia
        14.2.2. By Application
        14.2.3. By Material
        14.2.4. By End-use
        14.2.5. By Price
    14.3. Market Attractiveness Analysis
        14.3.1. By Country
        14.3.2. By Application
        14.3.3. By Material
        14.3.4. By End-use
        14.3.5. By Price
    14.4. Key Takeaways
15. Oceania Market Analysis 2019 to 2023 and Forecast 2024 to 2034, By Country
    15.1. Historical Market Size Value (US$ Million) & Volume (Pairs) Trend Analysis By Market Taxonomy, 2019 to 2023
    15.2. Market Size Value (US$ Million) & Volume (Pairs) Forecast By Market Taxonomy, 2024 to 2034
        15.2.1. By Country
            15.2.1.1. Australia
            15.2.1.2. New Zealand
        15.2.2. By Application
        15.2.3. By Material
        15.2.4. By End-use
        15.2.5. By Price
    15.3. Market Attractiveness Analysis
        15.3.1. By Country
        15.3.2. By Application
        15.3.3. By Material
        15.3.4. By End-use
        15.3.5. By Price
    15.4. Key Takeaways
16. MEA Market Analysis 2019 to 2023 and Forecast 2024 to 2034, By Country
    16.1. Historical Market Size Value (US$ Million) & Volume (Pairs) Trend Analysis By Market Taxonomy, 2019 to 2023
    16.2. Market Size Value (US$ Million) & Volume (Pairs) Forecast By Market Taxonomy, 2024 to 2034
        16.2.1. By Country
            16.2.1.1. GCC
            16.2.1.2. Rest of MEA
        16.2.2. By Application
        16.2.3. By Material
        16.2.4. By End-use
        16.2.5. By Price
    16.3. Market Attractiveness Analysis
        16.3.1. By Country
        16.3.2. By Application
        16.3.3. By Material
        16.3.4. By End-use
        16.3.5. By Price
    16.4. Key Takeaways
17. Key Countries Market Analysis
    17.1. USA
        17.1.1. Pricing Analysis
        17.1.2. Market Share Analysis, 2023
            17.1.2.1. By Application
            17.1.2.2. By Material
            17.1.2.3. By End-use
            17.1.2.4. By Price
    17.2. Canada
        17.2.1. Pricing Analysis
        17.2.2. Market Share Analysis, 2023
            17.2.2.1. By Application
            17.2.2.2. By Material
            17.2.2.3. By End-use
            17.2.2.4. By Price
    17.3. Brazil
        17.3.1. Pricing Analysis
        17.3.2. Market Share Analysis, 2023
            17.3.2.1. By Application
            17.3.2.2. By Material
            17.3.2.3. By End-use
            17.3.2.4. By Price
    17.4. Mexico
        17.4.1. Pricing Analysis
        17.4.2. Market Share Analysis, 2023
            17.4.2.1. By Application
            17.4.2.2. By Material
            17.4.2.3. By End-use
            17.4.2.4. By Price
    17.5. Argentina
        17.5.1. Pricing Analysis
        17.5.2. Market Share Analysis, 2023
            17.5.2.1. By Application
            17.5.2.2. By Material
            17.5.2.3. By End-use
            17.5.2.4. By Price
    17.6. Germany
        17.6.1. Pricing Analysis
        17.6.2. Market Share Analysis, 2023
            17.6.2.1. By Application
            17.6.2.2. By Material
            17.6.2.3. By End-use
            17.6.2.4. By Price
    17.7. Italy
        17.7.1. Pricing Analysis
        17.7.2. Market Share Analysis, 2023
            17.7.2.1. By Application
            17.7.2.2. By Material
            17.7.2.3. By End-use
            17.7.2.4. By Price
    17.8. France
        17.8.1. Pricing Analysis
        17.8.2. Market Share Analysis, 2023
            17.8.2.1. By Application
            17.8.2.2. By Material
            17.8.2.3. By End-use
            17.8.2.4. By Price
    17.9. UK
        17.9.1. Pricing Analysis
        17.9.2. Market Share Analysis, 2023
            17.9.2.1. By Application
            17.9.2.2. By Material
            17.9.2.3. By End-use
            17.9.2.4. By Price
    17.10. Spain
        17.10.1. Pricing Analysis
        17.10.2. Market Share Analysis, 2023
            17.10.2.1. By Application
            17.10.2.2. By Material
            17.10.2.3. By End-use
            17.10.2.4. By Price
    17.11. Russia
        17.11.1. Pricing Analysis
        17.11.2. Market Share Analysis, 2023
            17.11.2.1. By Application
            17.11.2.2. By Material
            17.11.2.3. By End-use
            17.11.2.4. By Price
    17.12. BENELUX
        17.12.1. Pricing Analysis
        17.12.2. Market Share Analysis, 2023
            17.12.2.1. By Application
            17.12.2.2. By Material
            17.12.2.3. By End-use
            17.12.2.4. By Price
    17.13. China
        17.13.1. Pricing Analysis
        17.13.2. Market Share Analysis, 2023
            17.13.2.1. By Application
            17.13.2.2. By Material
            17.13.2.3. By End-use
            17.13.2.4. By Price
    17.14. Japan
        17.14.1. Pricing Analysis
        17.14.2. Market Share Analysis, 2023
            17.14.2.1. By Application
            17.14.2.2. By Material
            17.14.2.3. By End-use
            17.14.2.4. By Price
    17.15. South Korea
        17.15.1. Pricing Analysis
        17.15.2. Market Share Analysis, 2023
            17.15.2.1. By Application
            17.15.2.2. By Material
            17.15.2.3. By End-use
            17.15.2.4. By Price
    17.16. India
        17.16.1. Pricing Analysis
        17.16.2. Market Share Analysis, 2023
            17.16.2.1. By Application
            17.16.2.2. By Material
            17.16.2.3. By End-use
            17.16.2.4. By Price
    17.17. Thailand
        17.17.1. Pricing Analysis
        17.17.2. Market Share Analysis, 2023
            17.17.2.1. By Application
            17.17.2.2. By Material
            17.17.2.3. By End-use
            17.17.2.4. By Price
    17.18. Malaysia
        17.18.1. Pricing Analysis
        17.18.2. Market Share Analysis, 2023
            17.18.2.1. By Application
            17.18.2.2. By Material
            17.18.2.3. By End-use
            17.18.2.4. By Price
    17.19. Indonesia
        17.19.1. Pricing Analysis
        17.19.2. Market Share Analysis, 2023
            17.19.2.1. By Application
            17.19.2.2. By Material
            17.19.2.3. By End-use
            17.19.2.4. By Price
    17.20. Australia
        17.20.1. Pricing Analysis
        17.20.2. Market Share Analysis, 2023
            17.20.2.1. By Application
            17.20.2.2. By Material
            17.20.2.3. By End-use
            17.20.2.4. By Price
    17.21. New Zealand
        17.21.1. Pricing Analysis
        17.21.2. Market Share Analysis, 2023
            17.21.2.1. By Application
            17.21.2.2. By Material
            17.21.2.3. By End-use
            17.21.2.4. By Price
    17.22. GCC Countries
        17.22.1. Pricing Analysis
        17.22.2. Market Share Analysis, 2023
            17.22.2.1. By Application
            17.22.2.2. By Material
            17.22.2.3. By End-use
            17.22.2.4. By Price
18. Market Structure Analysis
    18.1. Competition Dashboard
    18.2. Competition Benchmarking
    18.3. Market Share Analysis of Top Players
        18.3.1. By Regional
        18.3.2. By Application
        18.3.3. By Material
        18.3.4. By End-use
        18.3.5. By Price
19. Competition Analysis
    19.1. Competition Deep Dive
        19.1.1. Bauerfeind AG
            19.1.1.1. Overview
            19.1.1.2. Product Portfolio
            19.1.1.3. Profitability by Market Segments
            19.1.1.4. Sales Footprint
            19.1.1.5. Strategy Overview
                19.1.1.5.1. Marketing Strategy
                19.1.1.5.2. Product Strategy
                19.1.1.5.3. Channel Strategy
        19.1.2. Foot Science International
            19.1.2.1. Overview
            19.1.2.2. Product Portfolio
            19.1.2.3. Profitability by Market Segments
            19.1.2.4. Sales Footprint
            19.1.2.5. Strategy Overview
                19.1.2.5.1. Marketing Strategy
                19.1.2.5.2. Product Strategy
                19.1.2.5.3. Channel Strategy
        19.1.3. PowerStep
            19.1.3.1. Overview
            19.1.3.2. Product Portfolio
            19.1.3.3. Profitability by Market Segments
            19.1.3.4. Sales Footprint
            19.1.3.5. Strategy Overview
                19.1.3.5.1. Marketing Strategy
                19.1.3.5.2. Product Strategy
                19.1.3.5.3. Channel Strategy
        19.1.4. SOLO Laboratories, Inc.
            19.1.4.1. Overview
            19.1.4.2. Product Portfolio
            19.1.4.3. Profitability by Market Segments
            19.1.4.4. Sales Footprint
            19.1.4.5. Strategy Overview
                19.1.4.5.1. Marketing Strategy
                19.1.4.5.2. Product Strategy
                19.1.4.5.3. Channel Strategy
        19.1.5. Spenco Medical Corporation
            19.1.5.1. Overview
            19.1.5.2. Product Portfolio
            19.1.5.3. Profitability by Market Segments
            19.1.5.4. Sales Footprint
            19.1.5.5. Strategy Overview
                19.1.5.5.1. Marketing Strategy
                19.1.5.5.2. Product Strategy
                19.1.5.5.3. Channel Strategy
        19.1.6. Superfeet Worldwide, Inc.
            19.1.6.1. Overview
            19.1.6.2. Product Portfolio
            19.1.6.3. Profitability by Market Segments
            19.1.6.4. Sales Footprint
            19.1.6.5. Strategy Overview
                19.1.6.5.1. Marketing Strategy
                19.1.6.5.2. Product Strategy
                19.1.6.5.3. Channel Strategy
        19.1.7. Texon International Group
            19.1.7.1. Overview
            19.1.7.2. Product Portfolio
            19.1.7.3. Profitability by Market Segments
            19.1.7.4. Sales Footprint
            19.1.7.5. Strategy Overview
                19.1.7.5.1. Marketing Strategy
                19.1.7.5.2. Product Strategy
                19.1.7.5.3. Channel Strategy
        19.1.8. FootBalance System Ltd.
            19.1.8.1. Overview
            19.1.8.2. Product Portfolio
            19.1.8.3. Profitability by Market Segments
            19.1.8.4. Sales Footprint
            19.1.8.5. Strategy Overview
                19.1.8.5.1. Marketing Strategy
                19.1.8.5.2. Product Strategy
                19.1.8.5.3. Channel Strategy
        19.1.9. CURREX
            19.1.9.1. Overview
            19.1.9.2. Product Portfolio
            19.1.9.3. Profitability by Market Segments
            19.1.9.4. Sales Footprint
            19.1.9.5. Strategy Overview
                19.1.9.5.1. Marketing Strategy
                19.1.9.5.2. Product Strategy
                19.1.9.5.3. Channel Strategy
        19.1.10. Sidas
            19.1.10.1. Overview
            19.1.10.2. Product Portfolio
            19.1.10.3. Profitability by Market Segments
            19.1.10.4. Sales Footprint
            19.1.10.5. Strategy Overview
                19.1.10.5.1. Marketing Strategy
                19.1.10.5.2. Product Strategy
                19.1.10.5.3. Channel Strategy
        19.1.11. ENERTOR
            19.1.11.1. Overview
            19.1.11.2. Product Portfolio
            19.1.11.3. Profitability by Market Segments
            19.1.11.4. Sales Footprint
            19.1.11.5. Strategy Overview
                19.1.11.5.1. Marketing Strategy
                19.1.11.5.2. Product Strategy
                19.1.11.5.3. Channel Strategy
20. Assumptions & Acronyms Used
21. Research Methodology
Recommendations

Consumer Product

Shoe Insert Market

August 2024

REP-GB-8703

335 pages

Consumer Product

Smart Shoes Market

January 2023

REP-GB-9482

325 pages

Explore Consumer Product Insights

View Reports
Future Market Insights

Shoe Insoles Market

Schedule a Call