Reports

- Global Locations -

Headquarters

Future Market Insights, Inc.

Christiana Corporate, 200
Continental Drive, Suite 401,
Newark, Delaware - 19713,
United States

T: +1-845-579-5705

Americas

Future Market Insights, Inc.

616 Corporate Way, Suite 2-9018,
Valley Cottage, NY 10989, United States

T: +1-347-918-3531

MEA

Future Market Insights

1602-6 Jumeirah Bay X2 Tower, Plot No: JLT-PH2-X2A,
Jumeirah Lakes Towers, Dubai,
United Arab Emirates

Europe

Future Market Insights

3rd Floor, 207 Regent Street,
W1B 3HH London
United Kingdom

T: + 44 (0) 20 8123 9659
D: +44 (0) 20 3287 4268

Asia Pacific

Future Market Insights

IndiaLand Global Tech Park, Unit UG-1, Behind Grand HighStreet, Phase 1, Hinjawadi, MH, Pune – 411057, India

Shoe Insert Market Outlook

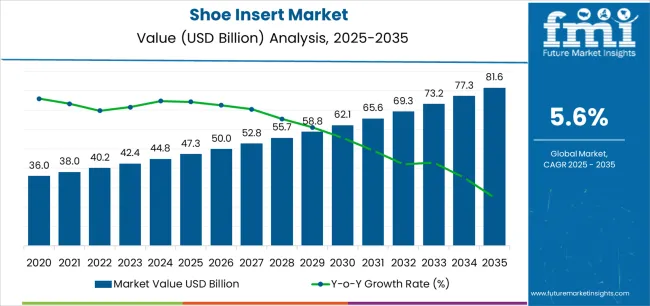
FMI projected that the global shoe insert market is likely to increase from US$ 42.38 billion in 2023 to US$ 71.68 billion by 2033. Due to the rising prevalence of arthritis, foot misalignment, and discomfort during sporting activities, the demand for shoe inserts is predicted to witness sustained profitability, with a CAGR of 5.4% expected by 2033.

Surging demand for customized shoe inserts for orthopedic patients is expected to fuel sales in the market. In 2020, the orthopedic shoe inserts market represented a 15.2% share of the global shoe insert industry.

These products are tailor-made according to the foot structure of the user. They are clinically proven to have various advantages over prefabricated inserts in terms of comfort and better pain management.

Besides this, increasing utilization of 3D printing for manufacturing custom and prefabricated shoe inserts augments the growth in the market. 3D-printed shoe inserts are thinner and offer increased gait efficiency. Due to this trend, the global shoe inserts sector is anticipated to have a Y-o-Y growth of 5.6% between 2022 and 2023.

Attributes Details
Shoe Insert Market CAGR (2023 to 2033) 5.4%
Shoe Insert Market Size (2023) US$ 42.38 billion
Shoe Insert Market Size (2033) US$ 71.68 billion

Don't pay for what you don't need

Customize your report by selecting specific countries or regions and save 30%!

2018 to 2021 Shoe Insert Business Outlook in Comparison to 2023 to 2033 Growth Forecast

Demand for shoe inserts is forecast to increase at a 5.4% CAGR, in comparison with the 4.3% CAGR registered between 2018 to 2022.

Future Market Insights predict a comparison and review analysis of the dynamics of the shoe insert sector, which is principally subjected to an array of industry factors, along with a few definite influences concerning viewpoints that support industry innovation.

Particulars Details
H1, 2021 (A) 5.9%
H1, 2022 Projected (P) 6.0%
H1, 2022 Outlook (O) 6.6%
BPS: H1,2022 (O) - H1, 2022 (P) (+) 60↑
BPS: H1,2022 (O) - H1, 2021 (A) (+) 66↑

Some new advances that have taken place in the market include manufacturers producing sustainable, eco-friendly, and recyclable materials. Moreover, companies provide customization of shoe inserts by consumers’ preferences.

In February 2022, Foot Solutions, Inc., one of the leading global retailers of wellness footwear and custom orthotic insoles, acquired Florida-based Happy Feet Plus Inc. to expand its presence across North America.

Despite these prospects, there are some likely challenges that stay ahead for the industry, which include manufacturers offering various shoe inserts via online channels. Manufacturers are integrating augmented reality (AR) on their websites to enable consumers to see how the shoe insert fits in their respective shoes virtually.

Short-term growth (2023 to 2026): Patient healthcare reimbursement plans in various countries are anticipated to spur the sales of shoe inserts during this period.

Medium-term growth (2027 to 2030): Increasing focus and expenditure on high-quality healthcare products for added comfort and convenience continue pushing adoption in the market.

Long-term growth (2031 to 2033): In response to the growing trend of online retail, manufacturers are offering various shoe inserts via online channels and third-party retail platforms such as Amazon. This is likely to create lucrative opportunities for consumers, as well as shoe insert manufacturers.

Taking historical growth into account, producers appear to have a high possibility of engagement in several projects. The market had a 2018 value of US$ 33.98 billion which reached US$ 40.15 billion in 2022.

What are the Key Trends Driving Sales of Shoe Inserts?

Increasing Focus on Comfort and Foot Alignment Among Athletes Drive Sales of Plantar Fasciitis Insoles.

  • Increasing participation in sports and fitness activities among consumers across the globe is spurring demand for comfortable and effective foot inserts. Sports activities and extensive workout routines increase the risk of foot injuries.
  • For individuals dealing with foot misalignment, the usage of shoe inserts can be beneficial. It has a high impact on joints during extensive sports and gym activities, which results in pain, discomfort, and ailments of the feet.
  • Memory foam shoe inserts are the most popular type among consumers, accounting for an estimated 40% of the shoe insert sector. The memory foam shoe inserts market has grown significantly over the past few years as a result of the best comfort and cushioning they offer for the foot.
  • Gel shoe inserts may also support the arch and ease foot pain in people with conditions like plantar fasciitis. In the upcoming years, the gel shoe inserts market is expected to rise because of the rising need for customized foot orthotics.
Sneha Verghese
Sneha Verghese

Principal Consultant

Talk to Analyst

Find your sweet spots for generating winning opportunities in this market.

Growing Popularity of 3D Printed Shoe Inserts Bolster Demand in the Market

  • Rising adoption of 3D printing technology for manufacturing various types of shoe inserts is anticipated to boost market share.
  • Manufacturers are leveraging cutting-edge technologies to reduce manufacturing time and improve the quality of shoe inserts to offer optimal comfort and support.
  • Consumers are seeking comfortable, cushioned, lightweight, and durable footwear solutions for sports activities and casual wearing purposes.
  • In response to this, players are investing in research and development to devise new materials that are lightweight and offer effective cushioning to the feet while pursuing different activities.

Comparative View of Shoe Insert Market

Shoe Insert Market:

Attributes Shoe Insert Market
CAGR (2023 to 2033) 5.4%
Market Value (2033) US$ 71.68 billion
Growth Factor Surging sports and fitness activities
Opportunity Demand for customized shoe inserts
Key Trends Recent trend of 3D-printed shoe insert

Electric Shoe Dryer Market:

Attributes Electric Shoe Dryer Market
CAGR (2023 to 2033) 4.9%
Market Value (2033) US$ 118.09 billion
Growth Factor Surging demand for lifestyle products
Opportunity Rising e-commerce industry
Key Trends Contribution of automotive and chemical industry

Bicycle Shoe Market:

Attributes Bicycle Shoe Market
CAGR (2023 to 2033) 5.3%
Market Value (2033) US$ 1.95 billion
Growth Factor Female bicycle involvement is rising
Opportunity Growing leisure activities in the past few years
Key Trends Surging trend of custom bicycle shoes

Get the data you need at a Fraction of the cost

Personalize your report by choosing insights you need
and save 40%!

Country-Wise Insights

Country Market Share (2022)
United States 69.8%
China 34.9%
India 29.5%
Germany 19.9%
Japan 32.0%
Australia 53.5%

How is the United States Shoe Insert Industry Faring?

Increasing Incidence of Arthritis is Spurring Demand for Orthotic Insoles.

Demand for shoe inserts is expected to increase at a 4.4% CAGR in the United States on the back of a growing focus on personal health and well-being among consumers. The presence of favorable patient reimbursement plans in the country is boosting sales of orthopedic insoles in the country.

The rising prevalence of lifestyle-related disorders, such as diabetes and obesity, is compelling consumers to indulge in personal fitness and outdoor recreational activities. Foot comfort is paramount while performing such activities, which in turn is boosting the demand for casual and sports shoe inserts.

As per FMI, the United States market is anticipated to offer an absolute dollar opportunity of US$ 3,083 million over the forecast period.

What is Driving the United Kingdom Shoe Insert Demand?

Growing Focus on Feet Alignment is Driving Sales of Arch Support Insoles

The United Kingdom is expected to emerge as a lucrative pocket in the Europe shoe insert sector, with demand increasing at a 2.9% CAGR over the assessment period. Growth can be attributed to the increasing preference for shoe inserts to deal with flat feet and foot misalignment.

Besides this, an increasing influx of medical tourists in the country for various orthopedic conditions is anticipated to spur demand in the market. The presence of leading market players in the United Kingdom is a chief factor expected to boost demand for shoe inserts in the forthcoming years.

What is the China Shoe Insert Business Outlook?

Rising Participation in Sports Activities is Bolstering Demand for Custom Insoles.

China is expected to account for a dominant share in the East Asia market over the assessment period, with sales expanding at a 6.1% CAGR through 2033. Growth can be attributed to the increasing adoption of 3D printing for manufacturing shoe inserts for various activities and purposes.

Consumers in China are actively participating in sports and fitness activities, which is driving demand for custom shoe inserts. Manufacturers are offering customized solutions to cater to the growing demand, which is anticipated to fuel the growth in the market. The China shoe insert sector is forecast to offer an absolute dollar opportunity of US$ 161.4 million by 2033.

How the Indian Market Contributes to the Large Consumer Base?

The market in India is driven by the increased desire for comfortable and personalized shoes among the working population and the growing awareness of ergonomics. Furthermore, a greater demand for shoe inserts for heels is anticipated as a result of increased middle-class disposable incomes and increasing working women.

In the upcoming years, the market is anticipated to see an increase in participants due to the rising need for shoe inserts. Superfeet, Spenco, and Powerstep are a few of the top manufacturers in the industry. These businesses are putting their efforts into creating cutting-edge items that meet the demands of their clients.

Category-Wise Insights

Which is the Dominant Consumer Orientation and Size in the Market?

Sales of Shoe Inserts for Women likely to Gain Traction

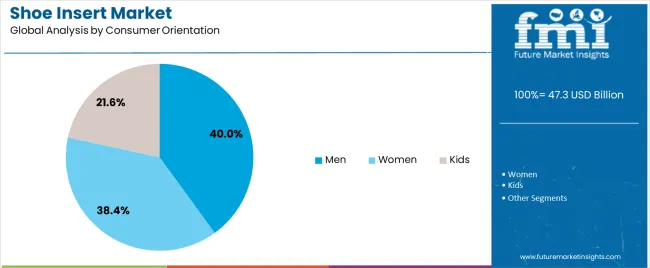
The female segment is expected to expand at a considerable pace on the back of increasing preference for footwear that offers a combination of style and comfort.

Size 8-9 Shoe Inserts Are Most Preferred Among Consumers

In terms of size, the 8-9 USA size segment is anticipated to account for a dominant share of the global market. However, demand in the 6-7 size segment is also projected to gain traction over the forthcoming years due to wide availability across online and offline channels.

Which is the Most Popular Product Type and Material for Shoe Inserts?

Athletes are Preferring Sports Shoe Inserts for Added Comfort

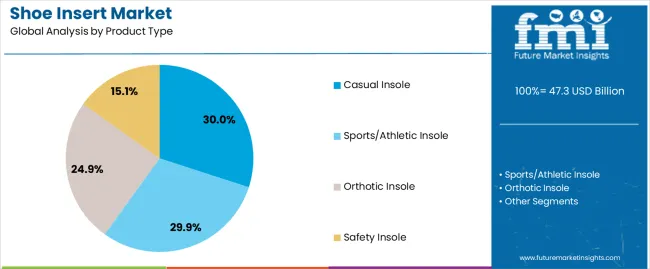
By product type, sales in the sports/athletic shoe insert segment are expected to gain traction over the forecast period owing to increasing participation in sports and fitness activities among individuals. These activities involve dynamic movement of legs and feet, which requires optimal support and comfort. Orthotic insoles led the market with a share of 44.0% in 2022.

Silicone Shoe Inserts to Remain Highly Sought After

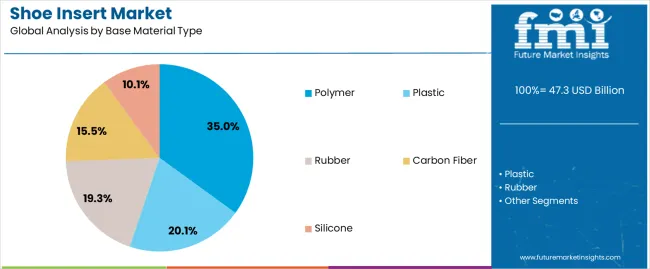
Rubber dominated the market with a share of 26% in 2022. Silicone is expected to remain the most preferred material for shoe inserts. The emergence of gel shoe inserts is expected to drive sales in this segment.

Silicone shoe inserts are softer, offer more cushioning, and can be fitted in various types of shoes. These factors are anticipated to drive applications of silicone for manufacturing shoe inserts.

Which is the Dominant Sales Channel?

Sales of Shoe Inserts through Indirect Sales Channels Gain Momentum

Based on sales channels, the indirect segment is expected to expand at a steady pace over the forecast period. Increasing availability of various types of shoe inserts at supermarkets, hypermarkets, specialty stores, and online channels is expected to augment sales in this segment.

Consumers can try shoe inserts at stores to experience the level of comfort before buying them. These factors are expected to drive sales in this segment over the forecast period.

Customized Insoles: Target for Shoe Insert Manufacturers

To increase revenue, key firms are investing more in research and development for the incorporation of cutting-edge materials in shoe insoles. The utilization of cutting-edge materials to produce high-quality and comfy insoles for their clients is fiercely competitive among well-known businesses.

For instance:

  • In February 2022, Foot Solutions, Inc., one of the leading global retailers of wellness footwear and custom orthotic insoles, acquired Florida-based Happy Feet Plus Inc. to expand its presence across North America.
  • In October 2020, Powerstep, a producer of prefabricated and bespoke orthotics, announced the release of its new line of insoles, Powerstep ProForm,. The new product range was created to offer athletes, runners, and weekend warriors the most comfort and support possible.

Key players

  • Otto Bock SE & Co KGaA
  • Diafarm Laboratories
  • Texon International Group Limited
  • Implus Footcare LLC
  • Sorbothane Incorporated
  • Aetrex Worldwide Inc.
  • Peacocks Medical Group
  • Arneplant S.L.
  • Birkenstock Digital GmbH
  • Atlantic Footcare Inc.
  • Digitsole
  • Aline Systems, Inc.
  • Foot Science International
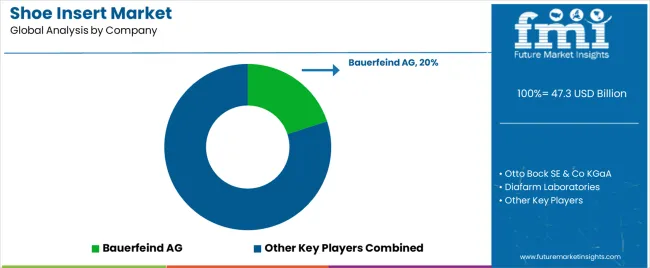
  • Bauerfeind AG
  • Guangzhou Shunyang SM Co Ltd.
  • Currex GmbH

Key segments

By Material Type:

  • Polymer
  • Plastic
  • Rubber
  • Carbon Fiber
  • Silicon

By Product Type:

  • Casual Insole
  • Sports/Athletic Insole
  • Orthotic Insole
  • Safety Insole

By Size (US):

  • 4 to 5
  • 6 to 7
  • 8 to 9
  • 10 to 11
  • 12 to 13

By Consumer Orientation:

  • Men
  • Women
  • Kids

By Sales Channel:

  • Direct
  • Indirect
    • Hypermarkets/Supermarkets
    • Departmental Stores
    • Specialty Stores
    • Multi-brand Stores
    • Exclusive Stores/Franchise Stores
    • Online Retailers

By Region:

  • North America
  • Latin America
  • Eastern Europe
  • Western Europe
  • Asia Pacific excluding China & Japan
  • Japan
  • China
  • Middle East & Africa

Frequently Asked Questions

How Big is the Shoe Insert Market by 2033?

The projected revenue of the market by 2033 is likely to be US$ 71.68 billion.

What is the Shoe Insert Market CAGR for 2033?

The market CAGR for 2033 is projected to be 5.4%.

Who are the Three Key Players in the Shoe Insert Market?

The key market players are Ottobock Holding, AF Group, and Footbalance System Ltd.

What is the Current Shoe Insert Market Valuation?

The market is estimated to secure a valuation of US$ 42.38 billion in 2023.

Why is the North American Shoe Insert Market Growing Remarkably Fast?

North America is growing fast due to the increasing awareness of the importance of foot health.

Table of Content

1. Executive Summary | Shoe Insert Market 

    1.1. Global Market Outlook

    1.2. Demand-side Trends

    1.3. Supply-side Trends

    1.4. Technology Roadmap Analysis

    1.5. Analysis and Recommendations

2. Market Overview

    2.1. Market Coverage / Taxonomy

    2.2. Market Definition / Scope / Limitations

3. Market Background

    3.1. Market Dynamics

        3.1.1. Drivers

        3.1.2. Restraints

        3.1.3. Opportunity

        3.1.4. Trends

    3.2. Scenario Forecast

        3.2.1. Demand in Optimistic Scenario

        3.2.2. Demand in Likely Scenario

        3.2.3. Demand in Conservative Scenario

    3.3. Opportunity Map Analysis

    3.4. Product Life Cycle Analysis

    3.5. Supply Chain Analysis

        3.5.1. Supply Side Participants and their Roles

            3.5.1.1. Producers

            3.5.1.2. Mid-Level Participants (Traders/ Agents/ Brokers)

            3.5.1.3. Wholesalers and Distributors

        3.5.2. Value Added and Value Created at Node in the Supply Chain

        3.5.3. List of Raw Material Suppliers

        3.5.4. List of Existing and Potential Buyer’s

    3.6. Investment Feasibility Matrix

    3.7. Value Chain Analysis

        3.7.1. Profit Margin Analysis

        3.7.2. Wholesalers and Distributors

        3.7.3. Retailers

    3.8. PESTLE and Porter’s Analysis

    3.9. Regulatory Landscape

        3.9.1. By Key Regions

        3.9.2. By Key Countries

    3.10. Regional Parent Market Outlook

    3.11. Production and Consumption Statistics

    3.12. Import and Export Statistics

4. Global Market Analysis 2018 to 2022 and Forecast, 2023 to 2033

    4.1. Historical Market Size Value (US$ Million) & Volume (Units) Analysis, 2018 to 2022

    4.2. Current and Future Market Size Value (US$ Million) & Volume (Units) Projections, 2023 to 2033

        4.2.1. Y-o-Y Growth Trend Analysis

        4.2.2. Absolute $ Opportunity Analysis

5. Global Market Analysis 2018 to 2022 and Forecast 2023 to 2033, By Base Material Type

    5.1. Introduction / Key Findings

    5.2. Historical Market Size Value (US$ Million) & Volume (Units) Analysis By Base Material Type, 2018 to 2022

    5.3. Current and Future Market Size Value (US$ Million) & Volume (Units) Analysis and Forecast By Base Material Type, 2023 to 2033

        5.3.1. Polymer

        5.3.2. Plastic

        5.3.3. Rubber

        5.3.4. Carbon Fibre

        5.3.5. Silicon

    5.4. Y-o-Y Growth Trend Analysis By Base Material Type, 2018 to 2022

    5.5. Absolute $ Opportunity Analysis By Base Material Type, 2023 to 2033

6. Global Market Analysis 2018 to 2022 and Forecast 2023 to 2033, By Product Type

    6.1. Introduction / Key Findings

    6.2. Historical Market Size Value (US$ Million) & Volume (Units) Analysis By Product Type, 2018 to 2022

    6.3. Current and Future Market Size Value (US$ Million) & Volume (Units) Analysis and Forecast By Product Type, 2023 to 2033

        6.3.1. Casual Insole

        6.3.2. Sports/Athletic Insole

        6.3.3. Orthotic Insole

        6.3.4. Safety Insole

    6.4. Y-o-Y Growth Trend Analysis By Product Type, 2018 to 2022

    6.5. Absolute $ Opportunity Analysis By Product Type, 2023 to 2033

7. Global Market Analysis 2018 to 2022 and Forecast 2023 to 2033, By Size (US)

    7.1. Introduction / Key Findings

    7.2. Historical Market Size Value (US$ Million) & Volume (Units) Analysis By Size (US), 2018 to 2022

    7.3. Current and Future Market Size Value (US$ Million) & Volume (Units) Analysis and Forecast By Size (US), 2023 to 2033

        7.3.1. 4-5

        7.3.2. 6-7

        7.3.3. 8-9

        7.3.4. 10-11

        7.3.5. 12-13

    7.4. Y-o-Y Growth Trend Analysis By Size (US), 2018 to 2022

    7.5. Absolute $ Opportunity Analysis By Size (US), 2023 to 2033

8. Global Market Analysis 2018 to 2022 and Forecast 2023 to 2033, By Consumer Orientation

    8.1. Introduction / Key Findings

    8.2. Historical Market Size Value (US$ Million) & Volume (Units) Analysis By Consumer Orientation, 2018 to 2022

    8.3. Current and Future Market Size Value (US$ Million) & Volume (Units) Analysis and Forecast By Consumer Orientation, 2023 to 2033

        8.3.1. Men

        8.3.2. Women

        8.3.3. Kids

    8.4. Y-o-Y Growth Trend Analysis By Consumer Orientation, 2018 to 2022

    8.5. Absolute $ Opportunity Analysis By Consumer Orientation, 2023 to 2033

9. Global Market Analysis 2018 to 2022 and Forecast 2023 to 2033, By Sales Channel

    9.1. Introduction / Key Findings

    9.2. Historical Market Size Value (US$ Million) & Volume (Units) Analysis By Sales Channel, 2018 to 2022

    9.3. Current and Future Market Size Value (US$ Million) & Volume (Units) Analysis and Forecast By Sales Channel, 2023 to 2033

        9.3.1. Departmental Stores

        9.3.2. Specialty Stores

        9.3.3. Multi-brand Stores

        9.3.4. Exclusive Stores/Franchise Stores

        9.3.5. Online Retailers

    9.4. Y-o-Y Growth Trend Analysis By Sales Channel, 2018 to 2022

    9.5. Absolute $ Opportunity Analysis By Sales Channel, 2023 to 2033

10. Global Market Analysis 2018 to 2022 and Forecast 2023 to 2033, By Region

    10.1. Introduction

    10.2. Historical Market Size Value (US$ Million) & Volume (Units) Analysis By Region, 2018 to 2022

    10.3. Current Market Size Value (US$ Million) & Volume (Units) Analysis and Forecast By Region, 2023 to 2033

        10.3.1. North America

        10.3.2. Latin America

        10.3.3. Europe

        10.3.4. Asia Pacific

        10.3.5. MEA

    10.4. Market Attractiveness Analysis By Region

11. North America Market Analysis 2018 to 2022 and Forecast 2023 to 2033, By Country

    11.1. Historical Market Size Value (US$ Million) & Volume (Units) Trend Analysis By Market Taxonomy, 2018 to 2022

    11.2. Market Size Value (US$ Million) & Volume (Units) Forecast By Market Taxonomy, 2023 to 2033

        11.2.1. By Country

            11.2.1.1. USA

            11.2.1.2. Canada

        11.2.2. By Base Material Type

        11.2.3. By Product Type

        11.2.4. By Size (US)

        11.2.5. By Consumer Orientation

        11.2.6. By Sales Channel

    11.3. Market Attractiveness Analysis

        11.3.1. By Country

        11.3.2. By Base Material Type

        11.3.3. By Product Type

        11.3.4. By Size (US)

        11.3.5. By Consumer Orientation

        11.3.6. By Sales Channel

    11.4. Key Takeaways

12. Latin America Market Analysis 2018 to 2022 and Forecast 2023 to 2033, By Country

    12.1. Historical Market Size Value (US$ Million) & Volume (Units) Trend Analysis By Market Taxonomy, 2018 to 2022

    12.2. Market Size Value (US$ Million) & Volume (Units) Forecast By Market Taxonomy, 2023 to 2033

        12.2.1. By Country

            12.2.1.1. Brazil

            12.2.1.2. Mexico

            12.2.1.3. Rest of Latin America

        12.2.2. By Base Material Type

        12.2.3. By Product Type

        12.2.4. By Size (US)

        12.2.5. By Consumer Orientation

        12.2.6. By Sales Channel

    12.3. Market Attractiveness Analysis

        12.3.1. By Country

        12.3.2. By Base Material Type

        12.3.3. By Product Type

        12.3.4. By Size (US)

        12.3.5. By Consumer Orientation

        12.3.6. By Sales Channel

    12.4. Key Takeaways

13. Europe Market Analysis 2018 to 2022 and Forecast 2023 to 2033, By Country

    13.1. Historical Market Size Value (US$ Million) & Volume (Units) Trend Analysis By Market Taxonomy, 2018 to 2022

    13.2. Market Size Value (US$ Million) & Volume (Units) Forecast By Market Taxonomy, 2023 to 2033

        13.2.1. By Country

            13.2.1.1. Germany

            13.2.1.2. United Kingdom

            13.2.1.3. France

            13.2.1.4. Spain

            13.2.1.5. Italy

            13.2.1.6. Rest of Europe

        13.2.2. By Base Material Type

        13.2.3. By Product Type

        13.2.4. By Size (US)

        13.2.5. By Consumer Orientation

        13.2.6. By Sales Channel

    13.3. Market Attractiveness Analysis

        13.3.1. By Country

        13.3.2. By Base Material Type

        13.3.3. By Product Type

        13.3.4. By Size (US)

        13.3.5. By Consumer Orientation

        13.3.6. By Sales Channel

    13.4. Key Takeaways

14. Asia Pacific Market Analysis 2018 to 2022 and Forecast 2023 to 2033, By Country

    14.1. Historical Market Size Value (US$ Million) & Volume (Units) Trend Analysis By Market Taxonomy, 2018 to 2022

    14.2. Market Size Value (US$ Million) & Volume (Units) Forecast By Market Taxonomy, 2023 to 2033

        14.2.1. By Country

            14.2.1.1. China

            14.2.1.2. Japan

            14.2.1.3. South Korea

            14.2.1.4. Singapore

            14.2.1.5. Thailand

            14.2.1.6. Indonesia

            14.2.1.7. Australia

            14.2.1.8. New Zealand

            14.2.1.9. Rest of Asia Pacific

        14.2.2. By Base Material Type

        14.2.3. By Product Type

        14.2.4. By Size (US)

        14.2.5. By Consumer Orientation

        14.2.6. By Sales Channel

    14.3. Market Attractiveness Analysis

        14.3.1. By Country

        14.3.2. By Base Material Type

        14.3.3. By Product Type

        14.3.4. By Size (US)

        14.3.5. By Consumer Orientation

        14.3.6. By Sales Channel

    14.4. Key Takeaways

15. MEA Market Analysis 2018 to 2022 and Forecast 2023 to 2033, By Country

    15.1. Historical Market Size Value (US$ Million) & Volume (Units) Trend Analysis By Market Taxonomy, 2018 to 2022

    15.2. Market Size Value (US$ Million) & Volume (Units) Forecast By Market Taxonomy, 2023 to 2033

        15.2.1. By Country

            15.2.1.1. GCC Countries

            15.2.1.2. South Africa

            15.2.1.3. Israel

            15.2.1.4. Rest of MEA

        15.2.2. By Base Material Type

        15.2.3. By Product Type

        15.2.4. By Size (US)

        15.2.5. By Consumer Orientation

        15.2.6. By Sales Channel

    15.3. Market Attractiveness Analysis

        15.3.1. By Country

        15.3.2. By Base Material Type

        15.3.3. By Product Type

        15.3.4. By Size (US)

        15.3.5. By Consumer Orientation

        15.3.6. By Sales Channel

    15.4. Key Takeaways

16. Key Countries Market Analysis

    16.1. USA

        16.1.1. Pricing Analysis

        16.1.2. Market Share Analysis, 2022

            16.1.2.1. By Base Material Type

            16.1.2.2. By Product Type

            16.1.2.3. By Size (US)

            16.1.2.4. By Consumer Orientation

            16.1.2.5. By Sales Channel

    16.2. Canada

        16.2.1. Pricing Analysis

        16.2.2. Market Share Analysis, 2022

            16.2.2.1. By Base Material Type

            16.2.2.2. By Product Type

            16.2.2.3. By Size (US)

            16.2.2.4. By Consumer Orientation

            16.2.2.5. By Sales Channel

    16.3. Brazil

        16.3.1. Pricing Analysis

        16.3.2. Market Share Analysis, 2022

            16.3.2.1. By Base Material Type

            16.3.2.2. By Product Type

            16.3.2.3. By Size (US)

            16.3.2.4. By Consumer Orientation

            16.3.2.5. By Sales Channel

    16.4. Mexico

        16.4.1. Pricing Analysis

        16.4.2. Market Share Analysis, 2022

            16.4.2.1. By Base Material Type

            16.4.2.2. By Product Type

            16.4.2.3. By Size (US)

            16.4.2.4. By Consumer Orientation

            16.4.2.5. By Sales Channel

    16.5. Germany

        16.5.1. Pricing Analysis

        16.5.2. Market Share Analysis, 2022

            16.5.2.1. By Base Material Type

            16.5.2.2. By Product Type

            16.5.2.3. By Size (US)

            16.5.2.4. By Consumer Orientation

            16.5.2.5. By Sales Channel

    16.6. United Kingdom

        16.6.1. Pricing Analysis

        16.6.2. Market Share Analysis, 2022

            16.6.2.1. By Base Material Type

            16.6.2.2. By Product Type

            16.6.2.3. By Size (US)

            16.6.2.4. By Consumer Orientation

            16.6.2.5. By Sales Channel

    16.7. France

        16.7.1. Pricing Analysis

        16.7.2. Market Share Analysis, 2022

            16.7.2.1. By Base Material Type

            16.7.2.2. By Product Type

            16.7.2.3. By Size (US)

            16.7.2.4. By Consumer Orientation

            16.7.2.5. By Sales Channel

    16.8. Spain

        16.8.1. Pricing Analysis

        16.8.2. Market Share Analysis, 2022

            16.8.2.1. By Base Material Type

            16.8.2.2. By Product Type

            16.8.2.3. By Size (US)

            16.8.2.4. By Consumer Orientation

            16.8.2.5. By Sales Channel

    16.9. Italy

        16.9.1. Pricing Analysis

        16.9.2. Market Share Analysis, 2022

            16.9.2.1. By Base Material Type

            16.9.2.2. By Product Type

            16.9.2.3. By Size (US)

            16.9.2.4. By Consumer Orientation

            16.9.2.5. By Sales Channel

    16.10. China

        16.10.1. Pricing Analysis

        16.10.2. Market Share Analysis, 2022

            16.10.2.1. By Base Material Type

            16.10.2.2. By Product Type

            16.10.2.3. By Size (US)

            16.10.2.4. By Consumer Orientation

            16.10.2.5. By Sales Channel

    16.11. Japan

        16.11.1. Pricing Analysis

        16.11.2. Market Share Analysis, 2022

            16.11.2.1. By Base Material Type

            16.11.2.2. By Product Type

            16.11.2.3. By Size (US)

            16.11.2.4. By Consumer Orientation

            16.11.2.5. By Sales Channel

    16.12. South Korea

        16.12.1. Pricing Analysis

        16.12.2. Market Share Analysis, 2022

            16.12.2.1. By Base Material Type

            16.12.2.2. By Product Type

            16.12.2.3. By Size (US)

            16.12.2.4. By Consumer Orientation

            16.12.2.5. By Sales Channel

    16.13. Singapore

        16.13.1. Pricing Analysis

        16.13.2. Market Share Analysis, 2022

            16.13.2.1. By Base Material Type

            16.13.2.2. By Product Type

            16.13.2.3. By Size (US)

            16.13.2.4. By Consumer Orientation

            16.13.2.5. By Sales Channel

    16.14. Thailand

        16.14.1. Pricing Analysis

        16.14.2. Market Share Analysis, 2022

            16.14.2.1. By Base Material Type

            16.14.2.2. By Product Type

            16.14.2.3. By Size (US)

            16.14.2.4. By Consumer Orientation

            16.14.2.5. By Sales Channel

    16.15. Indonesia

        16.15.1. Pricing Analysis

        16.15.2. Market Share Analysis, 2022

            16.15.2.1. By Base Material Type

            16.15.2.2. By Product Type

            16.15.2.3. By Size (US)

            16.15.2.4. By Consumer Orientation

            16.15.2.5. By Sales Channel

    16.16. Australia

        16.16.1. Pricing Analysis

        16.16.2. Market Share Analysis, 2022

            16.16.2.1. By Base Material Type

            16.16.2.2. By Product Type

            16.16.2.3. By Size (US)

            16.16.2.4. By Consumer Orientation

            16.16.2.5. By Sales Channel

    16.17. New Zealand

        16.17.1. Pricing Analysis

        16.17.2. Market Share Analysis, 2022

            16.17.2.1. By Base Material Type

            16.17.2.2. By Product Type

            16.17.2.3. By Size (US)

            16.17.2.4. By Consumer Orientation

            16.17.2.5. By Sales Channel

    16.18. GCC Countries

        16.18.1. Pricing Analysis

        16.18.2. Market Share Analysis, 2022

            16.18.2.1. By Base Material Type

            16.18.2.2. By Product Type

            16.18.2.3. By Size (US)

            16.18.2.4. By Consumer Orientation

            16.18.2.5. By Sales Channel

    16.19. South Africa

        16.19.1. Pricing Analysis

        16.19.2. Market Share Analysis, 2022

            16.19.2.1. By Base Material Type

            16.19.2.2. By Product Type

            16.19.2.3. By Size (US)

            16.19.2.4. By Consumer Orientation

            16.19.2.5. By Sales Channel

    16.20. Israel

        16.20.1. Pricing Analysis

        16.20.2. Market Share Analysis, 2022

            16.20.2.1. By Base Material Type

            16.20.2.2. By Product Type

            16.20.2.3. By Size (US)

            16.20.2.4. By Consumer Orientation

            16.20.2.5. By Sales Channel

17. Market Structure Analysis

    17.1. Competition Dashboard

    17.2. Competition Benchmarking

    17.3. Market Share Analysis of Top Players

        17.3.1. By Regional

        17.3.2. By Base Material Type

        17.3.3. By Product Type

        17.3.4. By Size (US)

        17.3.5. By Consumer Orientation

        17.3.6. By Sales Channel

18. Competition Analysis

    18.1. Competition Deep Dive

        18.1.1. Otto Bock SE & Co KGaA

            18.1.1.1. Overview

            18.1.1.2. Product Portfolio

            18.1.1.3. Profitability by Market Segments

            18.1.1.4. Sales Footprint

            18.1.1.5. Strategy Overview

                18.1.1.5.1. Marketing Strategy

                18.1.1.5.2. Product Strategy

                18.1.1.5.3. Channel Strategy

        18.1.2. Noene

            18.1.2.1. Overview

            18.1.2.2. Product Portfolio

            18.1.2.3. Profitability by Market Segments

            18.1.2.4. Sales Footprint

            18.1.2.5. Strategy Overview

                18.1.2.5.1. Marketing Strategy

                18.1.2.5.2. Product Strategy

                18.1.2.5.3. Channel Strategy

        18.1.3. Texon International Group Limited

            18.1.3.1. Overview

            18.1.3.2. Product Portfolio

            18.1.3.3. Profitability by Market Segments

            18.1.3.4. Sales Footprint

            18.1.3.5. Strategy Overview

                18.1.3.5.1. Marketing Strategy

                18.1.3.5.2. Product Strategy

                18.1.3.5.3. Channel Strategy

        18.1.4. Implus Footcare LLC

            18.1.4.1. Overview

            18.1.4.2. Product Portfolio

            18.1.4.3. Profitability by Market Segments

            18.1.4.4. Sales Footprint

            18.1.4.5. Strategy Overview

                18.1.4.5.1. Marketing Strategy

                18.1.4.5.2. Product Strategy

                18.1.4.5.3. Channel Strategy

        18.1.5. Sorbothane Incorporated

            18.1.5.1. Overview

            18.1.5.2. Product Portfolio

            18.1.5.3. Profitability by Market Segments

            18.1.5.4. Sales Footprint

            18.1.5.5. Strategy Overview

                18.1.5.5.1. Marketing Strategy

                18.1.5.5.2. Product Strategy

                18.1.5.5.3. Channel Strategy

        18.1.6. Aetrex Worldwide Inc.

            18.1.6.1. Overview

            18.1.6.2. Product Portfolio

            18.1.6.3. Profitability by Market Segments

            18.1.6.4. Sales Footprint

            18.1.6.5. Strategy Overview

                18.1.6.5.1. Marketing Strategy

                18.1.6.5.2. Product Strategy

                18.1.6.5.3. Channel Strategy

        18.1.7. Peacocks Medical Group

            18.1.7.1. Overview

            18.1.7.2. Product Portfolio

            18.1.7.3. Profitability by Market Segments

            18.1.7.4. Sales Footprint

            18.1.7.5. Strategy Overview

                18.1.7.5.1. Marketing Strategy

                18.1.7.5.2. Product Strategy

                18.1.7.5.3. Channel Strategy

        18.1.8. Arneplant S.L.

            18.1.8.1. Overview

            18.1.8.2. Product Portfolio

            18.1.8.3. Profitability by Market Segments

            18.1.8.4. Sales Footprint

            18.1.8.5. Strategy Overview

                18.1.8.5.1. Marketing Strategy

                18.1.8.5.2. Product Strategy

                18.1.8.5.3. Channel Strategy

        18.1.9. Birkenstock Digital GmbH

            18.1.9.1. Overview

            18.1.9.2. Product Portfolio

            18.1.9.3. Profitability by Market Segments

            18.1.9.4. Sales Footprint

            18.1.9.5. Strategy Overview

                18.1.9.5.1. Marketing Strategy

                18.1.9.5.2. Product Strategy

                18.1.9.5.3. Channel Strategy

        18.1.10. Atlantic Footcare Inc.

            18.1.10.1. Overview

            18.1.10.2. Product Portfolio

            18.1.10.3. Profitability by Market Segments

            18.1.10.4. Sales Footprint

            18.1.10.5. Strategy Overview

                18.1.10.5.1. Marketing Strategy

                18.1.10.5.2. Product Strategy

                18.1.10.5.3. Channel Strategy

        18.1.11. Digitsole

            18.1.11.1. Overview

            18.1.11.2. Product Portfolio

            18.1.11.3. Profitability by Market Segments

            18.1.11.4. Sales Footprint

            18.1.11.5. Strategy Overview

                18.1.11.5.1. Marketing Strategy

                18.1.11.5.2. Product Strategy

                18.1.11.5.3. Channel Strategy

        18.1.12. Aline Systems, Inc.

            18.1.12.1. Overview

            18.1.12.2. Product Portfolio

            18.1.12.3. Profitability by Market Segments

            18.1.12.4. Sales Footprint

            18.1.12.5. Strategy Overview

                18.1.12.5.1. Marketing Strategy

                18.1.12.5.2. Product Strategy

                18.1.12.5.3. Channel Strategy

        18.1.13. Foot Science International

            18.1.13.1. Overview

            18.1.13.2. Product Portfolio

            18.1.13.3. Profitability by Market Segments

            18.1.13.4. Sales Footprint

            18.1.13.5. Strategy Overview

                18.1.13.5.1. Marketing Strategy

                18.1.13.5.2. Product Strategy

                18.1.13.5.3. Channel Strategy

        18.1.14. Bauerfeind AG

            18.1.14.1. Overview

            18.1.14.2. Product Portfolio

            18.1.14.3. Profitability by Market Segments

            18.1.14.4. Sales Footprint

            18.1.14.5. Strategy Overview

                18.1.14.5.1. Marketing Strategy

                18.1.14.5.2. Product Strategy

                18.1.14.5.3. Channel Strategy

        18.1.15. Guangzhou Shunyang SM Co Ltd.

            18.1.15.1. Overview

            18.1.15.2. Product Portfolio

            18.1.15.3. Profitability by Market Segments

            18.1.15.4. Sales Footprint

            18.1.15.5. Strategy Overview

                18.1.15.5.1. Marketing Strategy

                18.1.15.5.2. Product Strategy

                18.1.15.5.3. Channel Strategy

        18.1.16. Currex GmbH

            18.1.16.1. Overview

            18.1.16.2. Product Portfolio

            18.1.16.3. Profitability by Market Segments

            18.1.16.4. Sales Footprint

            18.1.16.5. Strategy Overview

                18.1.16.5.1. Marketing Strategy

                18.1.16.5.2. Product Strategy

                18.1.16.5.3. Channel Strategy

19. Assumptions & Acronyms Used

20. Research Methodology

Don't pay for what you don't need

Customize your report by selecting specific countries or regions and save 30%!

List of Tables

Table 1: Global Market Value (US$ Million) Forecast by Region, 2018 to 2033

Table 2: Global Market Volume (Units) Forecast by Region, 2018 to 2033

Table 3: Global Market Value (US$ Million) Forecast by Base Material Type, 2018 to 2033

Table 4: Global Market Volume (Units) Forecast by Base Material Type, 2018 to 2033

Table 5: Global Market Value (US$ Million) Forecast by Product Type, 2018 to 2033

Table 6: Global Market Volume (Units) Forecast by Product Type, 2018 to 2033

Table 7: Global Market Value (US$ Million) Forecast by Size (US), 2018 to 2033

Table 8: Global Market Volume (Units) Forecast by Size (US), 2018 to 2033

Table 9: Global Market Value (US$ Million) Forecast by Consumer Orientation, 2018 to 2033

Table 10: Global Market Volume (Units) Forecast by Consumer Orientation, 2018 to 2033

Table 11: Global Market Value (US$ Million) Forecast by Sales Channel, 2018 to 2033

Table 12: Global Market Volume (Units) Forecast by Sales Channel, 2018 to 2033

Table 13: North America Market Value (US$ Million) Forecast by Country, 2018 to 2033

Table 14: North America Market Volume (Units) Forecast by Country, 2018 to 2033

Table 15: North America Market Value (US$ Million) Forecast by Base Material Type, 2018 to 2033

Table 16: North America Market Volume (Units) Forecast by Base Material Type, 2018 to 2033

Table 17: North America Market Value (US$ Million) Forecast by Product Type, 2018 to 2033

Table 18: North America Market Volume (Units) Forecast by Product Type, 2018 to 2033

Table 19: North America Market Value (US$ Million) Forecast by Size (US), 2018 to 2033

Table 20: North America Market Volume (Units) Forecast by Size (US), 2018 to 2033

Table 21: North America Market Value (US$ Million) Forecast by Consumer Orientation, 2018 to 2033

Table 22: North America Market Volume (Units) Forecast by Consumer Orientation, 2018 to 2033

Table 23: North America Market Value (US$ Million) Forecast by Sales Channel, 2018 to 2033

Table 24: North America Market Volume (Units) Forecast by Sales Channel, 2018 to 2033

Table 25: Latin America Market Value (US$ Million) Forecast by Country, 2018 to 2033

Table 26: Latin America Market Volume (Units) Forecast by Country, 2018 to 2033

Table 27: Latin America Market Value (US$ Million) Forecast by Base Material Type, 2018 to 2033

Table 28: Latin America Market Volume (Units) Forecast by Base Material Type, 2018 to 2033

Table 29: Latin America Market Value (US$ Million) Forecast by Product Type, 2018 to 2033

Table 30: Latin America Market Volume (Units) Forecast by Product Type, 2018 to 2033

Table 31: Latin America Market Value (US$ Million) Forecast by Size (US), 2018 to 2033

Table 32: Latin America Market Volume (Units) Forecast by Size (US), 2018 to 2033

Table 33: Latin America Market Value (US$ Million) Forecast by Consumer Orientation, 2018 to 2033

Table 34: Latin America Market Volume (Units) Forecast by Consumer Orientation, 2018 to 2033

Table 35: Latin America Market Value (US$ Million) Forecast by Sales Channel, 2018 to 2033

Table 36: Latin America Market Volume (Units) Forecast by Sales Channel, 2018 to 2033

Table 37: Europe Market Value (US$ Million) Forecast by Country, 2018 to 2033

Table 38: Europe Market Volume (Units) Forecast by Country, 2018 to 2033

Table 39: Europe Market Value (US$ Million) Forecast by Base Material Type, 2018 to 2033

Table 40: Europe Market Volume (Units) Forecast by Base Material Type, 2018 to 2033

Table 41: Europe Market Value (US$ Million) Forecast by Product Type, 2018 to 2033

Table 42: Europe Market Volume (Units) Forecast by Product Type, 2018 to 2033

Table 43: Europe Market Value (US$ Million) Forecast by Size (US), 2018 to 2033

Table 44: Europe Market Volume (Units) Forecast by Size (US), 2018 to 2033

Table 45: Europe Market Value (US$ Million) Forecast by Consumer Orientation, 2018 to 2033

Table 46: Europe Market Volume (Units) Forecast by Consumer Orientation, 2018 to 2033

Table 47: Europe Market Value (US$ Million) Forecast by Sales Channel, 2018 to 2033

Table 48: Europe Market Volume (Units) Forecast by Sales Channel, 2018 to 2033

Table 49: Asia Pacific Market Value (US$ Million) Forecast by Country, 2018 to 2033

Table 50: Asia Pacific Market Volume (Units) Forecast by Country, 2018 to 2033

Table 51: Asia Pacific Market Value (US$ Million) Forecast by Base Material Type, 2018 to 2033

Table 52: Asia Pacific Market Volume (Units) Forecast by Base Material Type, 2018 to 2033

Table 53: Asia Pacific Market Value (US$ Million) Forecast by Product Type, 2018 to 2033

Table 54: Asia Pacific Market Volume (Units) Forecast by Product Type, 2018 to 2033

Table 55: Asia Pacific Market Value (US$ Million) Forecast by Size (US), 2018 to 2033

Table 56: Asia Pacific Market Volume (Units) Forecast by Size (US), 2018 to 2033

Table 57: Asia Pacific Market Value (US$ Million) Forecast by Consumer Orientation, 2018 to 2033

Table 58: Asia Pacific Market Volume (Units) Forecast by Consumer Orientation, 2018 to 2033

Table 59: Asia Pacific Market Value (US$ Million) Forecast by Sales Channel, 2018 to 2033

Table 60: Asia Pacific Market Volume (Units) Forecast by Sales Channel, 2018 to 2033

Table 61: MEA Market Value (US$ Million) Forecast by Country, 2018 to 2033

Table 62: MEA Market Volume (Units) Forecast by Country, 2018 to 2033

Table 63: MEA Market Value (US$ Million) Forecast by Base Material Type, 2018 to 2033

Table 64: MEA Market Volume (Units) Forecast by Base Material Type, 2018 to 2033

Table 65: MEA Market Value (US$ Million) Forecast by Product Type, 2018 to 2033

Table 66: MEA Market Volume (Units) Forecast by Product Type, 2018 to 2033

Table 67: MEA Market Value (US$ Million) Forecast by Size (US), 2018 to 2033

Table 68: MEA Market Volume (Units) Forecast by Size (US), 2018 to 2033

Table 69: MEA Market Value (US$ Million) Forecast by Consumer Orientation, 2018 to 2033

Table 70: MEA Market Volume (Units) Forecast by Consumer Orientation, 2018 to 2033

Table 71: MEA Market Value (US$ Million) Forecast by Sales Channel, 2018 to 2033

Table 72: MEA Market Volume (Units) Forecast by Sales Channel, 2018 to 2033
Sneha Verghese
Sneha Verghese

Principal Consultant

Talk to Analyst

Find your sweet spots for generating winning opportunities in this market.

List of Charts

Figure 1: Global Market Value (US$ Million) by Base Material Type, 2023 to 2033

Figure 2: Global Market Value (US$ Million) by Product Type, 2023 to 2033

Figure 3: Global Market Value (US$ Million) by Size (US), 2023 to 2033

Figure 4: Global Market Value (US$ Million) by Consumer Orientation, 2023 to 2033

Figure 5: Global Market Value (US$ Million) by Sales Channel, 2023 to 2033

Figure 6: Global Market Value (US$ Million) by Region, 2023 to 2033

Figure 7: Global Market Value (US$ Million) Analysis by Region, 2018 to 2033

Figure 8: Global Market Volume (Units) Analysis by Region, 2018 to 2033

Figure 9: Global Market Value Share (%) and BPS Analysis by Region, 2023 to 2033

Figure 10: Global Market Y-o-Y Growth (%) Projections by Region, 2023 to 2033

Figure 11: Global Market Value (US$ Million) Analysis by Base Material Type, 2018 to 2033

Figure 12: Global Market Volume (Units) Analysis by Base Material Type, 2018 to 2033

Figure 13: Global Market Value Share (%) and BPS Analysis by Base Material Type, 2023 to 2033

Figure 14: Global Market Y-o-Y Growth (%) Projections by Base Material Type, 2023 to 2033

Figure 15: Global Market Value (US$ Million) Analysis by Product Type, 2018 to 2033

Figure 16: Global Market Volume (Units) Analysis by Product Type, 2018 to 2033

Figure 17: Global Market Value Share (%) and BPS Analysis by Product Type, 2023 to 2033

Figure 18: Global Market Y-o-Y Growth (%) Projections by Product Type, 2023 to 2033

Figure 19: Global Market Value (US$ Million) Analysis by Size (US), 2018 to 2033

Figure 20: Global Market Volume (Units) Analysis by Size (US), 2018 to 2033

Figure 21: Global Market Value Share (%) and BPS Analysis by Size (US), 2023 to 2033

Figure 22: Global Market Y-o-Y Growth (%) Projections by Size (US), 2023 to 2033

Figure 23: Global Market Value (US$ Million) Analysis by Consumer Orientation, 2018 to 2033

Figure 24: Global Market Volume (Units) Analysis by Consumer Orientation, 2018 to 2033

Figure 25: Global Market Value Share (%) and BPS Analysis by Consumer Orientation, 2023 to 2033

Figure 26: Global Market Y-o-Y Growth (%) Projections by Consumer Orientation, 2023 to 2033

Figure 27: Global Market Value (US$ Million) Analysis by Sales Channel, 2018 to 2033

Figure 28: Global Market Volume (Units) Analysis by Sales Channel, 2018 to 2033

Figure 29: Global Market Value Share (%) and BPS Analysis by Sales Channel, 2023 to 2033

Figure 30: Global Market Y-o-Y Growth (%) Projections by Sales Channel, 2023 to 2033

Figure 31: Global Market Attractiveness by Base Material Type, 2023 to 2033

Figure 32: Global Market Attractiveness by Product Type, 2023 to 2033

Figure 33: Global Market Attractiveness by Size (US), 2023 to 2033

Figure 34: Global Market Attractiveness by Consumer Orientation, 2023 to 2033

Figure 35: Global Market Attractiveness by Sales Channel, 2023 to 2033

Figure 36: Global Market Attractiveness by Region, 2023 to 2033

Figure 37: North America Market Value (US$ Million) by Base Material Type, 2023 to 2033

Figure 38: North America Market Value (US$ Million) by Product Type, 2023 to 2033

Figure 39: North America Market Value (US$ Million) by Size (US), 2023 to 2033

Figure 40: North America Market Value (US$ Million) by Consumer Orientation, 2023 to 2033

Figure 41: North America Market Value (US$ Million) by Sales Channel, 2023 to 2033

Figure 42: North America Market Value (US$ Million) by Country, 2023 to 2033

Figure 43: North America Market Value (US$ Million) Analysis by Country, 2018 to 2033

Figure 44: North America Market Volume (Units) Analysis by Country, 2018 to 2033

Figure 45: North America Market Value Share (%) and BPS Analysis by Country, 2023 to 2033

Figure 46: North America Market Y-o-Y Growth (%) Projections by Country, 2023 to 2033

Figure 47: North America Market Value (US$ Million) Analysis by Base Material Type, 2018 to 2033

Figure 48: North America Market Volume (Units) Analysis by Base Material Type, 2018 to 2033

Figure 49: North America Market Value Share (%) and BPS Analysis by Base Material Type, 2023 to 2033

Figure 50: North America Market Y-o-Y Growth (%) Projections by Base Material Type, 2023 to 2033

Figure 51: North America Market Value (US$ Million) Analysis by Product Type, 2018 to 2033

Figure 52: North America Market Volume (Units) Analysis by Product Type, 2018 to 2033

Figure 53: North America Market Value Share (%) and BPS Analysis by Product Type, 2023 to 2033

Figure 54: North America Market Y-o-Y Growth (%) Projections by Product Type, 2023 to 2033

Figure 55: North America Market Value (US$ Million) Analysis by Size (US), 2018 to 2033

Figure 56: North America Market Volume (Units) Analysis by Size (US), 2018 to 2033

Figure 57: North America Market Value Share (%) and BPS Analysis by Size (US), 2023 to 2033

Figure 58: North America Market Y-o-Y Growth (%) Projections by Size (US), 2023 to 2033

Figure 59: North America Market Value (US$ Million) Analysis by Consumer Orientation, 2018 to 2033

Figure 60: North America Market Volume (Units) Analysis by Consumer Orientation, 2018 to 2033

Figure 61: North America Market Value Share (%) and BPS Analysis by Consumer Orientation, 2023 to 2033

Figure 62: North America Market Y-o-Y Growth (%) Projections by Consumer Orientation, 2023 to 2033

Figure 63: North America Market Value (US$ Million) Analysis by Sales Channel, 2018 to 2033

Figure 64: North America Market Volume (Units) Analysis by Sales Channel, 2018 to 2033

Figure 65: North America Market Value Share (%) and BPS Analysis by Sales Channel, 2023 to 2033

Figure 66: North America Market Y-o-Y Growth (%) Projections by Sales Channel, 2023 to 2033

Figure 67: North America Market Attractiveness by Base Material Type, 2023 to 2033

Figure 68: North America Market Attractiveness by Product Type, 2023 to 2033

Figure 69: North America Market Attractiveness by Size (US), 2023 to 2033

Figure 70: North America Market Attractiveness by Consumer Orientation, 2023 to 2033

Figure 71: North America Market Attractiveness by Sales Channel, 2023 to 2033

Figure 72: North America Market Attractiveness by Country, 2023 to 2033

Figure 73: Latin America Market Value (US$ Million) by Base Material Type, 2023 to 2033

Figure 74: Latin America Market Value (US$ Million) by Product Type, 2023 to 2033

Figure 75: Latin America Market Value (US$ Million) by Size (US), 2023 to 2033

Figure 76: Latin America Market Value (US$ Million) by Consumer Orientation, 2023 to 2033

Figure 77: Latin America Market Value (US$ Million) by Sales Channel, 2023 to 2033

Figure 78: Latin America Market Value (US$ Million) by Country, 2023 to 2033

Figure 79: Latin America Market Value (US$ Million) Analysis by Country, 2018 to 2033

Figure 80: Latin America Market Volume (Units) Analysis by Country, 2018 to 2033

Figure 81: Latin America Market Value Share (%) and BPS Analysis by Country, 2023 to 2033

Figure 82: Latin America Market Y-o-Y Growth (%) Projections by Country, 2023 to 2033

Figure 83: Latin America Market Value (US$ Million) Analysis by Base Material Type, 2018 to 2033

Figure 84: Latin America Market Volume (Units) Analysis by Base Material Type, 2018 to 2033

Figure 85: Latin America Market Value Share (%) and BPS Analysis by Base Material Type, 2023 to 2033

Figure 86: Latin America Market Y-o-Y Growth (%) Projections by Base Material Type, 2023 to 2033

Figure 87: Latin America Market Value (US$ Million) Analysis by Product Type, 2018 to 2033

Figure 88: Latin America Market Volume (Units) Analysis by Product Type, 2018 to 2033

Figure 89: Latin America Market Value Share (%) and BPS Analysis by Product Type, 2023 to 2033

Figure 90: Latin America Market Y-o-Y Growth (%) Projections by Product Type, 2023 to 2033

Figure 91: Latin America Market Value (US$ Million) Analysis by Size (US), 2018 to 2033

Figure 92: Latin America Market Volume (Units) Analysis by Size (US), 2018 to 2033

Figure 93: Latin America Market Value Share (%) and BPS Analysis by Size (US), 2023 to 2033

Figure 94: Latin America Market Y-o-Y Growth (%) Projections by Size (US), 2023 to 2033

Figure 95: Latin America Market Value (US$ Million) Analysis by Consumer Orientation, 2018 to 2033

Figure 96: Latin America Market Volume (Units) Analysis by Consumer Orientation, 2018 to 2033

Figure 97: Latin America Market Value Share (%) and BPS Analysis by Consumer Orientation, 2023 to 2033

Figure 98: Latin America Market Y-o-Y Growth (%) Projections by Consumer Orientation, 2023 to 2033

Figure 99: Latin America Market Value (US$ Million) Analysis by Sales Channel, 2018 to 2033

Figure 100: Latin America Market Volume (Units) Analysis by Sales Channel, 2018 to 2033

Figure 101: Latin America Market Value Share (%) and BPS Analysis by Sales Channel, 2023 to 2033

Figure 102: Latin America Market Y-o-Y Growth (%) Projections by Sales Channel, 2023 to 2033

Figure 103: Latin America Market Attractiveness by Base Material Type, 2023 to 2033

Figure 104: Latin America Market Attractiveness by Product Type, 2023 to 2033

Figure 105: Latin America Market Attractiveness by Size (US), 2023 to 2033

Figure 106: Latin America Market Attractiveness by Consumer Orientation, 2023 to 2033

Figure 107: Latin America Market Attractiveness by Sales Channel, 2023 to 2033

Figure 108: Latin America Market Attractiveness by Country, 2023 to 2033

Figure 109: Europe Market Value (US$ Million) by Base Material Type, 2023 to 2033

Figure 110: Europe Market Value (US$ Million) by Product Type, 2023 to 2033

Figure 111: Europe Market Value (US$ Million) by Size (US), 2023 to 2033

Figure 112: Europe Market Value (US$ Million) by Consumer Orientation, 2023 to 2033

Figure 113: Europe Market Value (US$ Million) by Sales Channel, 2023 to 2033

Figure 114: Europe Market Value (US$ Million) by Country, 2023 to 2033

Figure 115: Europe Market Value (US$ Million) Analysis by Country, 2018 to 2033

Figure 116: Europe Market Volume (Units) Analysis by Country, 2018 to 2033

Figure 117: Europe Market Value Share (%) and BPS Analysis by Country, 2023 to 2033

Figure 118: Europe Market Y-o-Y Growth (%) Projections by Country, 2023 to 2033

Figure 119: Europe Market Value (US$ Million) Analysis by Base Material Type, 2018 to 2033

Figure 120: Europe Market Volume (Units) Analysis by Base Material Type, 2018 to 2033

Figure 121: Europe Market Value Share (%) and BPS Analysis by Base Material Type, 2023 to 2033

Figure 122: Europe Market Y-o-Y Growth (%) Projections by Base Material Type, 2023 to 2033

Figure 123: Europe Market Value (US$ Million) Analysis by Product Type, 2018 to 2033

Figure 124: Europe Market Volume (Units) Analysis by Product Type, 2018 to 2033

Figure 125: Europe Market Value Share (%) and BPS Analysis by Product Type, 2023 to 2033

Figure 126: Europe Market Y-o-Y Growth (%) Projections by Product Type, 2023 to 2033

Figure 127: Europe Market Value (US$ Million) Analysis by Size (US), 2018 to 2033

Figure 128: Europe Market Volume (Units) Analysis by Size (US), 2018 to 2033

Figure 129: Europe Market Value Share (%) and BPS Analysis by Size (US), 2023 to 2033

Figure 130: Europe Market Y-o-Y Growth (%) Projections by Size (US), 2023 to 2033

Figure 131: Europe Market Value (US$ Million) Analysis by Consumer Orientation, 2018 to 2033

Figure 132: Europe Market Volume (Units) Analysis by Consumer Orientation, 2018 to 2033

Figure 133: Europe Market Value Share (%) and BPS Analysis by Consumer Orientation, 2023 to 2033

Figure 134: Europe Market Y-o-Y Growth (%) Projections by Consumer Orientation, 2023 to 2033

Figure 135: Europe Market Value (US$ Million) Analysis by Sales Channel, 2018 to 2033

Figure 136: Europe Market Volume (Units) Analysis by Sales Channel, 2018 to 2033

Figure 137: Europe Market Value Share (%) and BPS Analysis by Sales Channel, 2023 to 2033

Figure 138: Europe Market Y-o-Y Growth (%) Projections by Sales Channel, 2023 to 2033

Figure 139: Europe Market Attractiveness by Base Material Type, 2023 to 2033

Figure 140: Europe Market Attractiveness by Product Type, 2023 to 2033

Figure 141: Europe Market Attractiveness by Size (US), 2023 to 2033

Figure 142: Europe Market Attractiveness by Consumer Orientation, 2023 to 2033

Figure 143: Europe Market Attractiveness by Sales Channel, 2023 to 2033

Figure 144: Europe Market Attractiveness by Country, 2023 to 2033

Figure 145: Asia Pacific Market Value (US$ Million) by Base Material Type, 2023 to 2033

Figure 146: Asia Pacific Market Value (US$ Million) by Product Type, 2023 to 2033

Figure 147: Asia Pacific Market Value (US$ Million) by Size (US), 2023 to 2033

Figure 148: Asia Pacific Market Value (US$ Million) by Consumer Orientation, 2023 to 2033

Figure 149: Asia Pacific Market Value (US$ Million) by Sales Channel, 2023 to 2033

Figure 150: Asia Pacific Market Value (US$ Million) by Country, 2023 to 2033

Figure 151: Asia Pacific Market Value (US$ Million) Analysis by Country, 2018 to 2033

Figure 152: Asia Pacific Market Volume (Units) Analysis by Country, 2018 to 2033

Figure 153: Asia Pacific Market Value Share (%) and BPS Analysis by Country, 2023 to 2033

Figure 154: Asia Pacific Market Y-o-Y Growth (%) Projections by Country, 2023 to 2033

Figure 155: Asia Pacific Market Value (US$ Million) Analysis by Base Material Type, 2018 to 2033

Figure 156: Asia Pacific Market Volume (Units) Analysis by Base Material Type, 2018 to 2033

Figure 157: Asia Pacific Market Value Share (%) and BPS Analysis by Base Material Type, 2023 to 2033

Figure 158: Asia Pacific Market Y-o-Y Growth (%) Projections by Base Material Type, 2023 to 2033

Figure 159: Asia Pacific Market Value (US$ Million) Analysis by Product Type, 2018 to 2033

Figure 160: Asia Pacific Market Volume (Units) Analysis by Product Type, 2018 to 2033

Figure 161: Asia Pacific Market Value Share (%) and BPS Analysis by Product Type, 2023 to 2033

Figure 162: Asia Pacific Market Y-o-Y Growth (%) Projections by Product Type, 2023 to 2033

Figure 163: Asia Pacific Market Value (US$ Million) Analysis by Size (US), 2018 to 2033

Figure 164: Asia Pacific Market Volume (Units) Analysis by Size (US), 2018 to 2033

Figure 165: Asia Pacific Market Value Share (%) and BPS Analysis by Size (US), 2023 to 2033

Figure 166: Asia Pacific Market Y-o-Y Growth (%) Projections by Size (US), 2023 to 2033

Figure 167: Asia Pacific Market Value (US$ Million) Analysis by Consumer Orientation, 2018 to 2033

Figure 168: Asia Pacific Market Volume (Units) Analysis by Consumer Orientation, 2018 to 2033

Figure 169: Asia Pacific Market Value Share (%) and BPS Analysis by Consumer Orientation, 2023 to 2033

Figure 170: Asia Pacific Market Y-o-Y Growth (%) Projections by Consumer Orientation, 2023 to 2033

Figure 171: Asia Pacific Market Value (US$ Million) Analysis by Sales Channel, 2018 to 2033

Figure 172: Asia Pacific Market Volume (Units) Analysis by Sales Channel, 2018 to 2033

Figure 173: Asia Pacific Market Value Share (%) and BPS Analysis by Sales Channel, 2023 to 2033

Figure 174: Asia Pacific Market Y-o-Y Growth (%) Projections by Sales Channel, 2023 to 2033

Figure 175: Asia Pacific Market Attractiveness by Base Material Type, 2023 to 2033

Figure 176: Asia Pacific Market Attractiveness by Product Type, 2023 to 2033

Figure 177: Asia Pacific Market Attractiveness by Size (US), 2023 to 2033

Figure 178: Asia Pacific Market Attractiveness by Consumer Orientation, 2023 to 2033

Figure 179: Asia Pacific Market Attractiveness by Sales Channel, 2023 to 2033

Figure 180: Asia Pacific Market Attractiveness by Country, 2023 to 2033

Figure 181: MEA Market Value (US$ Million) by Base Material Type, 2023 to 2033

Figure 182: MEA Market Value (US$ Million) by Product Type, 2023 to 2033

Figure 183: MEA Market Value (US$ Million) by Size (US), 2023 to 2033

Figure 184: MEA Market Value (US$ Million) by Consumer Orientation, 2023 to 2033

Figure 185: MEA Market Value (US$ Million) by Sales Channel, 2023 to 2033

Figure 186: MEA Market Value (US$ Million) by Country, 2023 to 2033

Figure 187: MEA Market Value (US$ Million) Analysis by Country, 2018 to 2033

Figure 188: MEA Market Volume (Units) Analysis by Country, 2018 to 2033

Figure 189: MEA Market Value Share (%) and BPS Analysis by Country, 2023 to 2033

Figure 190: MEA Market Y-o-Y Growth (%) Projections by Country, 2023 to 2033

Figure 191: MEA Market Value (US$ Million) Analysis by Base Material Type, 2018 to 2033

Figure 192: MEA Market Volume (Units) Analysis by Base Material Type, 2018 to 2033

Figure 193: MEA Market Value Share (%) and BPS Analysis by Base Material Type, 2023 to 2033

Figure 194: MEA Market Y-o-Y Growth (%) Projections by Base Material Type, 2023 to 2033

Figure 195: MEA Market Value (US$ Million) Analysis by Product Type, 2018 to 2033

Figure 196: MEA Market Volume (Units) Analysis by Product Type, 2018 to 2033

Figure 197: MEA Market Value Share (%) and BPS Analysis by Product Type, 2023 to 2033

Figure 198: MEA Market Y-o-Y Growth (%) Projections by Product Type, 2023 to 2033

Figure 199: MEA Market Value (US$ Million) Analysis by Size (US), 2018 to 2033

Figure 200: MEA Market Volume (Units) Analysis by Size (US), 2018 to 2033

Figure 201: MEA Market Value Share (%) and BPS Analysis by Size (US), 2023 to 2033

Figure 202: MEA Market Y-o-Y Growth (%) Projections by Size (US), 2023 to 2033

Figure 203: MEA Market Value (US$ Million) Analysis by Consumer Orientation, 2018 to 2033

Figure 204: MEA Market Volume (Units) Analysis by Consumer Orientation, 2018 to 2033

Figure 205: MEA Market Value Share (%) and BPS Analysis by Consumer Orientation, 2023 to 2033

Figure 206: MEA Market Y-o-Y Growth (%) Projections by Consumer Orientation, 2023 to 2033

Figure 207: MEA Market Value (US$ Million) Analysis by Sales Channel, 2018 to 2033

Figure 208: MEA Market Volume (Units) Analysis by Sales Channel, 2018 to 2033

Figure 209: MEA Market Value Share (%) and BPS Analysis by Sales Channel, 2023 to 2033

Figure 210: MEA Market Y-o-Y Growth (%) Projections by Sales Channel, 2023 to 2033

Figure 211: MEA Market Attractiveness by Base Material Type, 2023 to 2033

Figure 212: MEA Market Attractiveness by Product Type, 2023 to 2033

Figure 213: MEA Market Attractiveness by Size (US), 2023 to 2033

Figure 214: MEA Market Attractiveness by Consumer Orientation, 2023 to 2033

Figure 215: MEA Market Attractiveness by Sales Channel, 2023 to 2033

Figure 216: MEA Market Attractiveness by Country, 2023 to 2033

Recommendations

Consumer Product

Running Shoes Market

Published : January 2023

Consumer Product

Cross Training Shoes Market

Published : December 2022

Explore Consumer Product Insights

View Reports