
- Market Size (2026)
- USD 8.7 Bn
- Forecast (2036)
- USD 10.6 Bn
- CAGR (2026 to 2036)
- 2.0%
How Big Is the Silver Paste Market in 2026?
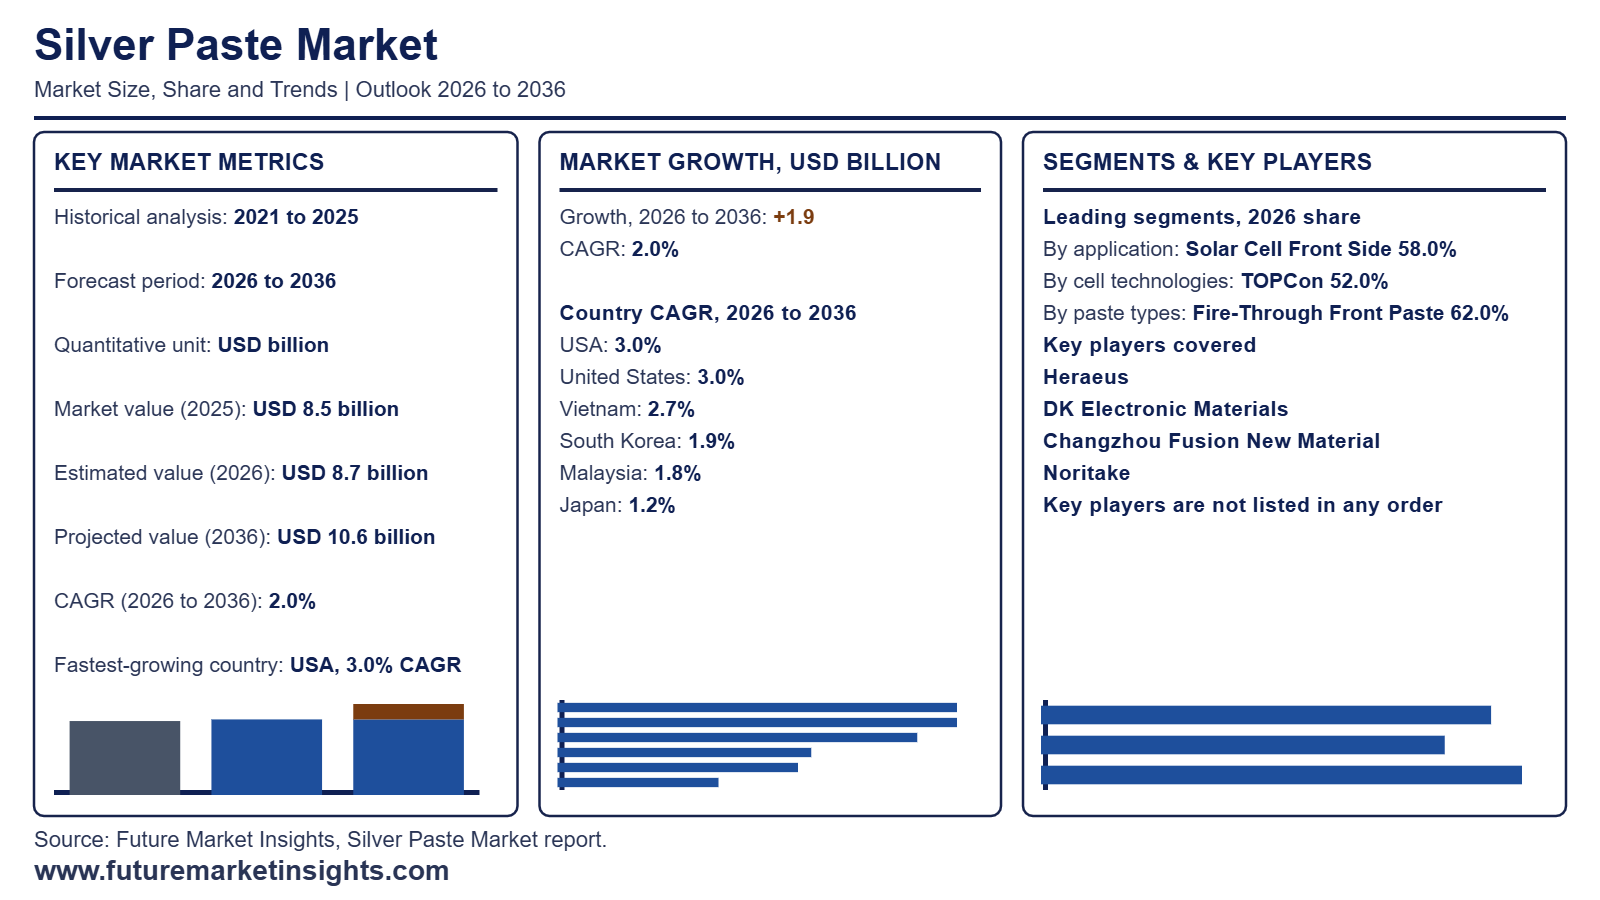
The global silver paste market is valued at USD 8.7 billion in 2026, up from USD 8.5 billion in 2025, and is projected by Future Market Insights (FMI) to reach USD 10.6 billion by 2036, expanding at a 2.0% CAGR to generate USD 1.9 billion in incremental revenue over the forecast decade.
| Market Metric | Valuation / Share / Forecast Benchmark |
|---|---|
| 2025 Market Size (Historical) | USD 8.5 billion |
| 2026 Market Size (Estimated) | USD 8.7 billion |
| 2036 Market Size (Projected) | USD 10.6 billion |
| Compound Annual Growth Rate (2026 to 2036) | 2.0% CAGR |
| Incremental Dollar Opportunity (2026 to 2036) | USD 1.9 billion |
| Dominant Application (2026 to 2036 Share) | Solar Cell Front Side (58.0% in 2026, easing to 54.5% by 2036) |
| Leading & Fastest-Growing Cell Technologies | TOPCon (52.0% share in 2026; 1.8% CAGR) | Back Contact (5.4% CAGR) |
| Leading & Fastest-Growing Paste Types | Fire-Through Front Paste (62.0% share in 2026; 1.6% CAGR) | Low-Temperature Paste (3.8% CAGR) |
| Largest Country Markets (2026 Global Share) | USA (11.0%), Japan (8.0%), South Korea (7.0%) |
| Fastest-Growing Country Markets (2026 to 2036) | USA (3.0% CAGR), Vietnam (2.7% CAGR), South Korea (1.9% CAGR) |
| Leading Tier-1 Companies | Heraeus, DK Electronic Materials, Changzhou Fusion New Material, Noritake |
Source: Future Market Insights analysis of the silver paste market, 2026.
Executive Market Overview
Global demand for silver paste rests on its role as the conductive grid of a solar cell, so cell makers buy against print line width, contact quality and silver consumed per watt, and paste revenue tracks cell output more than silver price. Asia-Pacific leads because monocrystalline solar cells lines concentrate there, while Vietnam and Malaysia are emerging as cell capacity relocates to Southeast Asia. The USA is the largest country market at an 11.0% share, followed by Japan at 8.0% and South Korea at 7.0%. The USA also grows fastest at a 3.0% CAGR as reshored cell lines qualify local paste supply for solar cells and modules, followed by Vietnam at 2.7% and South Korea at 1.9%.
Silver thrifting is the main restraint: every cut in silver per cell, and every shift toward copper metallization, shrinks paste revenue per watt even as cell volumes rise, while swings in silver powder and flakes costs squeeze converter margins. Suppliers are responding with fine-line TOPCon front and rear pastes for laser-enhanced contacts, low-temperature grades for heterojunction cells, metal-price pass-through contracts, and growth in electronics and automotive pastes beside conductive inks. FMI projects Back Contact at a 5.4% CAGR and Low-Temperature Paste at a 3.8% CAGR, against 2.0% for the market. Market sizing covers silver-bearing screen-printed pastes sold into solar cells, electronic components, automotive and touch panels, while excluding loose silver powder and flake, copper and aluminum pastes, and plating chemistries.
Analyst Perspective
“Silver paste suppliers will grow revenue faster than volume, because solar cell makers moving to high-efficiency TOPCon and heterojunction architectures pay for finer-line, low-temperature formulations. The commercial risk is silver price and substitution, since a metal spike can push cell makers toward copper metallization and squeeze paste margins on thin conversion spreads.”
- Nikhil Kaitwade, Principal Consultant, Future Market Insights (FMI)
Major Market Trends and Insights
- Back-Contact Cells Lead Growth as Copper Pressure Reshapes the Silver Paste Mix: Back-contact cells place all metallization on the rear, which lets manufacturers shift toward copper, so paste volumes grow while silver loading per cell falls. FMI projects back contact at a 5.4% CAGR, the fastest cell technology, against 1.8% for TOPCon, which holds 52.0% of 2026 demand. pv magazine (February 2026), citing a Heraeus report, noted that silver stood 187% above its early 2025 level and that paste accounts for up to 30% of total solar cell costs. The report added that copper performs well in back-contact cells, which remain a small share of the market. Heraeus, a tier-1 supplier in FMI's list, therefore faces a mix shift toward lower-silver formulations.
- US Antidumping Duties on Imported Cells Pull Paste Demand Toward Domestic Production: Tariff barriers around imported cells push buyers toward domestic cell production, and each new US cell line needs local paste supply. The U.S. Department of Commerce announced on September 11, 2026 final affirmative antidumping and countervailing duty determinations on crystalline silicon photovoltaic cells from India, Indonesia and Laos, with India's dumping margin set at 123.04%. Indian cell imports reached 2.30 billion watts in 2024. The petitioners include Hanwha Q CELLS USA, First Solar and Mission Solar Energy. Earlier orders already cover Cambodia, Malaysia, Thailand and Vietnam. FMI projects the USA at a 3.0% CAGR, the fastest of any country, with Vietnam at 2.7%. Paste suppliers with qualified US distribution gain an edge as import-dependent cell capacity gradually relocates onshore.
- Copper Substitution Caps Value Growth in Front-Side Paste Despite Volume Gains: Each cut in silver per cell lowers paste revenue per watt, which explains why fire-through front paste, with a 62.0% share in 2026, grows at only a 1.6% CAGR. pv magazine (January 2026) reported that DK Electronic Materials said a strategic customer adopted its high-copper paste at gigawatt scale, paired with a seed-layer silver paste compatible with TOPCon 3.0 processes. The same outlet (April 2026) reported that Fraunhofer ISE cut silver use to 1.1 mg/Wp from 10 to 12 mg/Wp using electrodeposition, with M10 cells reaching 24% efficiency, in line with conventional screen-printed cells. Copper substitution therefore caps value growth, and suppliers must defend revenue through copper-hybrid and low-temperature formulations.
What Are the Main Drivers, Restraints, and Opportunities?
PV cell throughput and fine-line contact requirements sustain recurring paste purchasing, while silver price exposure and switching validation restrain order values, which leaves validated low-silver and specialty low-temperature pastes as the addressable route to incremental revenue in TOPCon upgrades, heterojunction lines and electronic interconnects.
Driver: Recurring Paste Consumption at Operating PV Cell Lines
Paste is consumed in every electrode print run, not only at equipment installation, so operating lines reorder as wafers move through, a rhythm tied to polysilicon and wafer supply. IEA PVPS (April 2026) estimated 698 GW of new PV systems installed worldwide in 2025. Each line needs a metallization recipe matched to its wafer, screen pattern and firing profile. In electronics, silver pastes also form patterned interconnects where low-temperature processing or flexible substrates rule out conventional contacts. Buyers purchase against throughput and tested electrical performance, so suppliers with verified repeat volumes hold the strongest position.
Restraint: Silver Price Exposure and Requalification Barriers to Paste Switching
Silver loading makes the paste bill volatile, and price spikes push buyers toward lower laydown, a pressure also felt by silver nanowires users. Silver Institute (April 2026) said intense competition and rising silver raw material costs prompted PV manufacturers to accelerate thrifting. Its survey puts PV silver demand down 6% in 2025 at 186.6 million ounces, with a further 19% fall forecast for 2026. CEEW (May 2026) found that Indian cell makers source silver paste at nearly 24% higher cost. Switching grades also risks wafer breakage and contact losses, so qualification can outlast the price signal.
Opportunity: Validated Low-Silver and Specialty Low-Temperature Pastes
A supplier that delivers lower laydown without losing conversion efficiency protects customer economics, and the same paste science serves conductive inks in electronics. pv magazine (May 2025) reported that UNSW and Changzhou Fusion New Materials cut rear-side silver use in a 25%-efficient TOPCon cell by 85% with a silver-lean printing technique. Fraunhofer ISE (April 2026) lowered silver use to 1.1 mg/Wp, against current levels of 10 to 12 mg/Wp, using electrodeposition. That plated route is also the competition paste makers must match. FMI projects silver-coated copper pastes at a 9.2% CAGR and low-temperature heterojunction pastes at 7.8% through 2036. Full-line evidence on firing windows and reliability still decides adoption.
How Is the Silver Paste Market Segmented?
The global silver paste market is segmented by application, cell technology, paste type, silver content, and region, with each axis describing a different purchasing attribute of the same paste revenue.
| Segmentation Axis | Sub-Segments Covered | 2026 Leading Segment & Share | Main Growth Benchmark (2026 to 2036) |
|---|---|---|---|
| Cell Technology | TOPCon, Heterojunction (Low-Temperature Paste), PERC and Legacy, Back Contact, Non-Solar Uses | TOPCon (52.0% revenue share) | Back Contact (5.4% CAGR) vs. TOPCon (1.8% CAGR) |
| Application | Solar Cell Front Side, Electronic Components and Circuits, Automotive and Others, Solar Cell Rear Side, Touch Panels and Displays | Solar Cell Front Side (58.0% revenue share) | Share eases to 54.5% by 2036; Automotive and Others leads growth at 3.4% CAGR |
| Paste Type | Fire-Through Front Paste, Low-Temperature Paste, Rear and Busbar High-Temperature Paste, Polymer Thick Film for Electronics | Fire-Through Front Paste (62.0% revenue share) | Low-Temperature Paste (3.8% CAGR) vs. Fire-Through Front Paste (1.6% CAGR) |
| Silver Content | Above 90 Percent Silver, 85 to 90 Percent Silver, 70 to 85 Percent Silver, Below 70 Percent Silver | Above 90 Percent Silver (30.0% revenue share) | Below 70 Percent Silver leads growth at 4.4% CAGR |
| Region | USA, Japan, South Korea, Vietnam, and other countries | USA (11.0% global share), followed by Japan (8.0%) and South Korea (7.0%) | USA leads national growth at 3.0% CAGR, ahead of Vietnam (2.7%) |
Source: Future Market Insights analysis of the silver paste market, 2026.
Where Does the Pressure on the Solar Cell Front Side Come From?
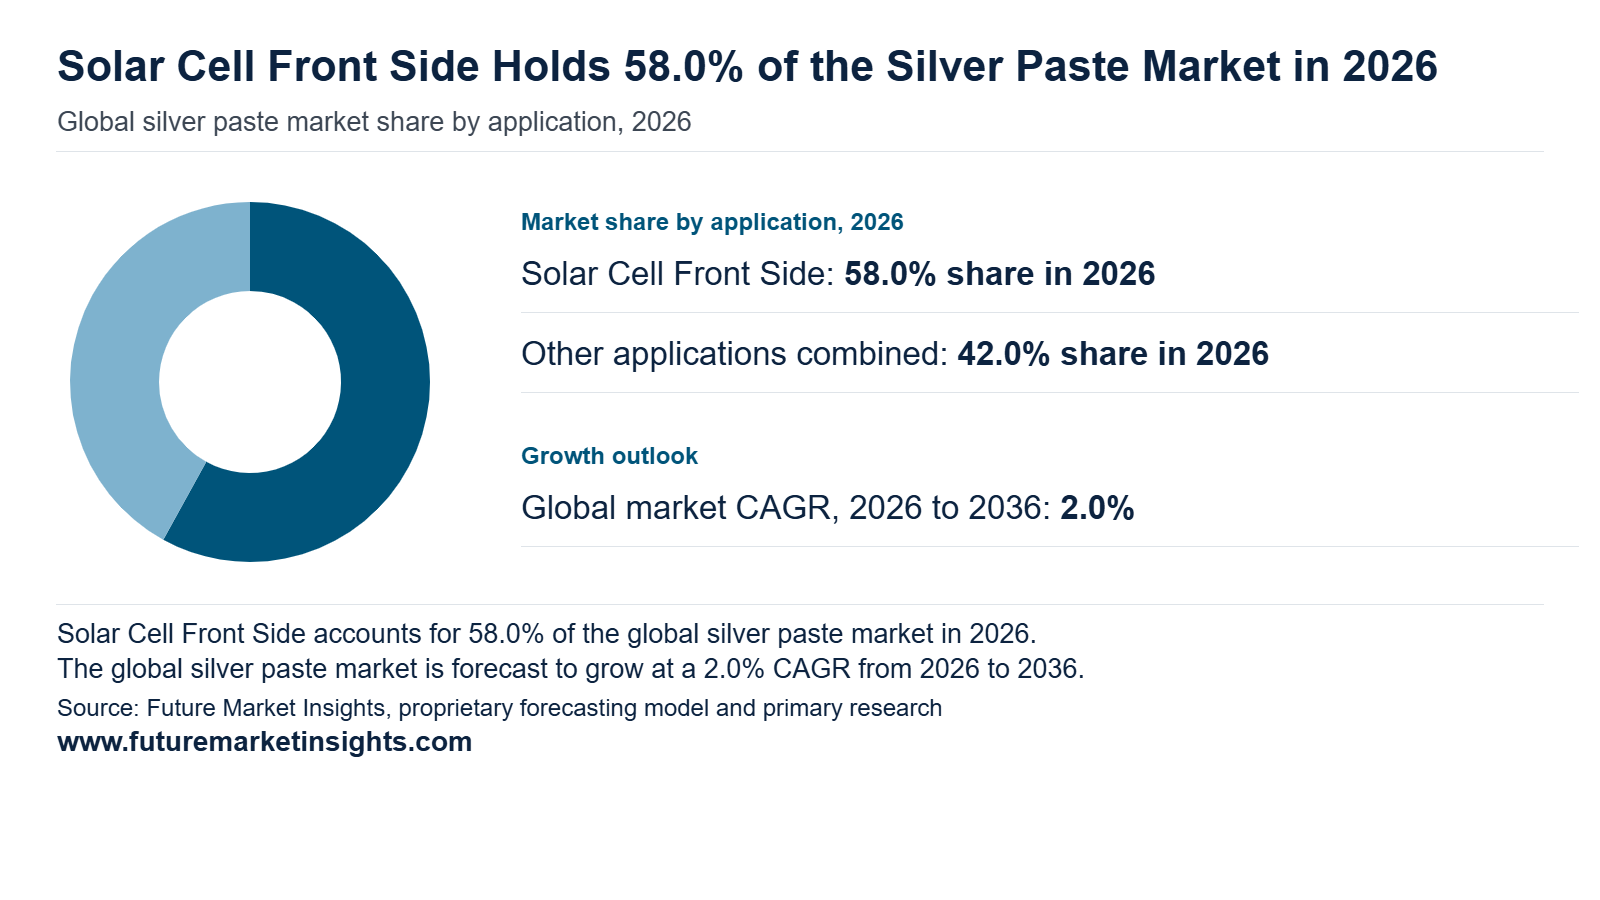
A UNSW-led TOPCon printing scheme that trims silver use by over 80% on existing manufacturing infrastructure (Solar Energy Materials and Solar Cells, 2025) shows where the pressure sits: the front grid, which absorbs 58.0% of application revenue now and 54.5% in 2036, a 1.4% annual rate. Cell makers buy it on conducted current, line breaks and print speed, and finger width ties efficiency directly to metal weight. Automotive and Others, rising 3.4% annually, has the quicker pace, while rear-side, electronics and display work follows separate specifications, as every solar cell grid designer knows.
Why Does TOPCon Remain the Volume Buyer?
Back Contact is the architecture gaining pace, climbing 5.4% a year, but TOPCon is where the tonnage goes, with 52.0% of 2026 cell technology revenue and 51.0% by 2036 (1.8% CAGR). The reason is practical. Its contacts sit on doped, passivated layers, so powder size, glass and firing are matched to each emitter and rear layout, and heterojunction or PERC lines cannot borrow the recipe. In June 2026 the VDMA’s ITRPV again ranked TOPCon first and noted rising laser-enhanced contact use, which keeps a bifacial solar module line tied to specialist pastes.
What Lets Fire-Through Paste Do Two Jobs at Once?
A fire-through paste eats through the passivation layer during firing and leaves a conducting contact without raising recombination. Lines are already tuned for it, which explains a 62.0% paste type share in 2026 that eases to 59.6% by 2036 (1.6% a year). Low-Temperature Paste, rising 3.8% annually, serves stacks that cannot take the heat; rear and busbar grades prioritize joining; polymer thick films, closer to printed electronics, cure instead. TaiyangNews describes DK Electronic Materials selling separate laser-enhanced-firing pastes for front (DK72E), rear (DK95E) and busbar (DK82E), so no single recipe covers every step.
Does Thrifting Dethrone High-Silver Paste?
Pastes above 90 percent silver still make up the largest slice of silver content, 30.0% in 2026 and 29.1% in 2036 (1.7% a year), because dense metal keeps narrow lines continuous. It is a plurality, not a majority, and cost per watt decides purchases. Below 70 Percent Silver is the bracket to watch, expanding 4.4% annually as validated lean recipes reach the same equipment. The Silver Institute (April 2026) put 2025 photovoltaic silver demand at 186.6 million ounces, down 6%, as makers thrifted, a test for silver powder and flakes suppliers.
Silver Paste Market by Region and Country (2026 to 2036)
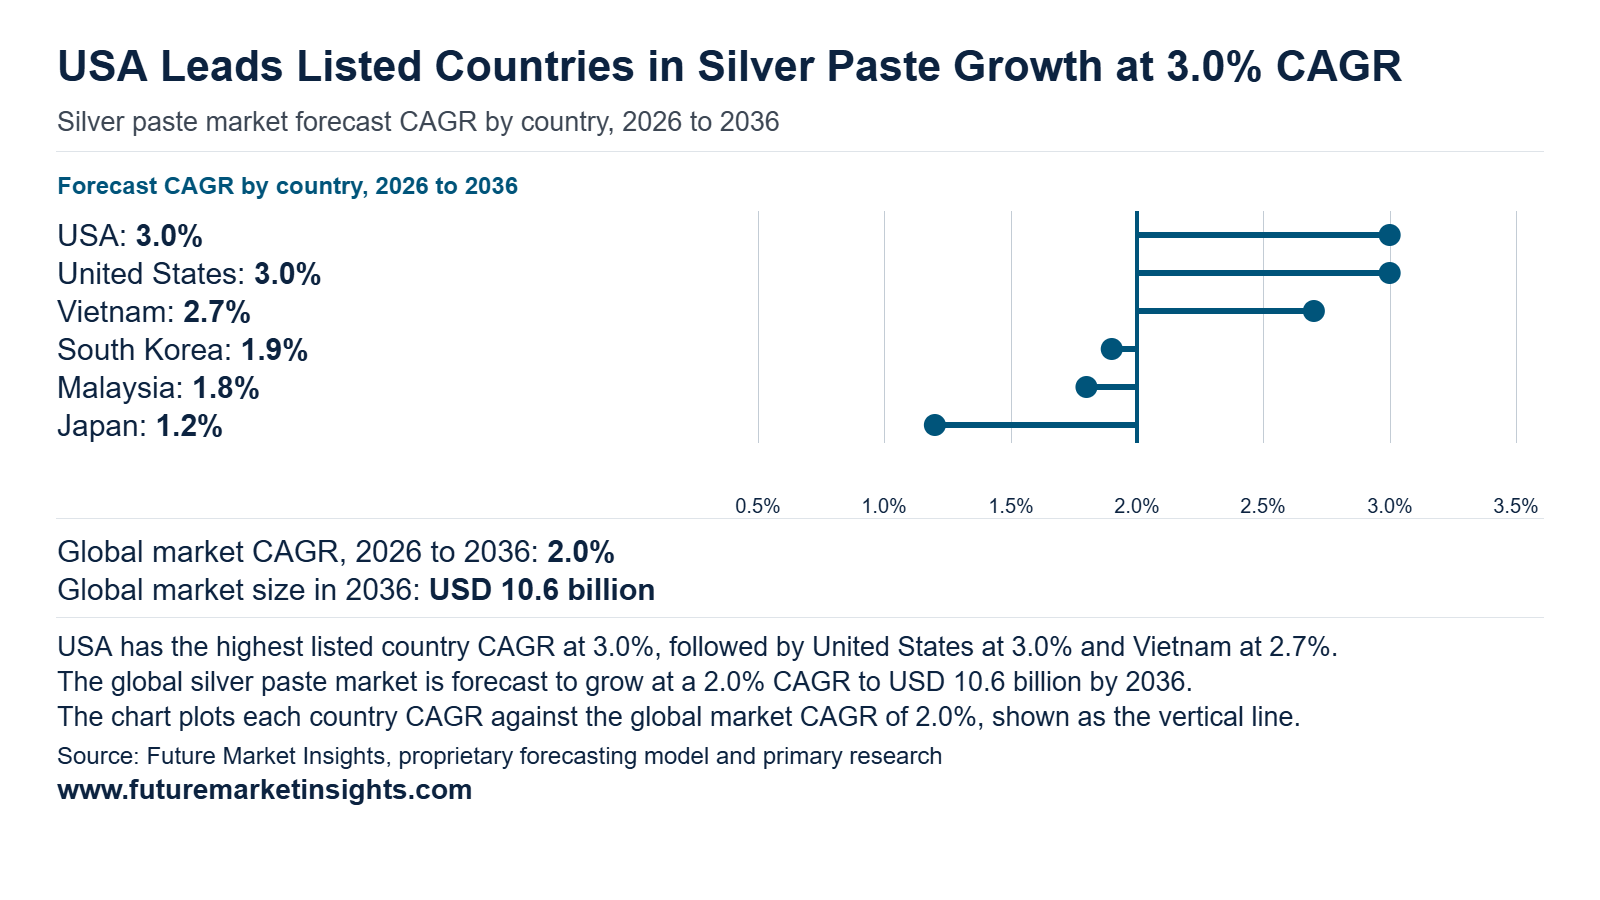
The five tracked countries hold 33.0% of global silver paste revenue in 2026, so most demand sits in untracked markets. That untracked share narrows slightly from 67.0% to 66.4% by 2036 as the tracked share edges up to 33.6%. The United States leads and gains, lifting its share from 11.0% to 12.1% while adding USD 329 million. Japan loses ground, falling from 8.0% to 7.4%. The Vietnam and Malaysia cluster grows from USD 609 million to USD 757 million, an addition of USD 148 million.
| Country | 2026 Revenue | 2036 Revenue | 10-Year Addition | 2026 to 2036 CAGR | Global Share (2026 → 2036) |
|---|---|---|---|---|---|
| United States | USD 957 million | USD 1,286 million | USD 329 million | 3.0% | 11.0% → 12.1% |
| Vietnam | USD 261 million | USD 341 million | USD 80 million | 2.7% | 3.0% → 3.2% |
| South Korea | USD 609 million | USD 735 million | USD 126 million | 1.9% | 7.0% → 6.9% |
| Malaysia | USD 348 million | USD 416 million | USD 68 million | 1.8% | 4.0% → 3.9% |
| Japan | USD 696 million | USD 784 million | USD 88 million | 1.2% | 8.0% → 7.4% |
Source: Future Market Insights analysis of the silver paste market, 2026.
United States
Demand follows domestic solar build-out and onshoring of cell production. Developers plan to add 43.4 GW of utility-scale solar in 2026, a 60% increase on 2025 if realized (U.S. Energy Information Administration, 2026), and Qcells began cell manufacturing at its Cartersville, Georgia factory in June 2026 (Qcells, June 2026). Local cell lines buy front-side paste domestically instead of embedded in imported cells, so paste suppliers with US qualification and silver price pass-through terms gain pricing power and volume. The United States is projected to rise from USD 957 million in 2026 to USD 1,286 million in 2036, a 3.0% CAGR that adds USD 329 million, a 1.34-fold expansion.
Japan
Noritake has developed a silver paste for through-glass vias in glass substrates for advanced semiconductor 3D packaging (Noritake, November 2025), and its fiscal 2025 results presentation highlights silver paste bonding material for automotive power semiconductors (Noritake, May 2026). Paste value in Japan therefore migrates from solar front-side lines toward power and packaging applications, where qualification cycles are long and volumes are small, which holds the CAGR to the lowest of the five tracked countries. Japan grows from USD 696 million in 2026 to USD 784 million in 2036, a 1.2% CAGR with USD 88 million of addition, a 1.13-fold gain. Its share slips from 8.0% to 7.4%, the steepest decline among the tracked countries, as mature solar demand gives way to electronics uses.
South Korea
South Korea rises from USD 609 million in 2026 to USD 735 million in 2036, a 1.9% CAGR and USD 126 million of addition, a 1.21-fold increase. Its share eases from 7.0% to 6.9%. Hanwha Qcells anchors local demand, operating production facilities in the U.S., Korea and Malaysia (Hanwha, October 2025), and it runs a pilot tandem-cell production line at its Jincheon factory (Hanwha, January 2025). Tandem cells typically require low-temperature pastes, the fastest-growing paste type. Offsetting this, elevated silver prices have accelerated thrifting and substitution in solar cells (Silver Institute, November 2026), which trims paste loading per cell. Korean paste buyers therefore trade lower silver content against higher unit prices, so revenue growth stays just below the 2.0% global rate.
Malaysia
Malaysia grows from USD 348 million in 2026 to USD 416 million in 2036, a 1.8% CAGR with USD 68 million of addition, a 1.20-fold gain. Malaysia hosts an almost complete solar ecosystem of about 250 companies, from polysilicon, wafers and cells to modules (Malaysian Investment Development Authority, 2026), so paste demand is tied to export-oriented cell lines. US trade remedies cut that export route. Commerce issued antidumping duty orders on solar cells from Cambodia, Malaysia, Thailand and Vietnam (Federal Register, June 2025), and Malaysia's trade ministry urged producers to tap ASEAN markets to reduce reliance on the United States (MITI, March 2025). Lower US volumes keep growth near the group floor.
Vietnam
Its share grows from 3.0% to 3.2%. Vietnam posts the second-fastest CAGR at 2.7%, rising from USD 261 million in 2026 to USD 341 million in 2036, an addition of USD 80 million and a 1.31-fold expansion. Export cell lines face the same June 2025 duty orders that cover Malaysia (Federal Register, June 2025), while domestic demand is being opened. The Ministry of Industry and Trade held a nationwide conference on September 29 to promote rooftop solar at government offices, schools, hospitals and households under a March 2026 prime ministerial directive (Ministry of Industry and Trade of Vietnam, October 2026). Rooftop programs create domestic module demand, so local paste distribution and technical support become the entry point for suppliers.
Competitive Environment and Notable Companies
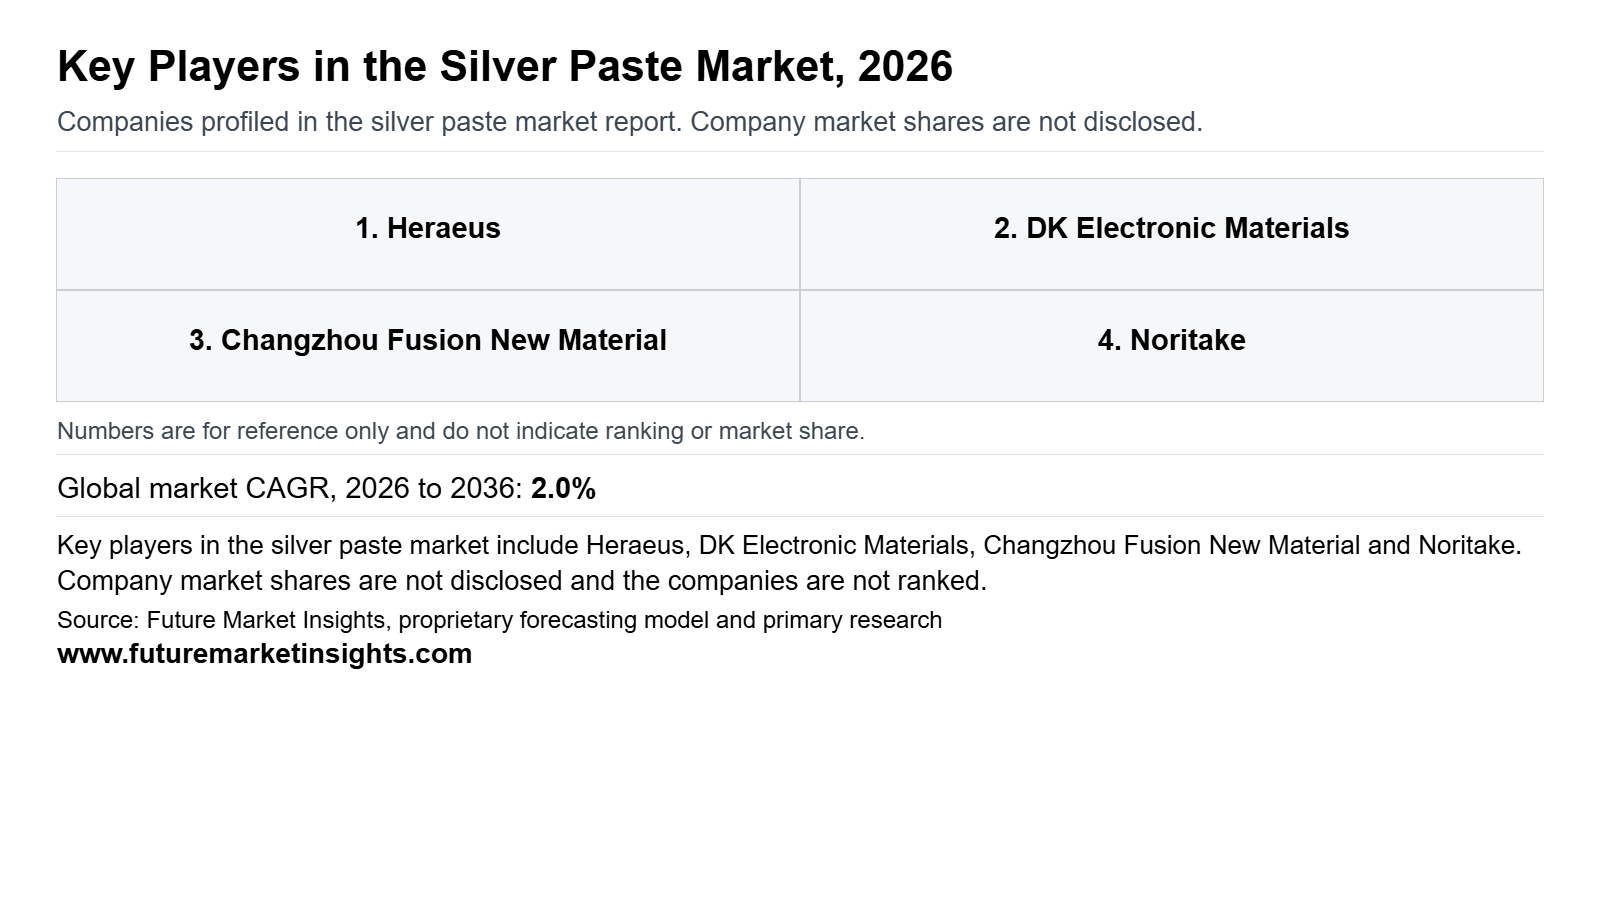
Notable companies operating in the global silver paste market include Heraeus, DK Electronic Materials, Changzhou Fusion New Material, Giga Solar Materials, Daejoo Electronic Materials, Noritake, Namics and Sun Chemical. Competition separates along the customer process rather than by a single global hierarchy. Solar-cell metallization specialists, multi-application conductive and bonding suppliers, and flexible printed-electronics formulators serve different buyers with different firing or curing profiles. Rising silver prices have pushed suppliers toward lower-silver and copper-based pastes, so standing depends on process fit and silver efficiency as much as on scale.
How Are Companies Positioned in the Silver Paste Market?
Companies sit in three positions. Heraeus, DK Electronic Materials, Changzhou Fusion New Material and Giga Solar Materials focus on fired-contact and tailored electrode systems for solar cells. Daejoo Electronic Materials and Noritake bridge specialized electronics and silver-bearing electrode or bond materials, supplying buyers beyond photovoltaics. Namics and Sun Chemical address silver traces, printed functions and low-temperature substrate integration for flexible and molded devices. These groups rarely compete for the same order, because each paste is qualified against a different process, substrate and reliability requirement.
What Matters When a Buyer Selects a Silver Paste Supplier?
Customer decisions depend on whether a paste works in the actual cell-firing or device-curing profile. A cell manufacturer needs contact quality, line-width control and compatibility with its cell structure, while an electronics maker needs adhesion, conductivity and reliability on its substrate. Silver content now weighs heavily, since silver paste can reach up to 30% of solar cell cost. Buyers therefore ask for lower-silver options, qualification support and stable supply, and they prefer suppliers able to run trials without disrupting an existing line.
Which Capabilities Distinguish Product Offers?
Product offers are distinguished by application breadth and silver efficiency. Solar specialists document front and rear electrode formulations and are extending into silver-coated copper and high-copper pastes. Noritake develops silver bonding and interconnect pastes, including a silver paste for through glass vias. Namics offers stretchable pastes for flexible electronics, and Sun Chemical supplies SunTronic silver inks, including lower-silver and recycled-content versions. Published test evidence on firing, curing and adhesion separates suppliers with qualified products from those with research claims alone.
How Does Geographic Reach Affect Competition?
Geographic reach must be read as documented operations or product channels, not as proof of sales share. Heraeus operates from Germany, while DK Electronic Materials and Changzhou Fusion New Material are anchored in China, where cell production is concentrated. Giga Solar Materials serves Taiwan and exports, and Daejoo Electronic Materials works from South Korea. Noritake and Namics are Japanese suppliers with Asian sales operations, and Sun Chemical supplies printed-electronics channels in Europe and elsewhere. Proximity to cell and device plants helps with trials and technical support.
| Verified Company Evidence (2026) | Commercial Effect | Buyer Action |
|---|---|---|
| January 2026: DK Electronic Materials said its high-copper metallization paste met a gigawatt-scale production target at an unnamed strategic customer, combining copper paste with a seed-layer silver paste compatible with n-type and TOPCon 3.0 processes [pv magazine (January 2026)] | Shows a lower-silver paste moving into volume cell production, although the customer is unnamed and no share is disclosed | Qualify copper-containing pastes on your own line before committing volumes |
| 11 December 2025: Noritake developed a silver paste for Through Glass Via interconnects in 3D-packaged semiconductors, meant to replace copper plating. The via is filled with paste and sintered, which the release says cuts processing time and removes pre-plating steps [Noritake (December 2025)] | Extends silver paste into advanced packaging, but the release does not state that it is on sale, and gives no availability or pricing | Treat as a development item and request qualification samples before planning supply |
| 9 September 2026: Fusion Materials reported H1 2026 PV conductive paste sales of 636 metric tons and revenue of RMB 10.60 billion, up 64.75% year on year, mainly driven by higher average silver prices [TaiyangNews (September 2026)] | Revenue growth reflects silver pricing more than volume, so price pass-through is the main commercial lever | Check silver-linked pricing clauses in paste contracts |
Source: Verified corporate disclosures and Future Market Insights analysis, 2026.
| Company | Core Positioning | Verified Activity & Source Attribution |
|---|---|---|
| Heraeus | PV metallization pastes | Heraeus said silver remained 187% higher than at the start of 2025 and expects PV silver demand to decline in 2026, as manufacturers explore copper and other alternatives [pv magazine (February 2026)] |
| DK Electronic Materials | PV metallization for TOPCon, BC and HJT | Showed silver, silver-nickel, silver-coated copper and pure copper pastes at SNEC 2026 [TaiyangNews (2026)] |
| Changzhou Fusion New Material | PV conductive paste at scale | H1 2026 sales of 636 metric tons [TaiyangNews (September 2026)] |
| Giga Solar Materials | Taiwan-based PV conductive pastes | Positioning only: silver paste is named among its products with aluminum and silver-aluminum paste [EnergyTrend]. No dated 2026 activity verified |
| Daejoo Electronic Materials | Conductive pastes and solar electrode materials in a broad electronic-materials portfolio | Reported by industry sources on 4 August 2026 to be undergoing quality evaluation for electrode materials on SpaceX's space solar cell line [Asia Economy (August 2026)] |
| Noritake | Silver bonding and interconnect compositions | TGV silver paste, 11 December 2025 [Noritake (December 2025)] |
| Namics | Stretchable silver pastes for flexible and molded electronics | Positioning only [Komachine directory]. No dated 2026 activity verified |
| Sun Chemical | SunTronic silver-based functional inks | Showed silver inks with increased recycled content at LOPEC 2026 (24 to 26 February) and a new conductive ink with lower silver content [Sun Chemical (February 2026)] |
Source: Verified corporate disclosures and Future Market Insights analysis, 2026.
Silver Paste Market Report Scope and Research Methodology
FMI sizes the global silver paste market from the revenue earned on silver-bearing conductive pastes sold for solar-cell, electronics, automotive, display, and related applications, cross-checked against wider national photovoltaic materials and electronic materials industry totals. Solar cell front side and rear side pastes anchor the model because they account for the majority of global revenue, supported by sales into electronic components and circuits, automotive uses, and touch panels and displays. Revenue is counted only for separable silver paste value, with finished modules and devices, equipment, services, and substitute or adjacent metal-paste categories excluded, and bundled systems counted only for the paste component. Primary interviews with paste formulators, cell manufacturers, electronics makers, and procurement teams are combined with desk research on trade data, regulatory publications, standards, and company filings. Cell technology, paste type, and silver content estimates are reconciled so that segment and national figures sum to the global market total in every year. Company disclosures are used strictly to verify product positioning, formulations, and launches rather than to estimate proprietary company revenues.
| Coverage Field | Report Scope |
|---|---|
| Market definition | Revenue from silver-bearing conductive pastes sold for the specified solar-cell, electronics, automotive, display, and related applications. |
| Applications | Solar cell front side, electronic components and circuits, automotive and others, solar cell rear side, and touch panels and displays. |
| Cell technologies | TOPCon, heterojunction (low-temperature paste), PERC and legacy, back contact, and non-solar uses. |
| Paste types | Fire-through front paste, low-temperature paste, rear and busbar high-temperature paste, and polymer thick film for electronics. |
| Silver content | Above 90 percent silver, 85 to 90 percent silver, 70 to 85 percent silver, and below 70 percent silver. |
| Exclusions | Finished module and device revenue, equipment, services, and substitute or adjacent metal-paste categories. |
| Quantitative units | USD billion for value. |
| Value basis | Revenue from sales of silver paste to buyers in each country, with bundled systems counted only for separable silver paste revenue. |
| Regions covered | North America, Latin America, Western Europe, Eastern Europe, East Asia, South Asia and Pacific, and Middle East and Africa. |
| National coverage | USA, China, India, Vietnam, Malaysia, South Korea, and Japan. |
| Companies covered | Heraeus, DK Electronic Materials, Changzhou Fusion New Material, Giga Solar Materials, Daejoo Electronic Materials, Noritake, Namics, and Sun Chemical. |
| Forecast period | 2026 to 2036. |
| Approach | Primary and secondary research with market triangulation, followed by data validation against independent indicators to avoid double counting. |
Source: Future Market Insights analysis of the silver paste market, 2026.
Research Sources and Bibliography
- Asia Economy (August 2026). Which Korean Company Is Emerging as the Supplier of Space Solar Materials for SpaceX? https://view.asiae.co.kr/en/article/2026080408503788170
- Council on Energy, Environment and Water (May 2026). Advancing Solar Cell Manufacturing in India: Bridging Gaps in Cell Technology and Lowering Manufacturing Costs. https://www.ceew.in/node/4962
- EnergyTrend (n.d.). Total Contracted Capacity Reaches 760MW, BC Modules Gain High Recognition from Taiwanese Customers (LONGi and GIGA SOLAR agreements). https://www.energytrend.com/print/50123
- Federal Register (June 2025). Crystalline Silicon Photovoltaic Cells, Whether or Not Assembled Into Modules From the Socialist Republic of Vietnam: Amended Final Antidumping Duty Determination; Crystalline Silicon Photovoltaic Cells, Whether or Not Assembled Into Modules From Cambodia, Malaysia, Thailand, and the Socialist Republic of Vietnam: Antidumping Duty Orders. https://www.federalregister.gov/documents/2025/06/24/2025-11588/crystalline-silicon-photovoltaic-cells-whether-or-not-assembled-into-modules-from-the-socialist
- Hanwha (October 2025). Hanwha Qcells named an S&P Global 2025 Tier 1 Cleantech company. https://www.hanwha.com/newsroom/news/press-releases/hanwha-qcells-named-an-s-p-global-2025-tier-1-cleantech-company.do
- Hanwha (January 2025). Perovskite-silicon tandem cells move from theory to reality with Hanwha Qcells’ breakthrough. https://www.hanwha.com/newsroom/news/feature-stories/perovskite-silicon-tandem-cells-move-from-theory-to-reality-with-hanwha-qcells-breakthrough.do
- IEA PVPS (April 2026). Snapshot of Global PV Markets 2026 (Task 1, report IEA-PVPS T1-49:2026). https://iea-pvps.org/snapshot-reports/snapshot-2026/
- Malaysian Investment Development Authority (2026). Electrical & Electronic Products: Electrical Products. https://www.mida.gov.my/industries/manufacturing/electrical-electronics/electrical-electronic-products-electrical-products/
- Ministry of Industry and Trade, Vietnam (September 2026). Ministry of Industry and Trade promotes rooftop solar power development for government offices, schools, hospitals and households. https://moit.gov.vn/en/news/ministry-of-industry-and-trade-promotes-rooftop-solar-power-development-for-government-offices-schools-hospitals-and-hou.html
- Ministry of Investment, Trade and Industry, Malaysia (March 2025). MITI urges solar industry to tap ASEAN markets amid US tariff. https://www.mida.gov.my/mida-news/miti-urges-solar-industry-to-tap-asean-markets-amid-us-tariff/
- Noritake (December 2025). Development of Silver Paste for TGV Supporting the AI Era. https://www.noritake.co.jp/eng/news/detail/692/
- Noritake (May 2026). Results for the Year Ended March 31, 2026 (presentation). https://www.noritake.co.jp/upload/ir_images/b7d122db79f4ca446bfa1d8b3c2921f6.pdf
- pv magazine (January 2026). DK Electronic Materials client adopts copper paste in GW-scale cell output. https://www.pv-magazine.com/2026/01/20/dk-electronic-materials-customer-adopts-copper-paste-in-gw-scale-cell-production/
- pv magazine (April 2026). New tech reduces silver use in TOPCon solar cells by a factor of 10. https://www.pv-magazine.com/2026/04/10/new-tech-reduces-silver-use-in-topcon-solar-cells-by-a-factor-of-10/
- pv magazine (April 2026). Silver demand from PV industry expected to drop 19% this year. https://www.pv-magazine.com/2026/04/15/silver-demand-from-pv-industry-expected-to-drop-19-this-year/
- pv magazine (May 2025). Silver-lean screen-printing can reduce silver use in TOPCon solar cells by 40%. https://www.pv-magazine.com/2025/05/08/silver-lean-screen-printing-can-reduce-silver-use-in-topcon-solar-cells-by-40/
- pv magazine (February 2026). Silver-saving efforts ramping up in solar industry, says Heraeus. https://www.pv-magazine.com/2026/02/16/silver-saving-efforts-ramping-up-in-solar-industry-says-heraeus/
- Qcells (June 2026). Qcells Begins Solar Cell Manufacturing at America’s First and Only Vertically Integrated Solar Factory in Cartersville, Georgia. https://us.qcells.com/blog/qcells-begins-solar-cell-manufacturing-at-americas-first-and-only-vertically-integrated-solar-factory-in-cartersville-georgia/
- Silver Institute (April 2026). Elevated Lease Rates, Regional Liquidity Tightness, and Robust Investor Interest Resulted in Record Silver Prices in 2025 (World Silver Survey 2026 press release). https://silverinstitute.org/?p=20226
- Silver Institute (November 2026). Silver Market Set for Sixth Consecutive Annual Deficit in 2026. https://silverinstitute.org/silver-market-set-for-sixth-consecutive-annual-deficit-in-2026/
- Sun Chemical (February 2026). Sun Chemical to showcase extensive electronic materials solutions at LOPEC 2026 in Munich. https://www.sunchemical.com/sun-chemical-to-showcase-extensive-electronic-materials-solutions-at-lopec2026-in-munich/
- TaiyangNews (September 2026). China Solar PV News Snippets, September 9, 2026. https://taiyangnews.info/markets/china-solar-pv-news-snippets-september-9-2026
- TaiyangNews (July 2026). DKEM’s Metallization Solutions For Advanced Cell Technologies & Silver-Lean Requirements. https://taiyangnews.info/technology/dkem-metallization-topcon-hjt-bc-silver-nickel-copper-paste
- TaiyangNews (January 2024). DKEM’s Pastes Powering TOPCon, Today and Tomorrow. https://taiyangnews.info/technology/dkems-pastes-powering-topcon-today-and-tomorrow
- U.S. Department of Commerce, International Trade Administration (September 2026). Final Affirmative Determinations in the Antidumping Duty and Countervailing Duty Investigations of Crystalline Silicon Photovoltaic Cells from India, Indonesia, and the Lao People’s Democratic Republic. https://www.trade.gov/final-affirmative-determinations-antidumping-duty-and-countervailing-duty-investigations-0
- U.S. Energy Information Administration (February 2026). New U.S. electric generating capacity expected to reach a record high in 2026. https://www.eia.gov/todayinenergy/detail.php?id=67205
- VDMA Photovoltaic Equipment (June 2026). International Technology Roadmap for Photovoltaics (ITRPV), 17th Edition. https://www.qualenergia.it/wp-content/uploads/2026/06/ITRPV-17-Edition.pdf
- Zhang, Y., Wang, S., Wang, L., et al. (2025). Silver-lean screen-printing metallisation for industrial TOPCon solar cells: Enabling an 80% reduction in silver consumption. Solar Energy Materials and Solar Cells, 288. Summary: Australian Centre for Advanced Photovoltaics, ACAP UNSW Team Develops Printing Solution for TOPCon’s Silver Problem. https://www.acap.org.au/post/acap-unsw-team-solves-topcon-s-silver-problem
Table of Content
- Key Takeaways
- Market Size and CAGR
- Top Growth Driver
- Fastest Growing Segment
- Leading Region
- Key Companies
- Emerging Opportunities
- Executive Summary
- Global Market Outlook
- Demand-side Trends
- Supply-side Trends
- Technology Roadmap Analysis
- Analysis and Recommendations
- Analyst Perspective (What is happening? Why now? What should investors know?)
- Key Questions Answered
- How large is the market?
- What is the CAGR?
- What are key trends?
- Which region dominates?
- Who are the leaders?
Read More...
- Market Overview
- Market Coverage / Taxonomy
- Market Definition / Scope / Limitations
- Research Methodology
- Chapter Orientation
- Analytical Lens and Working Hypotheses
- Market Structure, Signals, and Trend Drivers
- Benchmarking and Cross-market Comparability
- Market Sizing, Forecasting, and Opportunity Mapping
- Research Design and Evidence Framework
- Desk Research Programme (Secondary Evidence)
- Expert Input and Fieldwork (Primary Evidence)
- Tooling, Models, and Reference Databases
- Data Engineering and Model Build
- Quality Assurance and Audit Trail
- Market Background
- Market Dynamics (Drivers, Restraints, Opportunity, Trends)
- Scenario Forecast (Optimistic, Likely, Conservative)
- Impact Analysis
- AI Impact
- Sustainability Impact
- Regulatory Impact
- Technology Impact
- Consumer / Buyer Analysis
- Purchase Drivers
- Adoption Barriers
- Buyer Journey
- Opportunity Map Analysis
- Product Life Cycle Analysis
- Supply Chain Analysis
- Investment Feasibility Matrix
- Value Chain Analysis
- PESTLE and Porter's Analysis
- Regulatory Landscape
- Regional Parent Market Outlook
- Production and Consumption Statistics
- Import and Export Statistics
- Global Market Analysis and Forecast, 2021 to 2036
- Historical Market Size Value (USD Million) Analysis, 2021 to 2025
- Current and Future Market Size Value (USD Million) Projections, 2026 to 2036
- Y-o-Y Growth Trend Analysis
- Absolute $ Opportunity Analysis
- Global Market Pricing Analysis, 2021 to 2036
- Global Market Analysis and Forecast, By Application, 2021 to 2036
- Introduction / Key Findings
- Historical Market Size Value (USD Million) Analysis By Application, 2021 to 2025
- Current and Future Market Size Value (USD Million) Analysis and Forecast By Application, 2026 to 2036
- Solar Cell Front Side
- Electronic Components and Circuits
- Automotive and Others
- Solar Cell Rear Side
- Touch Panels and Displays
- Y-o-Y Growth Trend Analysis By Application, 2021 to 2025
- Absolute $ Opportunity Analysis By Application, 2026 to 2036
- Global Market Analysis and Forecast, By Cell Technology, 2021 to 2036
- Introduction / Key Findings
- Historical Market Size Value (USD Million) Analysis By Cell Technology, 2021 to 2025
- Current and Future Market Size Value (USD Million) Analysis and Forecast By Cell Technology, 2026 to 2036
- TOPCon
- Heterojunction (low-Temperature Paste)
- PERC and Legacy
- Back Contact
- Non-Solar Uses
- Y-o-Y Growth Trend Analysis By Cell Technology, 2021 to 2025
- Absolute $ Opportunity Analysis By Cell Technology, 2026 to 2036
- Global Market Analysis and Forecast, By Paste Type, 2021 to 2036
- Introduction / Key Findings
- Historical Market Size Value (USD Million) Analysis By Paste Type, 2021 to 2025
- Current and Future Market Size Value (USD Million) Analysis and Forecast By Paste Type, 2026 to 2036
- Fire-Through Front Paste
- Low-Temperature Paste
- Rear and Busbar High-Temperature Paste
- Polymer Thick Film for Electronics
- Y-o-Y Growth Trend Analysis By Paste Type, 2021 to 2025
- Absolute $ Opportunity Analysis By Paste Type, 2026 to 2036
- Global Market Analysis and Forecast, By Silver Content, 2021 to 2036
- Introduction / Key Findings
- Historical Market Size Value (USD Million) Analysis By Silver Content, 2021 to 2025
- Current and Future Market Size Value (USD Million) Analysis and Forecast By Silver Content, 2026 to 2036
- Above 90 Percent Silver
- 85 to 90 Percent Silver
- 70 to 85 Percent Silver
- Below 70 Percent Silver
- Y-o-Y Growth Trend Analysis By Silver Content, 2021 to 2025
- Absolute $ Opportunity Analysis By Silver Content, 2026 to 2036
- Global Market Analysis and Forecast, By Region, 2021 to 2036
- Introduction
- Historical Market Size Value (USD Million) Analysis By Region, 2021 to 2025
- Current Market Size Value (USD Million) Analysis and Forecast By Region, 2026 to 2036
- North America
- Latin America
- Western Europe
- Eastern Europe
- East Asia
- South Asia and Pacific
- Middle East and Africa
- Market Attractiveness Analysis By Region
- North America Market Analysis and Forecast, By Country, 2021 to 2036
- Historical Market Size Value (USD Million) Trend Analysis By Market Taxonomy, 2021 to 2025
- Market Size Value (USD Million) Forecast By Market Taxonomy, 2026 to 2036
- By Country
- United States
- Canada
- By Application
- By Cell Technology
- By Paste Type
- By Silver Content
- By Country
- Market Attractiveness Analysis
- By Country
- By Application
- By Cell Technology
- By Paste Type
- By Silver Content
- Key Takeaways
- Latin America Market Analysis and Forecast, By Country, 2021 to 2036
- Historical Market Size Value (USD Million) Trend Analysis By Market Taxonomy, 2021 to 2025
- Market Size Value (USD Million) Forecast By Market Taxonomy, 2026 to 2036
- By Country
- Brazil
- Mexico
- Argentina
- Chile
- By Application
- By Cell Technology
- By Paste Type
- By Silver Content
- By Country
- Market Attractiveness Analysis
- By Country
- By Application
- By Cell Technology
- By Paste Type
- By Silver Content
- Key Takeaways
- Western Europe Market Analysis and Forecast, By Country, 2021 to 2036
- Historical Market Size Value (USD Million) Trend Analysis By Market Taxonomy, 2021 to 2025
- Market Size Value (USD Million) Forecast By Market Taxonomy, 2026 to 2036
- By Country
- Germany
- France
- United Kingdom
- Italy
- Spain
- Benelux
- Nordics
- By Application
- By Cell Technology
- By Paste Type
- By Silver Content
- By Country
- Market Attractiveness Analysis
- By Country
- By Application
- By Cell Technology
- By Paste Type
- By Silver Content
- Key Takeaways
- Eastern Europe Market Analysis and Forecast, By Country, 2021 to 2036
- Historical Market Size Value (USD Million) Trend Analysis By Market Taxonomy, 2021 to 2025
- Market Size Value (USD Million) Forecast By Market Taxonomy, 2026 to 2036
- By Country
- Poland
- Czech Republic
- Romania
- Hungary
- By Application
- By Cell Technology
- By Paste Type
- By Silver Content
- By Country
- Market Attractiveness Analysis
- By Country
- By Application
- By Cell Technology
- By Paste Type
- By Silver Content
- Key Takeaways
- East Asia Market Analysis and Forecast, By Country, 2021 to 2036
- Historical Market Size Value (USD Million) Trend Analysis By Market Taxonomy, 2021 to 2025
- Market Size Value (USD Million) Forecast By Market Taxonomy, 2026 to 2036
- By Country
- China
- Japan
- South Korea
- By Application
- By Cell Technology
- By Paste Type
- By Silver Content
- By Country
- Market Attractiveness Analysis
- By Country
- By Application
- By Cell Technology
- By Paste Type
- By Silver Content
- Key Takeaways
- South Asia and Pacific Market Analysis and Forecast, By Country, 2021 to 2036
- Historical Market Size Value (USD Million) Trend Analysis By Market Taxonomy, 2021 to 2025
- Market Size Value (USD Million) Forecast By Market Taxonomy, 2026 to 2036
- By Country
- India
- ASEAN
- Australia and New Zealand
- By Application
- By Cell Technology
- By Paste Type
- By Silver Content
- By Country
- Market Attractiveness Analysis
- By Country
- By Application
- By Cell Technology
- By Paste Type
- By Silver Content
- Key Takeaways
- Middle East and Africa Market Analysis and Forecast, By Country, 2021 to 2036
- Historical Market Size Value (USD Million) Trend Analysis By Market Taxonomy, 2021 to 2025
- Market Size Value (USD Million) Forecast By Market Taxonomy, 2026 to 2036
- By Country
- GCC Countries
- South Africa
- Türkiye
- Israel
- By Application
- By Cell Technology
- By Paste Type
- By Silver Content
- By Country
- Market Attractiveness Analysis
- By Country
- By Application
- By Cell Technology
- By Paste Type
- By Silver Content
- Key Takeaways
- Key Countries Market Analysis
- United States
- Pricing Analysis
- Market Share Analysis, 2025
- By Application
- By Cell Technology
- By Paste Type
- By Silver Content
- Canada
- Pricing Analysis
- Market Share Analysis, 2025
- By Application
- By Cell Technology
- By Paste Type
- By Silver Content
- Brazil
- Pricing Analysis
- Market Share Analysis, 2025
- By Application
- By Cell Technology
- By Paste Type
- By Silver Content
- Mexico
- Pricing Analysis
- Market Share Analysis, 2025
- By Application
- By Cell Technology
- By Paste Type
- By Silver Content
- Argentina
- Pricing Analysis
- Market Share Analysis, 2025
- By Application
- By Cell Technology
- By Paste Type
- By Silver Content
- Chile
- Pricing Analysis
- Market Share Analysis, 2025
- By Application
- By Cell Technology
- By Paste Type
- By Silver Content
- Germany
- Pricing Analysis
- Market Share Analysis, 2025
- By Application
- By Cell Technology
- By Paste Type
- By Silver Content
- France
- Pricing Analysis
- Market Share Analysis, 2025
- By Application
- By Cell Technology
- By Paste Type
- By Silver Content
- United Kingdom
- Pricing Analysis
- Market Share Analysis, 2025
- By Application
- By Cell Technology
- By Paste Type
- By Silver Content
- Italy
- Pricing Analysis
- Market Share Analysis, 2025
- By Application
- By Cell Technology
- By Paste Type
- By Silver Content
- Spain
- Pricing Analysis
- Market Share Analysis, 2025
- By Application
- By Cell Technology
- By Paste Type
- By Silver Content
- Benelux
- Pricing Analysis
- Market Share Analysis, 2025
- By Application
- By Cell Technology
- By Paste Type
- By Silver Content
- Nordics
- Pricing Analysis
- Market Share Analysis, 2025
- By Application
- By Cell Technology
- By Paste Type
- By Silver Content
- Poland
- Pricing Analysis
- Market Share Analysis, 2025
- By Application
- By Cell Technology
- By Paste Type
- By Silver Content
- Czech Republic
- Pricing Analysis
- Market Share Analysis, 2025
- By Application
- By Cell Technology
- By Paste Type
- By Silver Content
- Romania
- Pricing Analysis
- Market Share Analysis, 2025
- By Application
- By Cell Technology
- By Paste Type
- By Silver Content
- Hungary
- Pricing Analysis
- Market Share Analysis, 2025
- By Application
- By Cell Technology
- By Paste Type
- By Silver Content
- China
- Pricing Analysis
- Market Share Analysis, 2025
- By Application
- By Cell Technology
- By Paste Type
- By Silver Content
- Japan
- Pricing Analysis
- Market Share Analysis, 2025
- By Application
- By Cell Technology
- By Paste Type
- By Silver Content
- South Korea
- Pricing Analysis
- Market Share Analysis, 2025
- By Application
- By Cell Technology
- By Paste Type
- By Silver Content
- India
- Pricing Analysis
- Market Share Analysis, 2025
- By Application
- By Cell Technology
- By Paste Type
- By Silver Content
- ASEAN
- Pricing Analysis
- Market Share Analysis, 2025
- By Application
- By Cell Technology
- By Paste Type
- By Silver Content
- Australia and New Zealand
- Pricing Analysis
- Market Share Analysis, 2025
- By Application
- By Cell Technology
- By Paste Type
- By Silver Content
- GCC Countries
- Pricing Analysis
- Market Share Analysis, 2025
- By Application
- By Cell Technology
- By Paste Type
- By Silver Content
- South Africa
- Pricing Analysis
- Market Share Analysis, 2025
- By Application
- By Cell Technology
- By Paste Type
- By Silver Content
- Türkiye
- Pricing Analysis
- Market Share Analysis, 2025
- By Application
- By Cell Technology
- By Paste Type
- By Silver Content
- Israel
- Pricing Analysis
- Market Share Analysis, 2025
- By Application
- By Cell Technology
- By Paste Type
- By Silver Content
- United States
- Market Structure Analysis
- Competition Dashboard
- Competition Benchmarking
- Market Share Analysis of Top Players
- By Region
- By Application
- By Cell Technology
- By Paste Type
- By Silver Content
- Emerging Startups
- Innovation Benchmarking
- Competition Analysis
- Competition Deep Dive
- Heraeus
- Overview
- Product Portfolio
- Profitability by Market Segments
- Sales Footprint
- Strategy Overview
- Marketing Strategy
- Product Strategy
- Channel Strategy
- DK Electronic Materials
- Changzhou Fusion New Material
- Giga Solar Materials
- Daejoo Electronic Materials
- Noritake
- Namics
- Sun Chemical
- Heraeus
- Case Studies
- Success Stories
- Recent Developments
- Competition Deep Dive
- Assumptions & Acronyms Used
List of Tables
- Table 1: Global Market Value (USD Million) Forecast by Region, 2021 to 2036
- Table 2: Global Market Value (USD Million) Forecast by Application, 2021 to 2036
- Table 3: Global Market Value (USD Million) Forecast by Cell Technology, 2021 to 2036
- Table 4: Global Market Value (USD Million) Forecast by Paste Type, 2021 to 2036
- Table 5: Global Market Value (USD Million) Forecast by Silver Content, 2021 to 2036
- Table 6: North America Market Value (USD Million) Forecast by Country, 2021 to 2036
- Table 7: North America Market Value (USD Million) Forecast by Application, 2021 to 2036
- Table 8: North America Market Value (USD Million) Forecast by Cell Technology, 2021 to 2036
- Table 9: North America Market Value (USD Million) Forecast by Paste Type, 2021 to 2036
- Table 10: North America Market Value (USD Million) Forecast by Silver Content, 2021 to 2036
- Table 11: Latin America Market Value (USD Million) Forecast by Country, 2021 to 2036
- Table 12: Latin America Market Value (USD Million) Forecast by Application, 2021 to 2036
- Table 13: Latin America Market Value (USD Million) Forecast by Cell Technology, 2021 to 2036
- Table 14: Latin America Market Value (USD Million) Forecast by Paste Type, 2021 to 2036
- Table 15: Latin America Market Value (USD Million) Forecast by Silver Content, 2021 to 2036
- Table 16: Western Europe Market Value (USD Million) Forecast by Country, 2021 to 2036
- Table 17: Western Europe Market Value (USD Million) Forecast by Application, 2021 to 2036
- Table 18: Western Europe Market Value (USD Million) Forecast by Cell Technology, 2021 to 2036
- Table 19: Western Europe Market Value (USD Million) Forecast by Paste Type, 2021 to 2036
- Table 20: Western Europe Market Value (USD Million) Forecast by Silver Content, 2021 to 2036
- Table 21: Eastern Europe Market Value (USD Million) Forecast by Country, 2021 to 2036
- Table 22: Eastern Europe Market Value (USD Million) Forecast by Application, 2021 to 2036
- Table 23: Eastern Europe Market Value (USD Million) Forecast by Cell Technology, 2021 to 2036
- Table 24: Eastern Europe Market Value (USD Million) Forecast by Paste Type, 2021 to 2036
- Table 25: Eastern Europe Market Value (USD Million) Forecast by Silver Content, 2021 to 2036
- Table 26: East Asia Market Value (USD Million) Forecast by Country, 2021 to 2036
- Table 27: East Asia Market Value (USD Million) Forecast by Application, 2021 to 2036
- Table 28: East Asia Market Value (USD Million) Forecast by Cell Technology, 2021 to 2036
- Table 29: East Asia Market Value (USD Million) Forecast by Paste Type, 2021 to 2036
- Table 30: East Asia Market Value (USD Million) Forecast by Silver Content, 2021 to 2036
- Table 31: South Asia and Pacific Market Value (USD Million) Forecast by Country, 2021 to 2036
- Table 32: South Asia and Pacific Market Value (USD Million) Forecast by Application, 2021 to 2036
- Table 33: South Asia and Pacific Market Value (USD Million) Forecast by Cell Technology, 2021 to 2036
- Table 34: South Asia and Pacific Market Value (USD Million) Forecast by Paste Type, 2021 to 2036
- Table 35: South Asia and Pacific Market Value (USD Million) Forecast by Silver Content, 2021 to 2036
- Table 36: Middle East and Africa Market Value (USD Million) Forecast by Country, 2021 to 2036
- Table 37: Middle East and Africa Market Value (USD Million) Forecast by Application, 2021 to 2036
- Table 38: Middle East and Africa Market Value (USD Million) Forecast by Cell Technology, 2021 to 2036
- Table 39: Middle East and Africa Market Value (USD Million) Forecast by Paste Type, 2021 to 2036
- Table 40: Middle East and Africa Market Value (USD Million) Forecast by Silver Content, 2021 to 2036
List of Figures
- Figure 1: Global Market Pricing Analysis
- Figure 2: Global Market Value (USD Million) Forecast 2021-2036
- Figure 3: Global Market Value Share and BPS Analysis by Application, 2026 and 2036
- Figure 4: Global Market Y-o-Y Growth Comparison by Application, 2026-2036
- Figure 5: Global Market Attractiveness Analysis by Application
- Figure 6: Global Market Value Share and BPS Analysis by Cell Technology, 2026 and 2036
- Figure 7: Global Market Y-o-Y Growth Comparison by Cell Technology, 2026-2036
- Figure 8: Global Market Attractiveness Analysis by Cell Technology
- Figure 9: Global Market Value Share and BPS Analysis by Paste Type, 2026 and 2036
- Figure 10: Global Market Y-o-Y Growth Comparison by Paste Type, 2026-2036
- Figure 11: Global Market Attractiveness Analysis by Paste Type
- Figure 12: Global Market Value Share and BPS Analysis by Silver Content, 2026 and 2036
- Figure 13: Global Market Y-o-Y Growth Comparison by Silver Content, 2026-2036
- Figure 14: Global Market Attractiveness Analysis by Silver Content
- Figure 15: Global Market Value (USD Million) Share and BPS Analysis by Region, 2026 and 2036
- Figure 16: Global Market Y-o-Y Growth Comparison by Region, 2026-2036
- Figure 17: Global Market Attractiveness Analysis by Region
- Figure 18: North America Market Incremental Dollar Opportunity, 2026-2036
- Figure 19: Latin America Market Incremental Dollar Opportunity, 2026-2036
- Figure 20: Western Europe Market Incremental Dollar Opportunity, 2026-2036
- Figure 21: Eastern Europe Market Incremental Dollar Opportunity, 2026-2036
- Figure 22: East Asia Market Incremental Dollar Opportunity, 2026-2036
- Figure 23: South Asia and Pacific Market Incremental Dollar Opportunity, 2026-2036
- Figure 24: Middle East and Africa Market Incremental Dollar Opportunity, 2026-2036
- Figure 25: North America Market Value Share and BPS Analysis by Country, 2026 and 2036
- Figure 26: North America Market Value Share and BPS Analysis by Application, 2026 and 2036
- Figure 27: North America Market Y-o-Y Growth Comparison by Application, 2026-2036
- Figure 28: North America Market Attractiveness Analysis by Application
- Figure 29: North America Market Value Share and BPS Analysis by Cell Technology, 2026 and 2036
- Figure 30: North America Market Y-o-Y Growth Comparison by Cell Technology, 2026-2036
- Figure 31: North America Market Attractiveness Analysis by Cell Technology
- Figure 32: North America Market Value Share and BPS Analysis by Paste Type, 2026 and 2036
- Figure 33: North America Market Y-o-Y Growth Comparison by Paste Type, 2026-2036
- Figure 34: North America Market Attractiveness Analysis by Paste Type
- Figure 35: North America Market Value Share and BPS Analysis by Silver Content, 2026 and 2036
- Figure 36: North America Market Y-o-Y Growth Comparison by Silver Content, 2026-2036
- Figure 37: North America Market Attractiveness Analysis by Silver Content
- Figure 38: Latin America Market Value Share and BPS Analysis by Country, 2026 and 2036
- Figure 39: Latin America Market Value Share and BPS Analysis by Application, 2026 and 2036
- Figure 40: Latin America Market Y-o-Y Growth Comparison by Application, 2026-2036
- Figure 41: Latin America Market Attractiveness Analysis by Application
- Figure 42: Latin America Market Value Share and BPS Analysis by Cell Technology, 2026 and 2036
- Figure 43: Latin America Market Y-o-Y Growth Comparison by Cell Technology, 2026-2036
- Figure 44: Latin America Market Attractiveness Analysis by Cell Technology
- Figure 45: Latin America Market Value Share and BPS Analysis by Paste Type, 2026 and 2036
- Figure 46: Latin America Market Y-o-Y Growth Comparison by Paste Type, 2026-2036
- Figure 47: Latin America Market Attractiveness Analysis by Paste Type
- Figure 48: Latin America Market Value Share and BPS Analysis by Silver Content, 2026 and 2036
- Figure 49: Latin America Market Y-o-Y Growth Comparison by Silver Content, 2026-2036
- Figure 50: Latin America Market Attractiveness Analysis by Silver Content
- Figure 51: Western Europe Market Value Share and BPS Analysis by Country, 2026 and 2036
- Figure 52: Western Europe Market Value Share and BPS Analysis by Application, 2026 and 2036
- Figure 53: Western Europe Market Y-o-Y Growth Comparison by Application, 2026-2036
- Figure 54: Western Europe Market Attractiveness Analysis by Application
- Figure 55: Western Europe Market Value Share and BPS Analysis by Cell Technology, 2026 and 2036
- Figure 56: Western Europe Market Y-o-Y Growth Comparison by Cell Technology, 2026-2036
- Figure 57: Western Europe Market Attractiveness Analysis by Cell Technology
- Figure 58: Western Europe Market Value Share and BPS Analysis by Paste Type, 2026 and 2036
- Figure 59: Western Europe Market Y-o-Y Growth Comparison by Paste Type, 2026-2036
- Figure 60: Western Europe Market Attractiveness Analysis by Paste Type
- Figure 61: Western Europe Market Value Share and BPS Analysis by Silver Content, 2026 and 2036
- Figure 62: Western Europe Market Y-o-Y Growth Comparison by Silver Content, 2026-2036
- Figure 63: Western Europe Market Attractiveness Analysis by Silver Content
- Figure 64: Eastern Europe Market Value Share and BPS Analysis by Country, 2026 and 2036
- Figure 65: Eastern Europe Market Value Share and BPS Analysis by Application, 2026 and 2036
- Figure 66: Eastern Europe Market Y-o-Y Growth Comparison by Application, 2026-2036
- Figure 67: Eastern Europe Market Attractiveness Analysis by Application
- Figure 68: Eastern Europe Market Value Share and BPS Analysis by Cell Technology, 2026 and 2036
- Figure 69: Eastern Europe Market Y-o-Y Growth Comparison by Cell Technology, 2026-2036
- Figure 70: Eastern Europe Market Attractiveness Analysis by Cell Technology
- Figure 71: Eastern Europe Market Value Share and BPS Analysis by Paste Type, 2026 and 2036
- Figure 72: Eastern Europe Market Y-o-Y Growth Comparison by Paste Type, 2026-2036
- Figure 73: Eastern Europe Market Attractiveness Analysis by Paste Type
- Figure 74: Eastern Europe Market Value Share and BPS Analysis by Silver Content, 2026 and 2036
- Figure 75: Eastern Europe Market Y-o-Y Growth Comparison by Silver Content, 2026-2036
- Figure 76: Eastern Europe Market Attractiveness Analysis by Silver Content
- Figure 77: East Asia Market Value Share and BPS Analysis by Country, 2026 and 2036
- Figure 78: East Asia Market Value Share and BPS Analysis by Application, 2026 and 2036
- Figure 79: East Asia Market Y-o-Y Growth Comparison by Application, 2026-2036
- Figure 80: East Asia Market Attractiveness Analysis by Application
- Figure 81: East Asia Market Value Share and BPS Analysis by Cell Technology, 2026 and 2036
- Figure 82: East Asia Market Y-o-Y Growth Comparison by Cell Technology, 2026-2036
- Figure 83: East Asia Market Attractiveness Analysis by Cell Technology
- Figure 84: East Asia Market Value Share and BPS Analysis by Paste Type, 2026 and 2036
- Figure 85: East Asia Market Y-o-Y Growth Comparison by Paste Type, 2026-2036
- Figure 86: East Asia Market Attractiveness Analysis by Paste Type
- Figure 87: East Asia Market Value Share and BPS Analysis by Silver Content, 2026 and 2036
- Figure 88: East Asia Market Y-o-Y Growth Comparison by Silver Content, 2026-2036
- Figure 89: East Asia Market Attractiveness Analysis by Silver Content
- Figure 90: South Asia and Pacific Market Value Share and BPS Analysis by Country, 2026 and 2036
- Figure 91: South Asia and Pacific Market Value Share and BPS Analysis by Application, 2026 and 2036
- Figure 92: South Asia and Pacific Market Y-o-Y Growth Comparison by Application, 2026-2036
- Figure 93: South Asia and Pacific Market Attractiveness Analysis by Application
- Figure 94: South Asia and Pacific Market Value Share and BPS Analysis by Cell Technology, 2026 and 2036
- Figure 95: South Asia and Pacific Market Y-o-Y Growth Comparison by Cell Technology, 2026-2036
- Figure 96: South Asia and Pacific Market Attractiveness Analysis by Cell Technology
- Figure 97: South Asia and Pacific Market Value Share and BPS Analysis by Paste Type, 2026 and 2036
- Figure 98: South Asia and Pacific Market Y-o-Y Growth Comparison by Paste Type, 2026-2036
- Figure 99: South Asia and Pacific Market Attractiveness Analysis by Paste Type
- Figure 100: South Asia and Pacific Market Value Share and BPS Analysis by Silver Content, 2026 and 2036
- Figure 101: South Asia and Pacific Market Y-o-Y Growth Comparison by Silver Content, 2026-2036
- Figure 102: South Asia and Pacific Market Attractiveness Analysis by Silver Content
- Figure 103: Middle East and Africa Market Value Share and BPS Analysis by Country, 2026 and 2036
- Figure 104: Middle East and Africa Market Value Share and BPS Analysis by Application, 2026 and 2036
- Figure 105: Middle East and Africa Market Y-o-Y Growth Comparison by Application, 2026-2036
- Figure 106: Middle East and Africa Market Attractiveness Analysis by Application
- Figure 107: Middle East and Africa Market Value Share and BPS Analysis by Cell Technology, 2026 and 2036
- Figure 108: Middle East and Africa Market Y-o-Y Growth Comparison by Cell Technology, 2026-2036
- Figure 109: Middle East and Africa Market Attractiveness Analysis by Cell Technology
- Figure 110: Middle East and Africa Market Value Share and BPS Analysis by Paste Type, 2026 and 2036
- Figure 111: Middle East and Africa Market Y-o-Y Growth Comparison by Paste Type, 2026-2036
- Figure 112: Middle East and Africa Market Attractiveness Analysis by Paste Type
- Figure 113: Middle East and Africa Market Value Share and BPS Analysis by Silver Content, 2026 and 2036
- Figure 114: Middle East and Africa Market Y-o-Y Growth Comparison by Silver Content, 2026-2036
- Figure 115: Middle East and Africa Market Attractiveness Analysis by Silver Content
- Figure 116: Global Market - Tier Structure Analysis
- Figure 117: Global Market - Company Share Analysis
Frequently Asked Questions
How big is the Silver Paste Market in 2026?
Future Market Insights estimates the global silver paste market at USD 8.7 billion in 2026, projected to reach USD 10.6 billion by 2036.
How fast is the Silver Paste Market expected to grow through 2036?
FMI projects a 2.0% CAGR from 2026 to 2036, taking the global market from USD 8.7 billion in 2026 to USD 10.6 billion by 2036.
Which application segment leads the Silver Paste Market?
Solar cell front side leads the application segment with a 58.0% share in 2026, supported by its role in printed conductive grids that balance electron collection, shading reduction, and silver consumption.
Which cell technology leads the Silver Paste Market?
TOPCon leads the cell technology segment with a 52.0% share in 2026, driven by its qualified front and rear contacts and established adoption in industrial n-type solar cell manufacturing.
Which countries are expected to grow fastest in the Silver Paste Market?
The United States is projected to record the fastest growth at a 3.0% CAGR from 2026 to 2036, followed by Vietnam at 2.7% over the same period.
Which companies are profiled in the Silver Paste Market?
The key companies profiled in the silver paste market include Heraeus, DK Electronic Materials, Changzhou Fusion New Material, Giga Solar Materials, Daejoo Electronic Materials, Noritake, Namics, and Sun Chemical. Their market positions span solar cell metallization, package bonding, and printed electronics applications.
Preview the report firsthand - request a free sample
Get SampleGet the brochure for pricing and purchase details.
Get PDF
