Smart Demand Response Market Size and Share Forecast Outlook 2025 to 2035

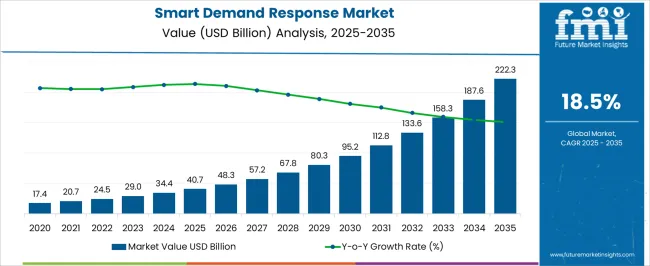
The smart demand response market is estimated to be valued at USD 40.7 billion in 2025 and is projected to reach USD 222.3 billion by 2035, registering a compound annual growth rate (CAGR) of 18.5% over the forecast period.

This growth represents an absolute dollar opportunity of USD 181.6 billion over the decade. Annual growth shows a sharp upward trend, starting from USD 40.7 billion in 2025, reaching USD 57.2 billion in 2028, USD 95.2 billion in 2031, and progressing to USD 187.6 billion by 2034. The rapid increase highlights significant revenue potential, providing companies with opportunities to expand solutions, scale operations, and capture a growing share of the energy management market.

The absolute dollar opportunity emphasizes the substantial value within the smart demand response market over the next ten years. Incremental growth from USD 40.7 billion in 2025 to USD 222.3 billion in 2035 underscores a cumulative increase of USD 181.6 billion. Key years such as USD 67.8 billion in 2029 and USD 133.6 billion in 2033 indicate periods of accelerated adoption. This trend enables stakeholders to strategically invest in capacity expansion, enhance service offerings, and optimize deployment, ensuring they capture a meaningful portion of the expanding market throughout the 2025–2035 period.
Quick Stats for Smart Demand Response Market

  • Smart Demand Response Market Value (2025): USD 40.7 billion
  • Smart Demand Response Market Forecast Value (2035): USD 222.3 billion
  • Smart Demand Response Market Forecast CAGR: 18.5%
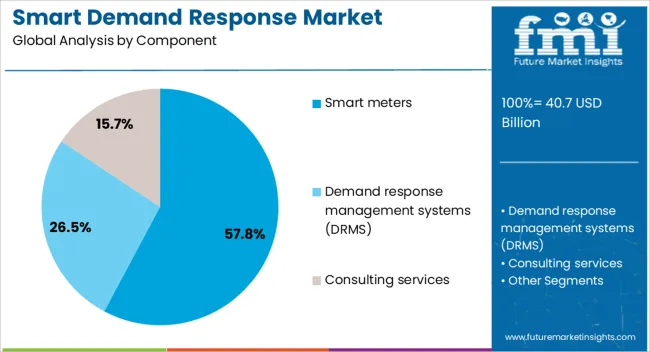
  • Leading Segment in Smart Demand Response Market in 2025: Smart meters (57.8%)
  • Key Growth Regions in Smart Demand Response Market: North America, Asia-Pacific, Europe
  • Key Players in Smart Demand Response Market: ABB, Eaton Corporation, Enel X S.r.l., General Electric, Honeywell International Inc., Johnson Controls, Oracle Energy and Water, Siemens AG, Schneider Electric, Itron Inc., IBM, Enbala Power Networks, CPower Energy Management, Cisco Systems

Smart Demand Response Market Market Value Analysis

Smart Demand Response Market Key Takeaways

Metric Value
Smart Demand Response Market Estimated Value in (2025 E) USD 40.7 billion
Smart Demand Response Market Forecast Value in (2035 F) USD 222.3 billion
Forecast CAGR (2025 to 2035) 18.5%

The smart demand response market is a segment of the broader global demand response and energy management market, which includes traditional demand response programs, advanced metering infrastructure, and automated load management solutions. In 2025, smart demand response accounts for approximately 18% of the total parent market, reflecting its growing importance in efficient energy utilization. With the overall market projected to grow from around USD 226 billion in 2025 to USD 1,250 billion in 2035, the smart demand response segment’s growth from USD 40.7 billion in 2025 to USD 222.3 billion in 2035 at a CAGR of 18.5% represents roughly 20% of the total incremental growth in the parent market.

Within the parent market, traditional demand response programs hold around 45% of total value, advanced metering infrastructure contributes about 25%, and other energy management solutions make up approximately 12%. The smart demand response segment, with its high CAGR of 18.5%, is among the fastest-growing portions of the market, emphasizing its increasing adoption in real-time load management. The absolute growth of USD 181.6 billion over the decade represents roughly 15% of the parent market’s total expansion. This growth trajectory provides manufacturers and service providers with opportunities to expand offerings, scale deployments, and capture a larger share of the global demand response and energy management market.

Why is the Smart Demand Response Market Growing?

The smart demand response market is experiencing accelerated growth, driven by the increasing need for efficient energy management and grid stability in the face of rising electricity demand. Adoption is being supported by government policies, utility incentives, and regulatory mandates aimed at optimizing energy consumption while reducing peak load stress on power grids. Advancements in digital communication infrastructure, integration of IoT-enabled devices, and deployment of AI-based energy management platforms are enabling more accurate real-time monitoring and automated demand adjustments.

Energy transition strategies emphasizing renewable integration and decarbonization are further enhancing the role of demand response systems, as they provide flexibility in balancing intermittent generation sources. Utilities and large-scale energy consumers are increasingly investing in solutions that improve operational efficiency while meeting environmental targets.

The convergence of advanced metering infrastructure with demand-side analytics is creating new opportunities for predictive load management As electrification expands across sectors such as transportation, manufacturing, and residential applications, the market is positioned for sustained expansion, with technology innovation and interoperability playing central roles in shaping future growth.

Segmental Analysis

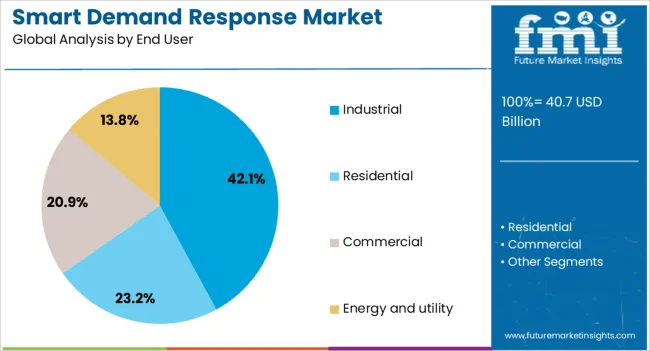
The smart demand response market is segmented by component, end user, and geographic regions. By component, smart demand response market is divided into smart meters, demand response management systems (DRMS), and consulting services. In terms of end user, smart demand response market is classified into industrial, residential, commercial, and energy and utility. Regionally, the smart demand response industry is classified into North America, Latin America, Western Europe, Eastern Europe, Balkan & Baltic Countries, Russia & Belarus, Central Asia, East Asia, South Asia & Pacific, and the Middle East & Africa.
Insights into the Smart Meters Component Segment

Smart Demand Response Market Analysis By Component

The smart meters segment is projected to account for 57.8% of the smart demand response market revenue share in 2025, making it the leading component category. This dominance is supported by the widespread deployment of advanced metering infrastructure that enables real-time energy consumption tracking, two-way communication between utilities and consumers, and automated response to grid signals.

The integration of smart meters with demand response programs allows utilities to implement dynamic pricing models, encouraging consumers to shift usage away from peak periods, thereby enhancing grid stability. Growing government initiatives and funding programs are accelerating large-scale smart meter rollouts, especially in regions prioritizing energy efficiency and decarbonization goals.

The ability to collect granular usage data facilitates predictive analytics, empowering utilities to forecast demand more accurately and optimize load distribution As the penetration of distributed energy resources and electric vehicles increases, the role of smart meters in enabling advanced demand-side management will strengthen, reinforcing their position as the most critical component in the smart demand response ecosystem.
Insights into the Industrial End User Segment

Smart Demand Response Market Analysis By End User

The industrial segment is expected to represent 42.1% of the smart demand response market revenue share in 2025, making it the leading end-user category. This leadership is being driven by the high energy consumption patterns of industrial facilities and the substantial cost savings potential offered through demand response participation. Industries with energy-intensive operations, such as manufacturing, mining, and chemical processing, benefit significantly from automated load management systems that reduce peak demand charges and improve overall energy efficiency.

Regulatory frameworks encouraging large consumers to participate in grid balancing programs are further supporting adoption. The integration of demand response technologies into industrial energy management systems allows real-time control over production schedules, machinery operations, and on-site generation assets, enabling businesses to respond quickly to grid signals without compromising operational performance.

Rising electricity costs, coupled with sustainability commitments, are incentivizing industrial users to adopt smart demand response strategies as part of broader energy transition initiatives This combination of economic and environmental benefits is expected to sustain the segment’s dominance in the coming years.

What are the Drivers, Restraints, and Key Trends of the Smart Demand Response Market?

The smart demand response market is growing due to increasing electricity consumption, grid instability challenges, and the integration of renewable energy sources. North America and Europe lead adoption with advanced grid management systems, smart meters, and automated demand response solutions. Asia-Pacific is witnessing rapid growth, fueled by urbanization, industrial expansion, and rising energy efficiency initiatives. Manufacturers differentiate through real-time analytics, automation, and interoperability with existing grid infrastructure. Regional variations in regulatory frameworks, technology readiness, and energy consumption patterns strongly influence adoption and market competitiveness globally.

Integration with Renewable Energy Sources Drives Adoption

The adoption of smart demand response systems is primarily driven by the need to manage variable renewable energy generation. North America and Europe prioritize integrating solar, wind, and distributed energy resources into the grid, using automated load control, predictive analytics, and real-time monitoring to balance supply and demand. Asia-Pacific markets adopt similar solutions to manage fluctuating energy generation in rapidly growing renewable installations. Differences in renewable penetration, grid flexibility, and load variability influence system design, automation level, and communication protocols. Leading suppliers provide scalable platforms with advanced forecasting and load-shifting capabilities, while regional providers offer cost-effective, modular solutions. Renewable integration contrasts shape adoption, operational efficiency, and market competitiveness across global smart demand response deployments.

Real-Time Data Analytics and Automation Enhance Efficiency

Real-time data analytics and automation are critical factors influencing smart demand response adoption. North America and Europe implement advanced analytics platforms and automated load control to optimize energy consumption, reduce peak demand, and minimize costs. Asia-Pacific markets are gradually adopting real-time monitoring and automated response systems in commercial and industrial sectors. Differences in IT infrastructure, data accuracy, and analytics sophistication affect decision-making speed, load management, and energy savings. Leading suppliers offer cloud-based analytics, AI-driven forecasting, and predictive demand response, while regional providers focus on simpler monitoring and alert systems. Analytics and automation contrasts drive adoption, operational optimization, and competitiveness across global smart demand response markets.

Regulatory Incentives and Policy Frameworks Influence Growth

Government policies, regulatory incentives, and energy efficiency mandates significantly impact smart demand response adoption. North America and Europe promote programs offering financial incentives, demand-side management credits, and integration support with utility grids. Asia-Pacific markets show varying regulatory maturity; developed regions adopt structured incentive programs, while emerging markets rely on voluntary or pilot initiatives. Differences in policy consistency, incentive structures, and compliance enforcement influence deployment timelines, market confidence, and investment decisions. Leading suppliers design systems aligned with incentive programs and regulatory standards, while regional providers adapt to local frameworks. Policy contrasts shape adoption, investment attractiveness, and competitive positioning globally.

Energy Efficiency and Peak Load Management Drive Demand

Energy efficiency and peak load management are major drivers for smart demand response system adoption. North America and Europe focus on reducing peak demand charges, lowering grid strain, and enhancing energy conservation through automated demand response in commercial and industrial sectors. Asia-Pacific markets adopt similar strategies to manage growing urban energy consumption, industrial loads, and seasonal peak demand. Differences in consumption patterns, peak load characteristics, and utility pricing influence system configuration, response timing, and adoption levels. Leading suppliers provide integrated platforms capable of automated load shedding, incentive tracking, and reporting, while regional providers deliver basic control systems with limited optimization. Efficiency and peak load contrasts shape adoption, operational savings, and market competitiveness globally.
Analysis of Smart Demand Response Market By Key Countries

Smart Demand Response Market Cagr Analysis By Country

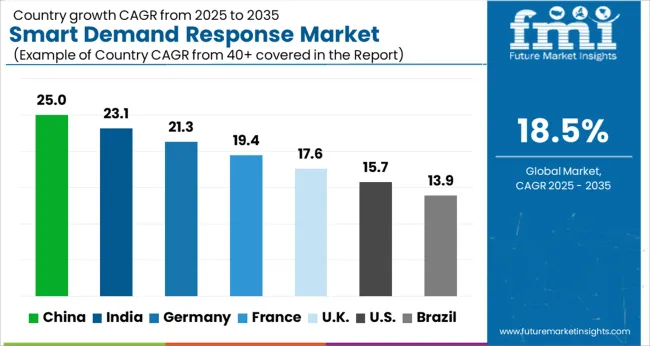
Country CAGR
China 25.0%
India 23.1%
Germany 21.3%
France 19.4%
UK 17.6%
USA 15.7%
Brazil 13.9%

The global smart demand response market is projected to grow at an 18.5% CAGR through 2035, driven by increasing adoption in energy management, grid optimization, and industrial applications. Among BRICS nations, China led with 25.0% growth as large-scale deployment and implementation across utility and commercial networks were executed, while India at 23.1% expanded integration and operational capacity to meet rising electricity demand management requirements. In the OECD region, Germany at 21.3% maintained steady adoption under strict regulatory frameworks and compliance standards, while the United Kingdom at 17.6% advanced deployment across commercial and industrial grids. The USA, growing at 15.7%, facilitated widespread implementation in utility and industrial sectors while adhering to federal and state-level energy regulations. This report includes insights on 40+ countries; the top countries are shown here for reference.

Smart Demand Response Market Development in China

The smart demand response market in China is projected to grow at a CAGR of 25.0%, driven by increasing electricity demand, grid modernization projects, and industrial energy efficiency programs. Adoption is being encouraged by systems that provide automated load management, real time monitoring, and optimized energy usage. Manufacturers are being urged to supply reliable, scalable, and technologically advanced solutions. Distribution through utility companies, industrial clients, and energy service providers is being strengthened. Research in predictive analytics, demand forecasting, and automation technologies is being conducted. Rising urban electricity consumption, government incentives for energy management, and smart grid initiatives are considered key factors driving the smart demand response market in China.

  • Grid modernization projects boosted adoption
  • Reliable and automated systems were supplied
  • R&D focused on predictive analytics and automation

Smart Demand Response Market Growth in India

In India, the smart demand response market is expected to grow at a CAGR of 23.1%, supported by adoption in industrial sectors, commercial buildings, and smart grid implementations. Emphasis is being placed on systems that offer real time load control, energy optimization, and operational efficiency. Local manufacturers are being encouraged to develop cost effective, scalable, and high performance solutions. Distribution through utility companies, industrial facilities, and energy service providers is being expanded. Awareness programs highlighting energy savings and operational benefits are being promoted. Increasing electricity demand, industrial expansion, and government initiatives for energy efficiency are recognized as primary drivers of the smart demand response market in India.
  • Industrial and commercial adoption increased demand
  • Scalable and high performance systems were supplied
  • Programs promoted energy savings and efficiency

Smart Demand Response Market Insights in Germany

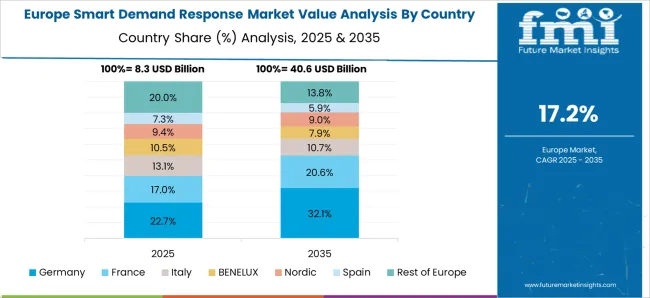
Smart Demand Response Market Europe Country Market Share Analysis, 2025 & 2035

Germany is witnessing steady growth in the smart demand response market at a CAGR of 21.3%, driven by adoption in industrial facilities, commercial sectors, and energy intensive operations. Adoption is being encouraged by systems that provide predictive load management, automated control, and real time monitoring. Manufacturers are being urged to supply technologically advanced, reliable, and efficient solutions. Distribution through industrial clients, utility companies, and energy service providers is being optimized. Research in energy forecasting, automation, and grid integration is being pursued. Renewable energy integration, electricity cost optimization, and industrial energy efficiency programs are considered key factors driving the smart demand response market in Germany.

  • Industrial and commercial operations supported adoption
  • Reliable and efficient systems were supplied
  • R&D focused on energy forecasting and grid integration

Smart Demand Response Market Overview in the United Kingdom

The smart demand response market in the United Kingdom is projected to grow at a CAGR of 17.6%, supported by adoption in commercial buildings, industrial facilities, and utility programs. Adoption is being emphasized for systems that ensure operational efficiency, load optimization, and automated energy management. Manufacturers are being encouraged to supply scalable, reliable, and advanced solutions. Distribution through utilities, commercial clients, and energy service providers is being strengthened. Demonstrations and pilot projects are being conducted to promote awareness of demand response technologies. Expansion of smart grid programs, commercial energy efficiency initiatives, and regulatory incentives are recognized as major contributors to the smart demand response market in the United Kingdom.
  • Commercial and industrial projects boosted adoption
  • Scalable and advanced systems were supplied
  • Pilot projects promoted awareness of demand response

Smart Demand Response Market Trends in the United States

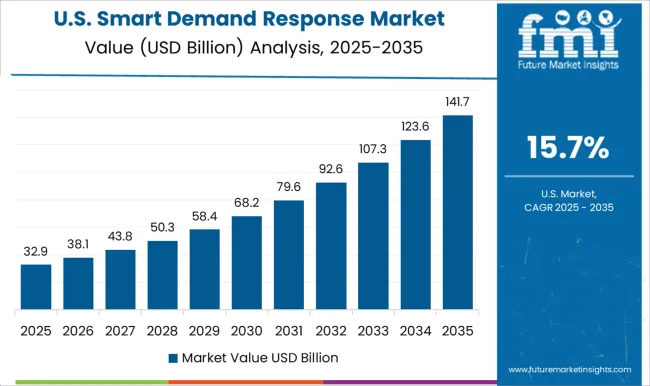
Smart Demand Response Market Country Value Analysis

The smart demand response market in the United States is projected to grow at a CAGR of 15.7%, driven by adoption in utility networks, industrial facilities, and commercial buildings. Adoption is being encouraged by systems that offer automated load control, energy optimization, and real time monitoring. Manufacturers are being urged to develop reliable, cost effective, and high performance solutions. Distribution through utilities, industrial clients, and energy service providers is being maintained. Research in predictive analytics, automation, and demand management technologies is being pursued. Increasing electricity demand, smart grid implementation, and energy cost reduction initiatives are considered key drivers of the smart demand response market in the United States.
  • Utility and industrial adoption increased growth
  • Reliable and high performance systems were developed
  • R&D focused on automation and demand management

Competitive Landscape of Smart Demand Response Market

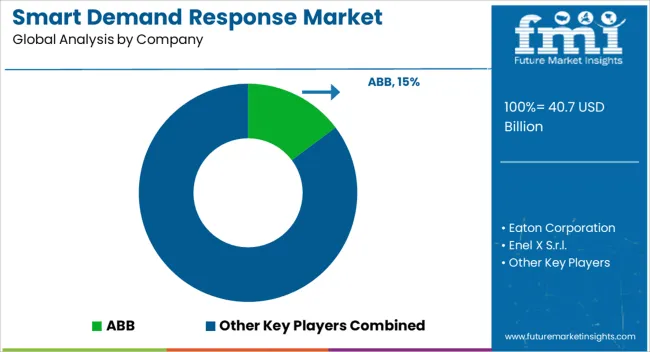
Smart Demand Response Market Analysis By Company

The smart demand response market is driven by leading technology providers that offer advanced solutions for optimizing electricity consumption, enhancing grid stability, and integrating renewable energy sources. Prominent suppliers in this market include ABB, Eaton Corporation, Enel X S.r.l., General Electric, Honeywell International Inc., Johnson Controls, Oracle Energy and Water, Siemens AG, Schneider Electric, Itron Inc., IBM, Enbala Power Networks, CPower Energy Management, and Cisco Systems. These companies provide comprehensive demand response platforms that combine real-time monitoring, automated load management, predictive analytics, and cloud-based software to improve energy efficiency and reduce operational costs for utilities and industrial users.

Companies like ABB, Siemens, Schneider Electric, and General Electric lead the market through sophisticated energy management systems that enable utilities to remotely control and optimize power consumption. Honeywell International Inc., Johnson Controls, and Eaton Corporation contribute by integrating smart building solutions, connected devices, and IoT-enabled automation into the demand response framework. Enel X S.r.l., Oracle Energy and Water, and Itron Inc. focus on advanced analytics, digital dashboards, and customer engagement platforms to empower energy providers and commercial consumers with actionable insights for peak load management and demand flexibility.

The adoption of smart demand response is further supported by technology providers such as IBM, Enbala Power Networks, CPower Energy Management, and Cisco Systems, which offer scalable, secure, and interoperable solutions that enhance grid resilience and support the transition to smart grids. By leveraging artificial intelligence, machine learning, and advanced communication protocols, these suppliers enable utilities to predict energy usage patterns, manage distributed energy resources, and optimize grid performance. The emphasis on sustainability, efficiency, and reliability ensures that these market leaders remain at the forefront of innovation, helping stakeholders achieve energy cost savings, regulatory compliance, and improved environmental outcomes in the evolving electricity landscape.

Key Players in the Smart Demand Response Market

  • ABB
  • Eaton Corporation
  • Enel X S.r.l.
  • General Electric
  • Honeywell International Inc.
  • Johnson Controls
  • Oracle Energy and Water
  • Siemens AG
  • Schneider Electric
  • Itron Inc.
  • IBM
  • Enbala Power Networks
  • CPower Energy Management
  • Cisco Systems

Scope of the Report

Item Value
Quantitative Units USD 40.7 Billion
Component Smart meters, Demand response management systems (DRMS), and Consulting services
End User Industrial, Residential, Commercial, and Energy and utility
Regions Covered North America, Europe, Asia-Pacific, Latin America, Middle East & Africa
Country Covered United States, Canada, Germany, France, United Kingdom, China, Japan, India, Brazil, South Africa
Key Companies Profiled ABB, Eaton Corporation, Enel X S.r.l., General Electric, Honeywell International Inc., Johnson Controls, Oracle Energy and Water, Siemens AG, Schneider Electric, Itron Inc., IBM, Enbala Power Networks, CPower Energy Management, and Cisco Systems
Additional Attributes Dollar sales vary by technology, including automated demand response, real-time pricing, and energy management systems; by application, such as residential, commercial, and industrial energy management; by end-use, spanning utilities, energy service providers, and large-scale energy consumers; by region, led by North America, Europe, and Asia-Pacific. Growth is driven by smart grid adoption, energy efficiency mandates, and demand-side management initiatives.

Smart Demand Response Market by Segments

Component:

  • Smart meters
  • Demand response management systems (DRMS)
  • Consulting services

End User:

  • Industrial
  • Residential
  • Commercial
  • Energy and utility

Region:

  • North America
    • USA
    • Canada
    • Mexico
  • Latin America
    • Brazil
    • Chile
    • Rest of Latin America
  • Western Europe
    • Germany
    • UK
    • Italy
    • Spain
    • France
    • Nordic
    • BENELUX
    • Rest of Western Europe
  • Eastern Europe
    • Russia
    • Poland
    • Hungary
    • Balkan & Baltic
    • Rest of Eastern Europe
  • East Asia
    • China
    • Japan
    • South Korea
  • South Asia and Pacific
    • India
    • ASEAN
    • Australia & New Zealand
    • Rest of South Asia and Pacific
  • Middle East & Africa
    • Kingdom of Saudi Arabia
    • Other GCC Countries
    • Turkiye
    • South Africa
    • Other African Union
    • Rest of Middle East & Africa

Table of Content

  1. Executive Summary
    • Global Market Outlook
    • Demand-side Trends
    • Supply-side Trends
    • Technology Roadmap Analysis
    • Analysis and Recommendations
  2. Market Overview
    • Market Coverage / Taxonomy
    • Market Definition / Scope / Limitations
  3. Market Background
    • Market Dynamics
      • Drivers
      • Restraints
      • Opportunity
      • Trends
    • Scenario Forecast
      • Demand in Optimistic Scenario
      • Demand in Likely Scenario
      • Demand in Conservative Scenario
    • Opportunity Map Analysis
    • Product Life Cycle Analysis
    • Supply Chain Analysis
    • Investment Feasibility Matrix
    • Value Chain Analysis
    • PESTLE and Porter’s Analysis
    • Regulatory Landscape
    • Regional Parent Market Outlook
    • Production and Consumption Statistics
    • Import and Export Statistics
  4. Global Smart Demand Response Market Analysis 2020-2024 and Forecast, 2025-2035
    • Historical Market Size Value (USD Mn) Analysis, 2020-2024
    • Current and Future Market Size Value (USD Mn) Projections, 2025-2035
      • Y-o-Y Growth Trend Analysis
      • Absolute $ Opportunity Analysis
  5. Global Smart Demand Response Market Pricing Analysis 2020-2024 and Forecast 2025-2035
  6. Global Smart Demand Response Market Analysis 2020-2024 and Forecast 2025-2035, By Component
    • Introduction / Key Findings
    • Historical Market Size Value (USD Mn) Analysis By Component , 2020-2024
    • Current and Future Market Size Value (USD Mn) Analysis and Forecast By Component , 2025-2035
      • Smart meters
        • Smart thermostats
        • Load control switches
        • Others
      • Demand response management systems (DRMS)
        • Energy management systems (EMS)
        • Building energy management systems (BEMS)
        • Others
      • Consulting services
        • Installation and integration services
        • Maintenance and support services
    • Y-o-Y Growth Trend Analysis By Component , 2020-2024
    • Absolute $ Opportunity Analysis By Component , 2025-2035
  7. Global Smart Demand Response Market Analysis 2020-2024 and Forecast 2025-2035, By End User
    • Introduction / Key Findings
    • Historical Market Size Value (USD Mn) Analysis By End User, 2020-2024
    • Current and Future Market Size Value (USD Mn) Analysis and Forecast By End User, 2025-2035
      • Industrial
      • Residential
      • Commercial
      • Energy and utility
    • Y-o-Y Growth Trend Analysis By End User, 2020-2024
    • Absolute $ Opportunity Analysis By End User, 2025-2035
  8. Global Smart Demand Response Market Analysis 2020-2024 and Forecast 2025-2035, By Region
    • Introduction
    • Historical Market Size Value (USD Mn) Analysis By Region, 2020-2024
    • Current Market Size Value (USD Mn) Analysis and Forecast By Region, 2025-2035
      • North America
      • Latin America
      • Western Europe
      • Eastern Europe
      • East Asia
      • South Asia and Pacific
      • Middle East & Africa
    • Market Attractiveness Analysis By Region
  9. North America Smart Demand Response Market Analysis 2020-2024 and Forecast 2025-2035, By Country
    • Historical Market Size Value (USD Mn) Trend Analysis By Market Taxonomy, 2020-2024
    • Market Size Value (USD Mn) Forecast By Market Taxonomy, 2025-2035
      • By Country
        • USA
        • Canada
        • Mexico
      • By Component
      • By End User
    • Market Attractiveness Analysis
      • By Country
      • By Component
      • By End User
    • Key Takeaways
  10. Latin America Smart Demand Response Market Analysis 2020-2024 and Forecast 2025-2035, By Country
    • Historical Market Size Value (USD Mn) Trend Analysis By Market Taxonomy, 2020-2024
    • Market Size Value (USD Mn) Forecast By Market Taxonomy, 2025-2035
      • By Country
        • Brazil
        • Chile
        • Rest of Latin America
      • By Component
      • By End User
    • Market Attractiveness Analysis
      • By Country
      • By Component
      • By End User
    • Key Takeaways
  11. Western Europe Smart Demand Response Market Analysis 2020-2024 and Forecast 2025-2035, By Country
    • Historical Market Size Value (USD Mn) Trend Analysis By Market Taxonomy, 2020-2024
    • Market Size Value (USD Mn) Forecast By Market Taxonomy, 2025-2035
      • By Country
        • Germany
        • UK
        • Italy
        • Spain
        • France
        • Nordic
        • BENELUX
        • Rest of Western Europe
      • By Component
      • By End User
    • Market Attractiveness Analysis
      • By Country
      • By Component
      • By End User
    • Key Takeaways
  12. Eastern Europe Smart Demand Response Market Analysis 2020-2024 and Forecast 2025-2035, By Country
    • Historical Market Size Value (USD Mn) Trend Analysis By Market Taxonomy, 2020-2024
    • Market Size Value (USD Mn) Forecast By Market Taxonomy, 2025-2035
      • By Country
        • Russia
        • Poland
        • Hungary
        • Balkan & Baltic
        • Rest of Eastern Europe
      • By Component
      • By End User
    • Market Attractiveness Analysis
      • By Country
      • By Component
      • By End User
    • Key Takeaways
  13. East Asia Smart Demand Response Market Analysis 2020-2024 and Forecast 2025-2035, By Country
    • Historical Market Size Value (USD Mn) Trend Analysis By Market Taxonomy, 2020-2024
    • Market Size Value (USD Mn) Forecast By Market Taxonomy, 2025-2035
      • By Country
        • China
        • Japan
        • South Korea
      • By Component
      • By End User
    • Market Attractiveness Analysis
      • By Country
      • By Component
      • By End User
    • Key Takeaways
  14. South Asia and Pacific Smart Demand Response Market Analysis 2020-2024 and Forecast 2025-2035, By Country
    • Historical Market Size Value (USD Mn) Trend Analysis By Market Taxonomy, 2020-2024
    • Market Size Value (USD Mn) Forecast By Market Taxonomy, 2025-2035
      • By Country
        • India
        • ASEAN
        • Australia & New Zealand
        • Rest of South Asia and Pacific
      • By Component
      • By End User
    • Market Attractiveness Analysis
      • By Country
      • By Component
      • By End User
    • Key Takeaways
  15. Middle East & Africa Smart Demand Response Market Analysis 2020-2024 and Forecast 2025-2035, By Country
    • Historical Market Size Value (USD Mn) Trend Analysis By Market Taxonomy, 2020-2024
    • Market Size Value (USD Mn) Forecast By Market Taxonomy, 2025-2035
      • By Country
        • Kingdom of Saudi Arabia
        • Other GCC Countries
        • Turkiye
        • South Africa
        • Other African Union
        • Rest of Middle East & Africa
      • By Component
      • By End User
    • Market Attractiveness Analysis
      • By Country
      • By Component
      • By End User
    • Key Takeaways
  16. Key Countries Smart Demand Response Market Analysis
    • USA
      • Pricing Analysis
      • Market Share Analysis, 2024
        • By Component
        • By End User
    • Canada
      • Pricing Analysis
      • Market Share Analysis, 2024
        • By Component
        • By End User
    • Mexico
      • Pricing Analysis
      • Market Share Analysis, 2024
        • By Component
        • By End User
    • Brazil
      • Pricing Analysis
      • Market Share Analysis, 2024
        • By Component
        • By End User
    • Chile
      • Pricing Analysis
      • Market Share Analysis, 2024
        • By Component
        • By End User
    • Germany
      • Pricing Analysis
      • Market Share Analysis, 2024
        • By Component
        • By End User
    • UK
      • Pricing Analysis
      • Market Share Analysis, 2024
        • By Component
        • By End User
    • Italy
      • Pricing Analysis
      • Market Share Analysis, 2024
        • By Component
        • By End User
    • Spain
      • Pricing Analysis
      • Market Share Analysis, 2024
        • By Component
        • By End User
    • France
      • Pricing Analysis
      • Market Share Analysis, 2024
        • By Component
        • By End User
    • India
      • Pricing Analysis
      • Market Share Analysis, 2024
        • By Component
        • By End User
    • ASEAN
      • Pricing Analysis
      • Market Share Analysis, 2024
        • By Component
        • By End User
    • Australia & New Zealand
      • Pricing Analysis
      • Market Share Analysis, 2024
        • By Component
        • By End User
    • China
      • Pricing Analysis
      • Market Share Analysis, 2024
        • By Component
        • By End User
    • Japan
      • Pricing Analysis
      • Market Share Analysis, 2024
        • By Component
        • By End User
    • South Korea
      • Pricing Analysis
      • Market Share Analysis, 2024
        • By Component
        • By End User
    • Russia
      • Pricing Analysis
      • Market Share Analysis, 2024
        • By Component
        • By End User
    • Poland
      • Pricing Analysis
      • Market Share Analysis, 2024
        • By Component
        • By End User
    • Hungary
      • Pricing Analysis
      • Market Share Analysis, 2024
        • By Component
        • By End User
    • Kingdom of Saudi Arabia
      • Pricing Analysis
      • Market Share Analysis, 2024
        • By Component
        • By End User
    • Turkiye
      • Pricing Analysis
      • Market Share Analysis, 2024
        • By Component
        • By End User
    • South Africa
      • Pricing Analysis
      • Market Share Analysis, 2024
        • By Component
        • By End User
  17. Market Structure Analysis
    • Competition Dashboard
    • Competition Benchmarking
    • Market Share Analysis of Top Players
      • By Regional
      • By Component
      • By End User
  18. Competition Analysis
    • Competition Deep Dive
      • ABB
        • Overview
        • Product Portfolio
        • Profitability by Market Segments (Product/Age /Sales Channel/Region)
        • Sales Footprint
        • Strategy Overview
          • Marketing Strategy
          • Product Strategy
          • Channel Strategy
      • Eaton Corporation
      • Enel X S.r.l.
      • General Electric
      • Honeywell International Inc.
      • Johnson Controls
      • Oracle Energy and Water
      • Siemens AG
      • Schneider Electric
      • Itron Inc.
      • IBM
      • Enbala Power Networks
      • CPower Energy Management
      • Cisco Systems
  19. Assumptions & Acronyms Used
  20. Research Methodology

List of Tables

  • Table 1: Global Smart Demand Response Market Value (USD Mn) Forecast by Region, 2020-2035
  • Table 2: Global Smart Demand Response Market Value (USD Mn) Forecast by Component , 2020-2035
  • Table 3: Global Smart Demand Response Market Value (USD Mn) Forecast by End User, 2020-2035
  • Table 4: North America Smart Demand Response Market Value (USD Mn) Forecast by Country, 2020-2035
  • Table 5: North America Smart Demand Response Market Value (USD Mn) Forecast by Component , 2020-2035
  • Table 6: North America Smart Demand Response Market Value (USD Mn) Forecast by End User, 2020-2035
  • Table 7: Latin America Smart Demand Response Market Value (USD Mn) Forecast by Country, 2020-2035
  • Table 8: Latin America Smart Demand Response Market Value (USD Mn) Forecast by Component , 2020-2035
  • Table 9: Latin America Smart Demand Response Market Value (USD Mn) Forecast by End User, 2020-2035
  • Table 10: Western Europe Smart Demand Response Market Value (USD Mn) Forecast by Country, 2020-2035
  • Table 11: Western Europe Smart Demand Response Market Value (USD Mn) Forecast by Component , 2020-2035
  • Table 12: Western Europe Smart Demand Response Market Value (USD Mn) Forecast by End User, 2020-2035
  • Table 13: Eastern Europe Smart Demand Response Market Value (USD Mn) Forecast by Country, 2020-2035
  • Table 14: Eastern Europe Smart Demand Response Market Value (USD Mn) Forecast by Component , 2020-2035
  • Table 15: Eastern Europe Smart Demand Response Market Value (USD Mn) Forecast by End User, 2020-2035
  • Table 16: East Asia Smart Demand Response Market Value (USD Mn) Forecast by Country, 2020-2035
  • Table 17: East Asia Smart Demand Response Market Value (USD Mn) Forecast by Component , 2020-2035
  • Table 18: East Asia Smart Demand Response Market Value (USD Mn) Forecast by End User, 2020-2035
  • Table 19: South Asia and Pacific Smart Demand Response Market Value (USD Mn) Forecast by Country, 2020-2035
  • Table 20: South Asia and Pacific Smart Demand Response Market Value (USD Mn) Forecast by Component , 2020-2035
  • Table 21: South Asia and Pacific Smart Demand Response Market Value (USD Mn) Forecast by End User, 2020-2035
  • Table 22: Middle East & Africa Smart Demand Response Market Value (USD Mn) Forecast by Country, 2020-2035
  • Table 23: Middle East & Africa Smart Demand Response Market Value (USD Mn) Forecast by Component , 2020-2035
  • Table 24: Middle East & Africa Smart Demand Response Market Value (USD Mn) Forecast by End User, 2020-2035

List of Figures

  • Figure 1: Global Smart Demand Response Market Pricing Analysis
  • Figure 2: Global Smart Demand Response Market Value (USD Mn) Forecast 2020–2035
  • Figure 3: Global Smart Demand Response Market Value Share and BPS Analysis by Component , 2025 and 2035
  • Figure 4: Global Smart Demand Response Market Y-o-Y Growth Comparison by Component , 2025–2035
  • Figure 5: Global Smart Demand Response Market Attractiveness Analysis by Component
  • Figure 6: Global Smart Demand Response Market Value Share and BPS Analysis by End User, 2025 and 2035
  • Figure 7: Global Smart Demand Response Market Y-o-Y Growth Comparison by End User, 2025–2035
  • Figure 8: Global Smart Demand Response Market Attractiveness Analysis by End User
  • Figure 9: Global Smart Demand Response Market Value (USD Mn) Share and BPS Analysis by Region, 2025 and 2035
  • Figure 10: Global Smart Demand Response Market Y-o-Y Growth Comparison by Region, 2025–2035
  • Figure 11: Global Smart Demand Response Market Attractiveness Analysis by Region
  • Figure 12: North America Smart Demand Response Market Incremental Dollar Opportunity, 2025–2035
  • Figure 13: Latin America Smart Demand Response Market Incremental Dollar Opportunity, 2025–2035
  • Figure 14: Western Europe Smart Demand Response Market Incremental Dollar Opportunity, 2025–2035
  • Figure 15: Eastern Europe Smart Demand Response Market Incremental Dollar Opportunity, 2025–2035
  • Figure 16: East Asia Smart Demand Response Market Incremental Dollar Opportunity, 2025–2035
  • Figure 17: South Asia and Pacific Smart Demand Response Market Incremental Dollar Opportunity, 2025–2035
  • Figure 18: Middle East & Africa Smart Demand Response Market Incremental Dollar Opportunity, 2025–2035
  • Figure 19: North America Smart Demand Response Market Value Share and BPS Analysis by Country, 2025 and 2035
  • Figure 20: North America Smart Demand Response Market Value Share and BPS Analysis by Component , 2025 and 2035
  • Figure 21: North America Smart Demand Response Market Y-o-Y Growth Comparison by Component , 2025–2035
  • Figure 22: North America Smart Demand Response Market Attractiveness Analysis by Component
  • Figure 23: North America Smart Demand Response Market Value Share and BPS Analysis by End User, 2025 and 2035
  • Figure 24: North America Smart Demand Response Market Y-o-Y Growth Comparison by End User, 2025–2035
  • Figure 25: North America Smart Demand Response Market Attractiveness Analysis by End User
  • Figure 26: Latin America Smart Demand Response Market Value Share and BPS Analysis by Country, 2025 and 2035
  • Figure 27: Latin America Smart Demand Response Market Value Share and BPS Analysis by Component , 2025 and 2035
  • Figure 28: Latin America Smart Demand Response Market Y-o-Y Growth Comparison by Component , 2025–2035
  • Figure 29: Latin America Smart Demand Response Market Attractiveness Analysis by Component
  • Figure 30: Latin America Smart Demand Response Market Value Share and BPS Analysis by End User, 2025 and 2035
  • Figure 31: Latin America Smart Demand Response Market Y-o-Y Growth Comparison by End User, 2025–2035
  • Figure 32: Latin America Smart Demand Response Market Attractiveness Analysis by End User
  • Figure 33: Western Europe Smart Demand Response Market Value Share and BPS Analysis by Country, 2025 and 2035
  • Figure 34: Western Europe Smart Demand Response Market Value Share and BPS Analysis by Component , 2025 and 2035
  • Figure 35: Western Europe Smart Demand Response Market Y-o-Y Growth Comparison by Component , 2025–2035
  • Figure 36: Western Europe Smart Demand Response Market Attractiveness Analysis by Component
  • Figure 37: Western Europe Smart Demand Response Market Value Share and BPS Analysis by End User, 2025 and 2035
  • Figure 38: Western Europe Smart Demand Response Market Y-o-Y Growth Comparison by End User, 2025–2035
  • Figure 39: Western Europe Smart Demand Response Market Attractiveness Analysis by End User
  • Figure 40: Eastern Europe Smart Demand Response Market Value Share and BPS Analysis by Country, 2025 and 2035
  • Figure 41: Eastern Europe Smart Demand Response Market Value Share and BPS Analysis by Component , 2025 and 2035
  • Figure 42: Eastern Europe Smart Demand Response Market Y-o-Y Growth Comparison by Component , 2025–2035
  • Figure 43: Eastern Europe Smart Demand Response Market Attractiveness Analysis by Component
  • Figure 44: Eastern Europe Smart Demand Response Market Value Share and BPS Analysis by End User, 2025 and 2035
  • Figure 45: Eastern Europe Smart Demand Response Market Y-o-Y Growth Comparison by End User, 2025–2035
  • Figure 46: Eastern Europe Smart Demand Response Market Attractiveness Analysis by End User
  • Figure 47: East Asia Smart Demand Response Market Value Share and BPS Analysis by Country, 2025 and 2035
  • Figure 48: East Asia Smart Demand Response Market Value Share and BPS Analysis by Component , 2025 and 2035
  • Figure 49: East Asia Smart Demand Response Market Y-o-Y Growth Comparison by Component , 2025–2035
  • Figure 50: East Asia Smart Demand Response Market Attractiveness Analysis by Component
  • Figure 51: East Asia Smart Demand Response Market Value Share and BPS Analysis by End User, 2025 and 2035
  • Figure 52: East Asia Smart Demand Response Market Y-o-Y Growth Comparison by End User, 2025–2035
  • Figure 53: East Asia Smart Demand Response Market Attractiveness Analysis by End User
  • Figure 54: South Asia and Pacific Smart Demand Response Market Value Share and BPS Analysis by Country, 2025 and 2035
  • Figure 55: South Asia and Pacific Smart Demand Response Market Value Share and BPS Analysis by Component , 2025 and 2035
  • Figure 56: South Asia and Pacific Smart Demand Response Market Y-o-Y Growth Comparison by Component , 2025–2035
  • Figure 57: South Asia and Pacific Smart Demand Response Market Attractiveness Analysis by Component
  • Figure 58: South Asia and Pacific Smart Demand Response Market Value Share and BPS Analysis by End User, 2025 and 2035
  • Figure 59: South Asia and Pacific Smart Demand Response Market Y-o-Y Growth Comparison by End User, 2025–2035
  • Figure 60: South Asia and Pacific Smart Demand Response Market Attractiveness Analysis by End User
  • Figure 61: Middle East & Africa Smart Demand Response Market Value Share and BPS Analysis by Country, 2025 and 2035
  • Figure 62: Middle East & Africa Smart Demand Response Market Value Share and BPS Analysis by Component , 2025 and 2035
  • Figure 63: Middle East & Africa Smart Demand Response Market Y-o-Y Growth Comparison by Component , 2025–2035
  • Figure 64: Middle East & Africa Smart Demand Response Market Attractiveness Analysis by Component
  • Figure 65: Middle East & Africa Smart Demand Response Market Value Share and BPS Analysis by End User, 2025 and 2035
  • Figure 66: Middle East & Africa Smart Demand Response Market Y-o-Y Growth Comparison by End User, 2025–2035
  • Figure 67: Middle East & Africa Smart Demand Response Market Attractiveness Analysis by End User
  • Figure 68: Global Smart Demand Response Market – Tier Structure Analysis
  • Figure 69: Global Smart Demand Response Market – Company Share Analysis

Frequently Asked Questions

How big is the smart demand response market in 2025?

The global smart demand response market is estimated to be valued at USD 40.7 billion in 2025.

What will be the size of smart demand response market in 2035?

The market size for the smart demand response market is projected to reach USD 222.3 billion by 2035.

How much will be the smart demand response market growth between 2025 and 2035?

The smart demand response market is expected to grow at a 18.5% CAGR between 2025 and 2035.

What are the key product types in the smart demand response market?

The key product types in smart demand response market are smart meters, smart thermostats, and others.

Which end user segment to contribute significant share in the smart demand response market in 2025?

In terms of end user, industrial segment to command 42.1% share in the smart demand response market in 2025.

Explore Similar Insights

Future Market Insights

Smart Demand Response Market

Chat With

MaRIA

Hi There, I am MaRIA, Your Market Research Intelligence Assistant. How may I help you?