Smart Vision Sensors Market Size and Share Forecast Outlook 2025 to 2035

The global smart vision sensors market is projected to be valued at USD 2.80 billion in 2025 and is forecast to reach USD 4.57 billion by 2035. This represents an absolute increase of USD 1.77 billion, equivalent to 63.2% growth over the forecast period. The market is expected to expand at a compound annual growth rate (CAGR) of 5.0%, with the overall market size anticipated to grow by approximately 1.63X by the end of the decade.

The market is growing as industries increasingly adopt automation, robotics, and AI-driven quality control systems to improve operational efficiency. Unlike traditional sensors, smart vision sensors integrate image capture, processing, and analytics in a single unit, reducing complexity and cost. Rising demand for precision inspection in manufacturing, electronics, automotive, and food & beverage industries is driving adoption. In addition, the expansion of smart factories, coupled with Industry 4.0 initiatives, is pushing companies to deploy vision sensors for real-time monitoring, defect detection, and predictive maintenance. Advances in edge AI, miniaturization, and connectivity are further accelerating market growth globally.
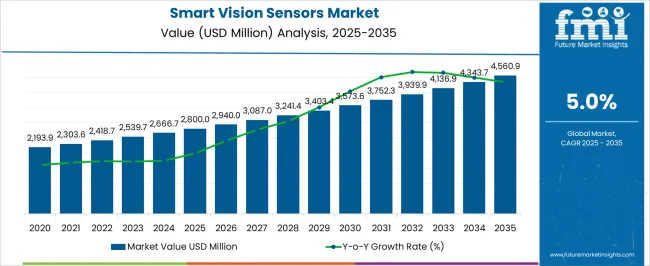
Quick Stats for Smart Vision Sensors Market

  • Smart Vision Sensors Market Value (2025): USD 2.80 billion
  • Smart Vision Sensors Market Forecast Value (2035): USD 4.57 billion
  • Smart Vision Sensors Market Forecast CAGR: 5.0%
  • Leading Segment in Smart Vision Sensors Market in 2025: Compact Fixed Form Factor (55% market share)
  • Key Growth Regions in Smart Vision Sensors Market: Asia Pacific, North America, and Europe
  • Key Players in Smart Vision Sensors Market: Cognex, KEYENCE, OMRON, Basler AG, Banner Engineering

Smart Vision Sensors Market Market Value Analysis

Smart Vision Sensors Market Key Takeaways

Metric Value
Industry Size (2025E) USD 2.80 billion
Industry Size (2035F) USD 4.57 billion
CAGR (2025 to 2035) 5.0%

Between 2025 and 2030, the smart vision sensors market is projected to expand from USD 2.80 billion to USD 3.55 billion, contributing an incremental revenue of USD 746.4 million during this period. This phase is expected to be driven by increasing adoption of automated inspection systems across manufacturing sectors and growing demand for quality control solutions in electronics and automotive applications. The integration of artificial intelligence capabilities into vision sensors is enhancing defect detection accuracy and enabling more sophisticated inspection tasks.

From 2030 to 2035, the market is expected to grow from USD 3.55 billion to USD 4.57 billion, adding another USD 1.02 billion in value. This growth phase will be characterized by the widespread deployment of Industry 4.0 technologies and smart factory implementations. Advanced connectivity options including Ethernet/IP and IO-Link interfaces will facilitate seamless integration with industrial automation systems, while compact form factors will continue to gain traction in space-constrained manufacturing environments.

Between 2020 and 2025, the smart vision sensors market expanded from USD 2.28 billion to USD 2.80 billion, recording a cumulative growth of 22.6% over the five-year period. This growth was supported by rapid automation adoption across manufacturing industries and the increasing need for quality assurance in production processes. The COVID-19 pandemic accelerated digital transformation initiatives, leading to greater emphasis on contactless inspection solutions and automated quality control systems.

Why the Smart Vision Sensors Market is Growing?

The smart vision sensors market is experiencing robust growth driven by the accelerating pace of industrial automation and the increasing need for precision quality control in manufacturing processes. Traditional manual inspection methods are being replaced by automated vision systems that offer consistent accuracy, faster processing speeds, and reduced labor costs. This shift is particularly pronounced in industries such as automotive, electronics, and food packaging where quality standards are stringent and production volumes are high.

The integration of artificial intelligence and machine learning capabilities into vision sensors is creating new opportunities for advanced defect detection and pattern recognition applications. These intelligent systems can identify complex defects and anomalies that would be difficult or impossible to detect through conventional inspection methods. The ability to learn and adapt to new inspection criteria makes AI-powered vision sensors particularly valuable in dynamic manufacturing environments.

Industry 4.0 initiatives are further driving demand for smart vision sensors as manufacturers seek to create connected and intelligent production systems. These sensors provide real-time data that can be integrated with manufacturing execution systems and enterprise resource planning platforms, enabling predictive maintenance, process optimization, and comprehensive quality management.

Segmental Analysis

The market is segmented by function, interface, form factor, end-use sector, and region. By function, the market is divided into presence/absence detection, code/OCR/ID reading, measurement/inspection, and AI/defect detection capabilities. Based on interface, the market is categorized into Ethernet/IP/Profinet, IO-Link, serial/discrete, and other connectivity options. In terms of form factor, the market is segmented into compact fixed, C-mount modular, and embedded/board-level configurations. By end-use sector, the market is classified into automotive, electronics, food and beverage/packaging, logistics, and other industrial applications. Regionally, the market is divided into North America, Europe, East Asia, South Asia & Pacific, Latin America, and Middle East & Africa.
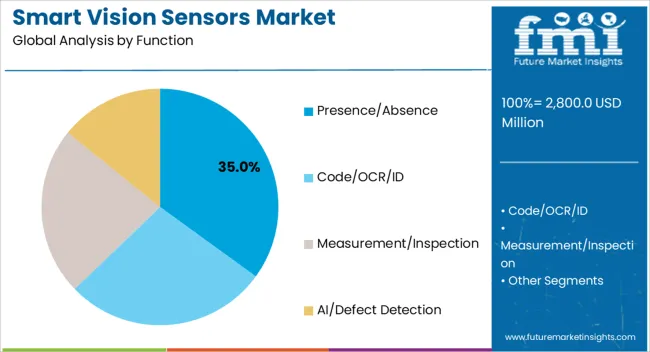
By Function, Presence/Absence Segment Accounts for 35% Market Share

Smart Vision Sensors Market Analysis By Function

Presence/absence detection functions are projected to account for 35% of the smart vision sensors market in 2025. This dominance reflects the fundamental requirement across manufacturing applications to verify component placement, assembly completion, and product positioning. These sensors provide reliable binary output for go/no-go decisions in high-speed production environments. The automotive industry extensively uses presence/absence detection for verifying component installation in assembly lines, while electronics manufacturers rely on these functions for printed circuit board inspection and component verification.
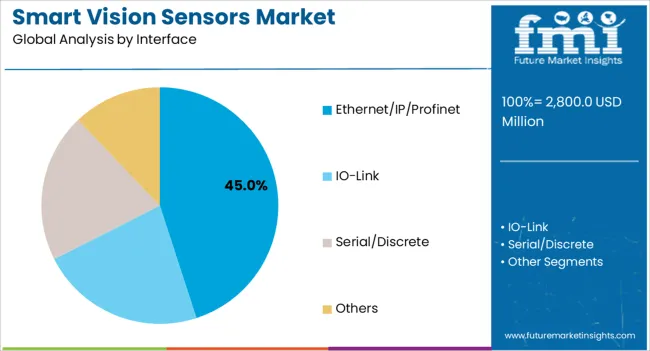
By Interface, Ethernet/IP/Profinet Segment Accounts for 45% Market Share

Smart Vision Sensors Market Analysis By Interface

Ethernet/IP and Profinet interfaces are projected to represent 45% of the smart vision sensors market in 2025, reflecting the preference for high-speed industrial networking protocols. These interfaces enable seamless integration with programmable logic controllers and distributed control systems, supporting real-time data exchange and remote configuration capabilities. The automotive and electronics industries favor these connectivity options for their reliability and data throughput capabilities in demanding manufacturing environments.
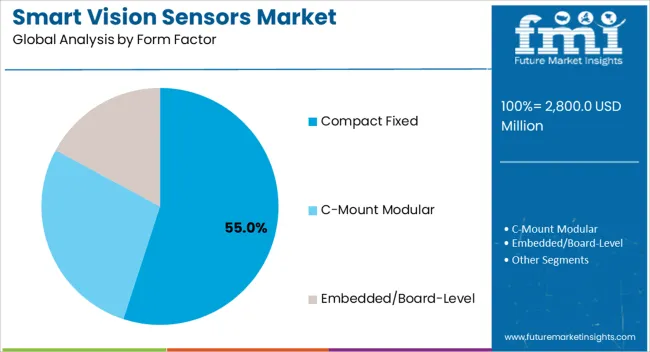
By Form Factor, Compact Fixed Segment Accounts for 55% Market Share

Smart Vision Sensors Market Analysis By Form Factor

Compact fixed form factors are anticipated to account for 55% of the smart vision sensors market in 2025, driven by space constraints in modern manufacturing equipment and the need for cost-effective inspection solutions. These integrated units combine optics, processing, and connectivity in a single housing, simplifying installation and reducing system complexity. The electronics manufacturing sector particularly favors compact fixed sensors for inline inspection applications where multiple sensors are deployed in confined spaces.
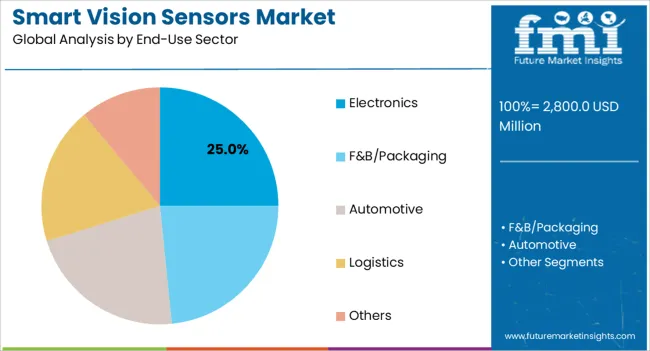
By End-Use Sector, Electronics Segment Accounts for 25% Market Share

Smart Vision Sensors Market Analysis By End Use Sector

The electronics sector is expected to represent 25% of the smart vision sensors market in 2025, driven by the increasing complexity of electronic components and the need for precision assembly verification. Printed circuit board inspection, semiconductor packaging, and mobile device manufacturing are key application areas. The sector's demand for miniaturized components and high-density assemblies creates requirements for high-resolution inspection capabilities that smart vision sensors can effectively address.

What are the Drivers, Restraints, and Key Trends of the Smart Vision Sensors Market?

The smart vision sensors market is being shaped by several key technological and industry trends that are driving adoption across multiple sectors. The integration of artificial intelligence and edge computing capabilities is enabling more sophisticated inspection tasks while reducing system complexity and response times. Manufacturers are developing sensors with enhanced processing power to handle complex algorithms locally rather than relying on external processing units.

Artificial Intelligence Integration Enhances Detection Capabilities

The incorporation of AI algorithms directly into vision sensors is revolutionizing defect detection and quality assessment capabilities. These intelligent systems can learn from inspection data to improve accuracy over time and adapt to new defect types without extensive reprogramming. Machine learning models enable subjective quality assessments that were previously possible only through human inspection, such as evaluating surface finish quality or identifying cosmetic defects in consumer products.

Connectivity Standardization Simplifies System Integration

The adoption of standardized communication protocols is simplifying the integration of smart vision sensors into existing automation systems. Ethernet-based protocols provide high-speed data transfer capabilities while enabling remote configuration and diagnostic functions. IO-Link standardization is reducing installation complexity and enabling plug-and-play functionality for distributed inspection applications.

Miniaturization Addresses Space Constraints

Ongoing miniaturization efforts are enabling the deployment of smart vision sensors in space-constrained applications where traditional vision systems would not fit. Compact form factors maintain inspection performance while reducing system footprint and installation requirements. This trend is particularly important in electronics manufacturing where production equipment must maximize throughput within limited floor space.

Analysis of Smart Vision Sensors Market by Key Countries

Smart Vision Sensors Market Cagr Analysis By Country

Country CAGR
China 6.2
India 5.8
France 4.8
USA 4.6
Germany 4.4

China Leads Global Market Growth with Robust Manufacturing Expansion

Demand for smart vision sensors in China represents the fastest-growing market for smart vision sensors with a projected CAGR of 6.2% through 2035. The country's massive manufacturing base and ongoing automation initiatives are driving strong demand for automated inspection solutions across multiple industries. Government policies supporting Industry 4.0 implementation and smart manufacturing are accelerating the adoption of advanced vision sensor technologies. The electronics and automotive manufacturing sectors are leading the deployment of smart vision sensors for quality control and process automation applications.

  • Manufacturing automation policies promoting vision sensor integration across industrial sectors
  • Electronics production facilities implementing comprehensive automated inspection systems

India Demonstrates Strong Growth Potential in Manufacturing Automation

Revenue from smart vision sensors in India is projected to grow at a CAGR of 5.8% through 2035, driven by the expanding manufacturing sector and government initiatives promoting industrial automation. The Make in India program and Production Linked Incentive schemes are encouraging manufacturers to adopt advanced inspection technologies to improve quality and competitiveness. Electronics manufacturing and automotive assembly operations are primary drivers of vision sensor adoption, with pharmaceutical and food processing industries also contributing to market growth.
  • Government incentive programs encouraging advanced manufacturing technology adoption
  • Pharmaceutical manufacturing facilities implementing stringent quality control systems

France Leads European Market with Advanced Manufacturing Focus

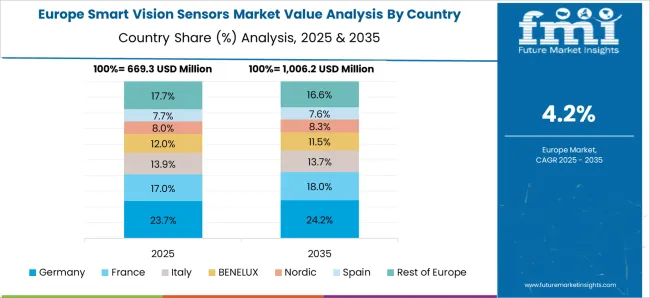
Smart Vision Sensors Market Europe Country Market Share Analysis, 2025 & 2035

Sales of smart vision sensors in France are expected to grow at a CAGR of 4.8% through 2035, supported by the country's advanced manufacturing capabilities and focus on high-value production. The automotive and aerospace industries are major consumers of smart vision sensors for critical component inspection and quality assurance. French manufacturers are adopting AI-enhanced vision systems to maintain competitive advantages in precision manufacturing applications, while the food and beverage sector is implementing advanced packaging inspection solutions.

  • Aerospace manufacturing requiring precision component inspection and quality verification
  • Food processing industry implementing comprehensive packaging quality control systems

United States Maintains Steady Growth with Technology Leadership

The United States smart vision sensors market is projected to expand at a CAGR of 4.6% through 2035, driven by ongoing manufacturing automation initiatives and the adoption of Industry 4.0 technologies. The automotive industry is a major consumer, implementing vision sensors for quality control in electric vehicle production and traditional automotive manufacturing. Electronics and semiconductor manufacturing sectors are deploying advanced vision systems for precision inspection of increasingly complex components and assemblies.

  • Electric vehicle manufacturing driving demand for advanced quality inspection systems
  • Semiconductor fabrication facilities implementing precision measurement and defect detection

Germany Sustains Market Growth Through Industrial Excellence

Demand for smart vision sensors in Germany is anticipated to grow at a CAGR of 4.4% through 2035, supported by the country's strong industrial base and leadership in manufacturing technology. The automotive industry remains a primary driver, with vision sensors deployed throughout production lines for component verification and quality control. German manufacturers are integrating AI-enhanced vision systems into their operations to maintain global competitiveness and meet stringent quality standards.

  • Automotive production lines implementing comprehensive automated inspection systems
  • Industrial machinery manufacturers integrating advanced vision capabilities

Competitive Landscape of Smart Vision Sensors Market

Smart Vision Sensors Market Analysis By Company

The smart vision sensors market features intense competition among established industrial automation companies and specialized vision technology providers. Market leaders are focusing on enhancing AI capabilities, expanding connectivity options, and developing more compact form factors to address evolving customer requirements. Innovation in edge computing and machine learning algorithms is enabling more sophisticated inspection capabilities while reducing system complexity.

Key market participants are investing in research and development to maintain technological leadership and expand their product portfolios. Strategic partnerships between sensor manufacturers and automation system integrators are facilitating market expansion and enabling comprehensive solution offerings. The competitive landscape is characterized by continuous technological advancement and the development of industry-specific solutions tailored to unique inspection requirements.

Key Players in the Smart Vision Sensors Market

  • Cognex
  • KEYENCE
  • OMRON
  • Basler AG
  • Banner Engineering
  • SICK AG
  • Datalogic
  • Teledyne DALSA
  • Pepperl+Fuchs
  • ifm electronic

Scope of the Report

Items Values
Quantitative Units (2025) USD 2.80 billion
Function Presence/Absence, Code/OCR/ID, Measurement/Inspection, AI/Defect Detection
Interface Ethernet/IP/Profinet, IO-Link, Serial/Discrete, Others
Form Factor Compact Fixed, C-Mount Modular, Embedded/Board-Level
End-Use Sector Automotive, Electronics, F&B/Packaging, Logistics, Others
Regions Covered North America, Europe, East Asia, South Asia & Pacific, Latin America, Middle East & Africa
Countries Covered United States, Canada, United Kingdom, Germany, France, China, Japan, South Korea, Brazil, Australia AND 40+ countries
Key Companies Profiled Cognex, KEYENCE, OMRON, Basler AG, Banner Engineering, SICK AG, Datalogic, Teledyne DALSA, Pepperl+Fuchs, ifm electronic
Additional Attributes Dollar sales by sensor type and resolution, regional adoption trends, OEM competition, buyer preference for AI-enabled automation, integration with Industry 4.0, innovations in edge processing, and sustainable manufacturing applications

Smart Vision Sensors Market by Segments

Function:

  • Presence/Absence
  • Code/OCR/ID
  • Measurement/Inspection
  • AI/Defect Detection

Interface:

  • Ethernet/IP/Profinet
  • IO-Link
  • Serial/Discrete
  • Others

Form Factor:

  • Compact Fixed
  • C-Mount Modular
  • Embedded/Board-Level

End-Use Sector:

  • Automotive
  • Electronics
  • F&B/Packaging
  • Logistics
  • Others

Region:

  • North America
    • United States
    • Canada
    • Mexico
  • Europe
    • Germany
    • United Kingdom
    • France
    • Italy
    • Spain
    • Nordic
    • BENELUX
    • Rest of Europe
  • East Asia
    • China
    • Japan
    • South Korea
  • South Asia & Pacific
    • India
    • ASEAN
    • Australia & New Zealand
    • Rest of South Asia & Pacific
  • Latin America
    • Brazil
    • Chile
    • Rest of Latin America
  • Middle East & Africa
    • Kingdom of Saudi Arabia
    • Other GCC Countries
    • Turkiye
    • South Africa
    • Other African Union
    • Rest of Middle East & Africa

Table of Content

  1. Executive Summary
    • Global Market Outlook
    • Demand-side Trends
    • Supply-side Trends
    • Technology Roadmap Analysis
    • Analysis and Recommendations
  2. Market Overview
    • Market Coverage / Taxonomy
    • Market Definition / Scope / Limitations
  3. Market Background
    • Market Dynamics
      • Drivers
      • Restraints
      • Opportunity
      • Trends
    • Scenario Forecast
      • Demand in Optimistic Scenario
      • Demand in Likely Scenario
      • Demand in Conservative Scenario
    • Opportunity Map Analysis
    • Product Life Cycle Analysis
    • Supply Chain Analysis
    • Investment Feasibility Matrix
    • Value Chain Analysis
    • PESTLE and Porter’s Analysis
    • Regulatory Landscape
    • Regional Parent Market Outlook
    • Production and Consumption Statistics
    • Import and Export Statistics
  4. Global Market Analysis 2020 to 2024 and Forecast, 2025 to 2035
    • Historical Market Size Value (USD Million) Analysis, 2020 to 2024
    • Current and Future Market Size Value (USD Million) Projections, 2025 to 2035
      • Y-o-Y Growth Trend Analysis
      • Absolute $ Opportunity Analysis
  5. Global Market Pricing Analysis 2020 to 2024 and Forecast 2025 to 2035
  6. Global Market Analysis 2020 to 2024 and Forecast 2025 to 2035, By Function
    • Introduction / Key Findings
    • Historical Market Size Value (USD Million) Analysis By Function, 2020 to 2024
    • Current and Future Market Size Value (USD Million) Analysis and Forecast By Function, 2025 to 2035
      • Presence/Absence
      • Code/OCR/ID
      • Measurement/Inspection
      • AI/Defect Detection
    • Y-o-Y Growth Trend Analysis By Function, 2020 to 2024
    • Absolute $ Opportunity Analysis By Function, 2025 to 2035
  7. Global Market Analysis 2020 to 2024 and Forecast 2025 to 2035, By Interface
    • Introduction / Key Findings
    • Historical Market Size Value (USD Million) Analysis By Interface, 2020 to 2024
    • Current and Future Market Size Value (USD Million) Analysis and Forecast By Interface, 2025 to 2035
      • Ethernet/IP/Profinet
      • IO-Link
      • Serial/Discrete
      • Others
    • Y-o-Y Growth Trend Analysis By Interface, 2020 to 2024
    • Absolute $ Opportunity Analysis By Interface, 2025 to 2035
  8. Global Market Analysis 2020 to 2024 and Forecast 2025 to 2035, By Form Factor
    • Introduction / Key Findings
    • Historical Market Size Value (USD Million) Analysis By Form Factor, 2020 to 2024
    • Current and Future Market Size Value (USD Million) Analysis and Forecast By Form Factor, 2025 to 2035
      • Compact Fixed
      • C-Mount Modular
      • Embedded/Board-Level
    • Y-o-Y Growth Trend Analysis By Form Factor, 2020 to 2024
    • Absolute $ Opportunity Analysis By Form Factor, 2025 to 2035
  9. Global Market Analysis 2020 to 2024 and Forecast 2025 to 2035, By End-Use Sector
    • Introduction / Key Findings
    • Historical Market Size Value (USD Million) Analysis By End-Use Sector, 2020 to 2024
    • Current and Future Market Size Value (USD Million) Analysis and Forecast By End-Use Sector, 2025 to 2035
      • Electronics
      • F&B/Packaging
      • Automotive
      • Logistics
      • Others
    • Y-o-Y Growth Trend Analysis By End-Use Sector, 2020 to 2024
    • Absolute $ Opportunity Analysis By End-Use Sector, 2025 to 2035
  10. Global Market Analysis 2020 to 2024 and Forecast 2025 to 2035, By Region
    • Introduction
    • Historical Market Size Value (USD Million) Analysis By Region, 2020 to 2024
    • Current Market Size Value (USD Million) Analysis and Forecast By Region, 2025 to 2035
      • North America
      • Latin America
      • Western Europe
      • Eastern Europe
      • East Asia
      • South Asia and Pacific
      • Middle East & Africa
    • Market Attractiveness Analysis By Region
  11. North America Market Analysis 2020 to 2024 and Forecast 2025 to 2035, By Country
    • Historical Market Size Value (USD Million) Trend Analysis By Market Taxonomy, 2020 to 2024
    • Market Size Value (USD Million) Forecast By Market Taxonomy, 2025 to 2035
      • By Country
        • USA
        • Canada
        • Mexico
      • By Function
      • By Interface
      • By Form Factor
      • By End-Use Sector
    • Market Attractiveness Analysis
      • By Country
      • By Function
      • By Interface
      • By Form Factor
      • By End-Use Sector
    • Key Takeaways
  12. Latin America Market Analysis 2020 to 2024 and Forecast 2025 to 2035, By Country
    • Historical Market Size Value (USD Million) Trend Analysis By Market Taxonomy, 2020 to 2024
    • Market Size Value (USD Million) Forecast By Market Taxonomy, 2025 to 2035
      • By Country
        • Brazil
        • Chile
        • Rest of Latin America
      • By Function
      • By Interface
      • By Form Factor
      • By End-Use Sector
    • Market Attractiveness Analysis
      • By Country
      • By Function
      • By Interface
      • By Form Factor
      • By End-Use Sector
    • Key Takeaways
  13. Western Europe Market Analysis 2020 to 2024 and Forecast 2025 to 2035, By Country
    • Historical Market Size Value (USD Million) Trend Analysis By Market Taxonomy, 2020 to 2024
    • Market Size Value (USD Million) Forecast By Market Taxonomy, 2025 to 2035
      • By Country
        • Germany
        • UK
        • Italy
        • Spain
        • France
        • Nordic
        • BENELUX
        • Rest of Western Europe
      • By Function
      • By Interface
      • By Form Factor
      • By End-Use Sector
    • Market Attractiveness Analysis
      • By Country
      • By Function
      • By Interface
      • By Form Factor
      • By End-Use Sector
    • Key Takeaways
  14. Eastern Europe Market Analysis 2020 to 2024 and Forecast 2025 to 2035, By Country
    • Historical Market Size Value (USD Million) Trend Analysis By Market Taxonomy, 2020 to 2024
    • Market Size Value (USD Million) Forecast By Market Taxonomy, 2025 to 2035
      • By Country
        • Russia
        • Poland
        • Hungary
        • Balkan & Baltic
        • Rest of Eastern Europe
      • By Function
      • By Interface
      • By Form Factor
      • By End-Use Sector
    • Market Attractiveness Analysis
      • By Country
      • By Function
      • By Interface
      • By Form Factor
      • By End-Use Sector
    • Key Takeaways
  15. East Asia Market Analysis 2020 to 2024 and Forecast 2025 to 2035, By Country
    • Historical Market Size Value (USD Million) Trend Analysis By Market Taxonomy, 2020 to 2024
    • Market Size Value (USD Million) Forecast By Market Taxonomy, 2025 to 2035
      • By Country
        • China
        • Japan
        • South Korea
      • By Function
      • By Interface
      • By Form Factor
      • By End-Use Sector
    • Market Attractiveness Analysis
      • By Country
      • By Function
      • By Interface
      • By Form Factor
      • By End-Use Sector
    • Key Takeaways
  16. South Asia and Pacific Market Analysis 2020 to 2024 and Forecast 2025 to 2035, By Country
    • Historical Market Size Value (USD Million) Trend Analysis By Market Taxonomy, 2020 to 2024
    • Market Size Value (USD Million) Forecast By Market Taxonomy, 2025 to 2035
      • By Country
        • India
        • ASEAN
        • Australia & New Zealand
        • Rest of South Asia and Pacific
      • By Function
      • By Interface
      • By Form Factor
      • By End-Use Sector
    • Market Attractiveness Analysis
      • By Country
      • By Function
      • By Interface
      • By Form Factor
      • By End-Use Sector
    • Key Takeaways
  17. Middle East & Africa Market Analysis 2020 to 2024 and Forecast 2025 to 2035, By Country
    • Historical Market Size Value (USD Million) Trend Analysis By Market Taxonomy, 2020 to 2024
    • Market Size Value (USD Million) Forecast By Market Taxonomy, 2025 to 2035
      • By Country
        • Kingdom of Saudi Arabia
        • Other GCC Countries
        • Turkiye
        • South Africa
        • Other African Union
        • Rest of Middle East & Africa
      • By Function
      • By Interface
      • By Form Factor
      • By End-Use Sector
    • Market Attractiveness Analysis
      • By Country
      • By Function
      • By Interface
      • By Form Factor
      • By End-Use Sector
    • Key Takeaways
  18. Key Countries Market Analysis
    • USA
      • Pricing Analysis
      • Market Share Analysis, 2024
        • By Function
        • By Interface
        • By Form Factor
        • By End-Use Sector
    • Canada
      • Pricing Analysis
      • Market Share Analysis, 2024
        • By Function
        • By Interface
        • By Form Factor
        • By End-Use Sector
    • Mexico
      • Pricing Analysis
      • Market Share Analysis, 2024
        • By Function
        • By Interface
        • By Form Factor
        • By End-Use Sector
    • Brazil
      • Pricing Analysis
      • Market Share Analysis, 2024
        • By Function
        • By Interface
        • By Form Factor
        • By End-Use Sector
    • Chile
      • Pricing Analysis
      • Market Share Analysis, 2024
        • By Function
        • By Interface
        • By Form Factor
        • By End-Use Sector
    • Germany
      • Pricing Analysis
      • Market Share Analysis, 2024
        • By Function
        • By Interface
        • By Form Factor
        • By End-Use Sector
    • UK
      • Pricing Analysis
      • Market Share Analysis, 2024
        • By Function
        • By Interface
        • By Form Factor
        • By End-Use Sector
    • Italy
      • Pricing Analysis
      • Market Share Analysis, 2024
        • By Function
        • By Interface
        • By Form Factor
        • By End-Use Sector
    • Spain
      • Pricing Analysis
      • Market Share Analysis, 2024
        • By Function
        • By Interface
        • By Form Factor
        • By End-Use Sector
    • France
      • Pricing Analysis
      • Market Share Analysis, 2024
        • By Function
        • By Interface
        • By Form Factor
        • By End-Use Sector
    • India
      • Pricing Analysis
      • Market Share Analysis, 2024
        • By Function
        • By Interface
        • By Form Factor
        • By End-Use Sector
    • ASEAN
      • Pricing Analysis
      • Market Share Analysis, 2024
        • By Function
        • By Interface
        • By Form Factor
        • By End-Use Sector
    • Australia & New Zealand
      • Pricing Analysis
      • Market Share Analysis, 2024
        • By Function
        • By Interface
        • By Form Factor
        • By End-Use Sector
    • China
      • Pricing Analysis
      • Market Share Analysis, 2024
        • By Function
        • By Interface
        • By Form Factor
        • By End-Use Sector
    • Japan
      • Pricing Analysis
      • Market Share Analysis, 2024
        • By Function
        • By Interface
        • By Form Factor
        • By End-Use Sector
    • South Korea
      • Pricing Analysis
      • Market Share Analysis, 2024
        • By Function
        • By Interface
        • By Form Factor
        • By End-Use Sector
    • Russia
      • Pricing Analysis
      • Market Share Analysis, 2024
        • By Function
        • By Interface
        • By Form Factor
        • By End-Use Sector
    • Poland
      • Pricing Analysis
      • Market Share Analysis, 2024
        • By Function
        • By Interface
        • By Form Factor
        • By End-Use Sector
    • Hungary
      • Pricing Analysis
      • Market Share Analysis, 2024
        • By Function
        • By Interface
        • By Form Factor
        • By End-Use Sector
    • Kingdom of Saudi Arabia
      • Pricing Analysis
      • Market Share Analysis, 2024
        • By Function
        • By Interface
        • By Form Factor
        • By End-Use Sector
    • Turkiye
      • Pricing Analysis
      • Market Share Analysis, 2024
        • By Function
        • By Interface
        • By Form Factor
        • By End-Use Sector
    • South Africa
      • Pricing Analysis
      • Market Share Analysis, 2024
        • By Function
        • By Interface
        • By Form Factor
        • By End-Use Sector
  19. Market Structure Analysis
    • Competition Dashboard
    • Competition Benchmarking
    • Market Share Analysis of Top Players
      • By Regional
      • By Function
      • By Interface
      • By Form Factor
      • By End-Use Sector
  20. Competition Analysis
    • Competition Deep Dive
      • Cognex
        • Overview
        • Product Portfolio
        • Profitability by Market Segments (Product/Age /Sales Channel/Region)
        • Sales Footprint
        • Strategy Overview
          • Marketing Strategy
          • Product Strategy
          • Channel Strategy
      • Banner Engineering
      • Basler AG
      • Datalogic
      • KEYENCE
      • OMRON
      • Pepperl+Fuchs (Visor)
      • SICK AG
      • Teledyne DALSA
      • ifm electronic
  21. Assumptions & Acronyms Used
  22. Research Methodology

List of Tables

  • Table 1: Global Market Value (USD Million) Forecast by Region, 2020-2035
  • Table 2: Global Market Value (USD Million) Forecast by Function, 2020-2035
  • Table 3: Global Market Value (USD Million) Forecast by Interface, 2020-2035
  • Table 4: Global Market Value (USD Million) Forecast by Form Factor, 2020-2035
  • Table 5: Global Market Value (USD Million) Forecast by End-Use Sector, 2020-2035
  • Table 6: Global Market Value (USD Million) Forecast by, 2020-2035
  • Table 7: Global Market Value (USD Million) Forecast by, 2020-2035
  • Table 8: North America Market Value (USD Million) Forecast by Country, 2020-2035
  • Table 9: North America Market Value (USD Million) Forecast by Function, 2020-2035
  • Table 10: North America Market Value (USD Million) Forecast by Interface, 2020-2035
  • Table 11: North America Market Value (USD Million) Forecast by Form Factor, 2020-2035
  • Table 12: North America Market Value (USD Million) Forecast by End-Use Sector, 2020-2035
  • Table 13: North America Market Value (USD Million) Forecast by, 2020-2035
  • Table 14: North America Market Value (USD Million) Forecast by, 2020-2035
  • Table 15: Latin America Market Value (USD Million) Forecast by Country, 2020-2035
  • Table 16: Latin America Market Value (USD Million) Forecast by Function, 2020-2035
  • Table 17: Latin America Market Value (USD Million) Forecast by Interface, 2020-2035
  • Table 18: Latin America Market Value (USD Million) Forecast by Form Factor, 2020-2035
  • Table 19: Latin America Market Value (USD Million) Forecast by End-Use Sector, 2020-2035
  • Table 20: Latin America Market Value (USD Million) Forecast by, 2020-2035
  • Table 21: Latin America Market Value (USD Million) Forecast by, 2020-2035
  • Table 22: Western Europe Market Value (USD Million) Forecast by Country, 2020-2035
  • Table 23: Western Europe Market Value (USD Million) Forecast by Function, 2020-2035
  • Table 24: Western Europe Market Value (USD Million) Forecast by Interface, 2020-2035
  • Table 25: Western Europe Market Value (USD Million) Forecast by Form Factor, 2020-2035
  • Table 26: Western Europe Market Value (USD Million) Forecast by End-Use Sector, 2020-2035
  • Table 27: Western Europe Market Value (USD Million) Forecast by, 2020-2035
  • Table 28: Western Europe Market Value (USD Million) Forecast by, 2020-2035
  • Table 29: Eastern Europe Market Value (USD Million) Forecast by Country, 2020-2035
  • Table 30: Eastern Europe Market Value (USD Million) Forecast by Function, 2020-2035
  • Table 31: Eastern Europe Market Value (USD Million) Forecast by Interface, 2020-2035
  • Table 32: Eastern Europe Market Value (USD Million) Forecast by Form Factor, 2020-2035
  • Table 33: Eastern Europe Market Value (USD Million) Forecast by End-Use Sector, 2020-2035
  • Table 34: Eastern Europe Market Value (USD Million) Forecast by, 2020-2035
  • Table 35: Eastern Europe Market Value (USD Million) Forecast by, 2020-2035
  • Table 36: East Asia Market Value (USD Million) Forecast by Country, 2020-2035
  • Table 37: East Asia Market Value (USD Million) Forecast by Function, 2020-2035
  • Table 38: East Asia Market Value (USD Million) Forecast by Interface, 2020-2035
  • Table 39: East Asia Market Value (USD Million) Forecast by Form Factor, 2020-2035
  • Table 40: East Asia Market Value (USD Million) Forecast by End-Use Sector, 2020-2035
  • Table 41: East Asia Market Value (USD Million) Forecast by, 2020-2035
  • Table 42: East Asia Market Value (USD Million) Forecast by, 2020-2035
  • Table 43: South Asia and Pacific Market Value (USD Million) Forecast by Country, 2020-2035
  • Table 44: South Asia and Pacific Market Value (USD Million) Forecast by Function, 2020-2035
  • Table 45: South Asia and Pacific Market Value (USD Million) Forecast by Interface, 2020-2035
  • Table 46: South Asia and Pacific Market Value (USD Million) Forecast by Form Factor, 2020-2035
  • Table 47: South Asia and Pacific Market Value (USD Million) Forecast by End-Use Sector, 2020-2035
  • Table 48: South Asia and Pacific Market Value (USD Million) Forecast by, 2020-2035
  • Table 49: South Asia and Pacific Market Value (USD Million) Forecast by, 2020-2035
  • Table 50: Middle East & Africa Market Value (USD Million) Forecast by Country, 2020-2035
  • Table 51: Middle East & Africa Market Value (USD Million) Forecast by Function, 2020-2035
  • Table 52: Middle East & Africa Market Value (USD Million) Forecast by Interface, 2020-2035
  • Table 53: Middle East & Africa Market Value (USD Million) Forecast by Form Factor, 2020-2035
  • Table 54: Middle East & Africa Market Value (USD Million) Forecast by End-Use Sector, 2020-2035
  • Table 55: Middle East & Africa Market Value (USD Million) Forecast by, 2020-2035
  • Table 56: Middle East & Africa Market Value (USD Million) Forecast by, 2020-2035

List of Figures

  • Figure 1: Global Market Pricing Analysis
  • Figure 2: Global Market Value (USD Million) Forecast 2020-2035
  • Figure 3: Global Market Value (USD Million) Share and BPS Analysis by Region, 2025 and 2035
  • Figure 4: Global Market Y-o-Y Growth Comparison by Region, 2025-2035
  • Figure 5: Global Market Attractiveness Analysis by Region
  • Figure 6: North America Market Incremental Dollar Opportunity, 2025-2035
  • Figure 7: Latin America Market Incremental Dollar Opportunity, 2025-2035
  • Figure 8: Western Europe Market Incremental Dollar Opportunity, 2025-2035
  • Figure 9: Eastern Europe Market Incremental Dollar Opportunity, 2025-2035
  • Figure 10: East Asia Market Incremental Dollar Opportunity, 2025-2035
  • Figure 11: South Asia and Pacific Market Incremental Dollar Opportunity, 2025-2035
  • Figure 12: Middle East & Africa Market Incremental Dollar Opportunity, 2025-2035
  • Figure 13: North America Market Value Share and BPS Analysis by Country, 2025 and 2035
  • Figure 14: Latin America Market Value Share and BPS Analysis by Country, 2025 and 2035
  • Figure 15: Western Europe Market Value Share and BPS Analysis by Country, 2025 and 2035
  • Figure 16: Eastern Europe Market Value Share and BPS Analysis by Country, 2025 and 2035
  • Figure 17: East Asia Market Value Share and BPS Analysis by Country, 2025 and 2035
  • Figure 18: South Asia and Pacific Market Value Share and BPS Analysis by Country, 2025 and 2035
  • Figure 19: Middle East & Africa Market Value Share and BPS Analysis by Country, 2025 and 2035
  • Figure 20: Global Market - Tier Structure Analysis
  • Figure 21: Global Market - Company Share Analysis

Frequently Asked Questions

How big is the smart vision sensors market in 2025?

The global smart vision sensors market is estimated to be valued at USD 2,800.0 million in 2025.

What will be the size of smart vision sensors market in 2035?

The market size for the smart vision sensors market is projected to reach USD 4,560.9 million by 2035.

How much will be the smart vision sensors market growth between 2025 and 2035?

The smart vision sensors market is expected to grow at a 5.0% CAGR between 2025 and 2035.

What are the key product types in the smart vision sensors market?

The key product types in smart vision sensors market are presence/absence, code/ocr/id, measurement/inspection and ai/defect detection.

Which interface segment to contribute significant share in the smart vision sensors market in 2025?

In terms of interface, ethernet/ip/profinet segment to command 45.0% share in the smart vision sensors market in 2025.

Explore Similar Insights

Future Market Insights

Smart Vision Sensors Market

Chat With

MaRIA

Hi There, I am MaRIA, Your Market Research Intelligence Assistant. How may I help you?